
Sample Category Title
Yen Quiet Ahead of BoJ Minutes
USD/JPY is showing little movement in the Tuesday session, as the pair trades at 111.50 in North American trade. On the release front, the BoJ will release the minutes of its April policy meeting. In the US, the current account deficit increased to $117 billion, but this beat the forecast of $124 billion. On Wednesday, the US will release Existing Home Sales and Crude Oil Inventories.
Japan's economy has shown improvement in 2017, as stronger global economic conditions have increased demand for Japanese exports. This in turn has buoyed the manufacturing sector. Still, inflation remains well below the BoJ's target of 2.0%, and this means that the bank will likely stick to its guns and maintain its ultra-accommodative monetary policy, which includes negative (short term) interest rates and an asset-purchase program of JPY 80 billion/year. The bank acknowledged the stronger economy in last week's rate statement, saying that private consumption was showing "increased resilience". This was more hawkish than the April statement, when the bank said that private consumption was "resilient". The economy has shown improvement in 2017, as stronger global demand has boosted the Japanese manufacturing and export sectors. There have been calls for the bank to lower its inflation goal, but BoJ Haruhiko Kuroda has insisted said that the ultra-loose policy would continue until the 2% target is achieved. The IMF is closely monitoring the BOJ's monetary policy, and on Monday, David Lipton, the IMF's first deputy managing director said that it supported the BoJ's target of 2.0%. At the same time, Lipton expressed doubt as to whether the bank's current policy would push inflation up to this level.
The Federal Reserve raised rates last week, but what surprised the markets was the upbeat tone of the rate statement. Fed policymakers noted that the labor market remained strong, and dismissed weak inflation levels as being temporary. On Monday, Federal Reserve of New York President Charles Dudley continued the upbeat message, cautioning the Fed against halting its current tightening cycle. Dudley said that the tight labor market should lead to higher wages, which in turn would push inflation to the Fed's target of 2.0%. If the Fed continues to send out a hawkish message, the odds of a rate hike in December (or even in September) are likely to increase.
Dollar Posts One-Month High; Sterling Hurt by Carney; Oil at 7-Month Lows
Today's European session was lacking major economic releases and as a result forex market traders placed most of their bets in reaction to comments by Fed officials, as well as remarks by Bank of England Governor Mark Carney who drove down expectations of a rate hike coming soon by the Bank.
The dollar index, a measure of the greenback's strength versus the currencies of major US trading partners, rose to a one-month high of 97.79 in today's trading. The greenback was helped by the comments of New York Fed President and FOMC voting member William Dudley who yesterday said that the Fed should remain on a path of rate normalization as diverting from that would risk inflation surging in the future and proving detrimental to the US economy. In addition and in response to recent weak inflation data, Dudley expressed optimism that wage growth will pick up and drive inflation to the Fed's target of 2%. It is noteworthy that Dudley's comments are usually perceived to be on the dovish side. Dallas Fed President, another FOMC voting member, Robert Kaplan is scheduled to give a speech at 19:00 GMT.
Turning to specific dollar pairs, dollar/yen hit a more than three-week high today when it reached 111.85. The greenback failed to maintain momentum though and the pair was last more or less flat on the day around 111.50. In the meantime, euro/dollar was marginally down at 1.1140, while most dollar gains on the day were recorded versus the pound.
As soon as the text of BoE Governor Mark Carney's speech at Mansion House became available today, it led to steep declines of the pound versus other majors such as the dollar and the euro. Carney disappointed market participants by saying that now is not the time to raise interest rates. This follows rising expectations that the BoE is closer to a rate hike after a greater-than-anticipated number of Monetary Policy Committee (MPC) members supported such a move during the Bank's latest meeting. Pound/dollar posted a two-month low of 1.2610 in today's trading, while euro/pound was last trading comfortably above the 0.88 handle – the pair started the day at 0.8749. Sterling is likely to face added volatility ahead of Brexit and other political developments.
In terms of US data, the country's current account deficit widened in the first quarter of the year, reaching $116.8 billion from the previous quarter's upwardly revised $114.0bn (from $112.4bn before). The rise was below expectations of a deficit amounting to $123.8bn. As a percentage of GDP, the deficit in the current account grew to 2.5% during the quarter from 2.4% in the previous quarter. Dollar/yen barely moved upon immediate release of the data.
Out of Germany, monthly producer prices declined more than expected in May. Specifically, they recorded a fall by 0.2%, slightly below the 0.1% decline expected. The figure also negatively compares to April's 0.4% growth. On a yearly basis, producer prices grew by 2.8% during the month, below forecasts of a 2.9% growth and April's 3.4%. The euro didn't have much of a reaction relative to the dollar and the pound as the data hit the markets in early European trading hours.
The outcome of today's bi-weekly dairy auction, which tends to affect the kiwi as New Zealand is a major dairy exporter, is expected to follow soon.
Concluding with oil, WTI and Brent crude both fell to seven-month lows today with losses nearing 3.0% on both benchmarks. WTI and Brent were last trading close to the day's lows at $42.94 and $45.66 a barrel respectively. The decline was attributed to indications of rising production in Libya and Nigeria, the two OPEC member countries which are not bound by OPEC's deal to cut production.
US$ Index (DXY), Important Bottoming and 8% Rally?
Nearer term $ index outlook :
In the Jun 13th email said that further short term downside below that Jun 6th bottom at 96.50 was favored, but such weakness would be limited and part of a larger bottoming. The market did indeed slip to a slight new low at 96.30 on Jun 14th before sharply reversing that day, and has continued higher since. Lots of positives add to that view of a bottom and include the rapid reversal from that slight new low (sign of underlying strength), likely completion of the 5 wave decline from at least the May 9th high at 102.25, bullish technicals (see bull divergence/buy mode on the daily macd) and view of an approaching more major low (eventual gains above that Jan high at 103.80, see longer term below). At this point, there is still no confirmation of a more important low "pattern-wise" (5 waves up for example), leaving open some scope for another few weeks of this broader ranging/bottoming. Also don't forget that the long held "ideal" area to form a more major top in eur/$ is above at 1.1425/75 (top of 2 year falling wedge, seen email from yesterday) and in turn adds to this risk of a further period of bottoming in the US$ index/DXY (inverse relationship). Nearby resistance is seen at 98.15/30 (both the bearish trendline from Apr 10th and the broken falling support line from Feb), with a break/close clearly above arguing more substantial gains more directly ahead. Nearby support is seen at the bull trendline from Dec 15th (adjusts for that Jun 14th spike), and again that whole 96.15/30 area (Jun 14th low, falling support line from Feb). Bottom line : quick bounce back from that slight new low 96.30 adds to the view of that larger bottoming, but still with some risk of another few weeks of chopping as part of the process.
Strategy/position:
Long Jun 8th above that bear t-line from May 11th (then 96.65, closed at 96.80). For now given that risk for a further period of this larger bottoming, would use an aggressive stop on a close 15 ticks below that bull t-line from Jun 15th. However, with such a break (if it occurs) seen part of this larger bottoming, will rebuy 96.35 if taken out (and then stopping on a close 15 ticks below the falling support line from Feb). Remember it will often take a couple of attempts as these larger bottoms form before more substantial gains are finally seen.
Long term outlook:
No change as the view since mid May of a month or so of ranging with a downward bias as a more major bottom approaches, continues to play out. As discussed above, that more major bottom may finally be "complete"/in place and with eventual gains back to the Jan high at 103.80 (and even above) favored. In the big picture, the 3 wave rally from the May 2016 low at 91.90 to the Jan 3rd high at 103.80 (A-B-C) argues a large "complex" topping, and still favor the view of a huge rising wedge since May 2015. Though seen as a reversal pattern, wedges break down into 5 legs and "ideally" targets a final upleg back to that Jan high at 103.80 (and even just above) in that final leg (wave V). But as mentioned above, there does remain some risk for another few weeks of ranging/bottoming before more substantial upside is seen (see in red on weekly chart/2nd chart below). Bottom line : in process of a major bottoming and with eventual gains above the Jan high at 103.80 after.
Strategy/position:
With the market seen in process of a major bottoming (and eventual gains above 103.80), looking to switch the longer term bias to bullish. So for now would switch on a close above 98.45 (just above that 98.15/30 resistance area) or 96.35 (given the risk for further bottoming).
Current:
Near term : long Jun 8th at 96.80, scope for a further period of ranging/basing ahead.
Last : long May 5 at 98.75.stopped May 16 below t-line from Feb (98.45, closed 98.10).
Longer term : major bottoming for eventual gains above that Jan 103.80 high, see entry strategy above.
Last: :bull bias May 5 at 98.75 to neutral may 16th at 98.10.
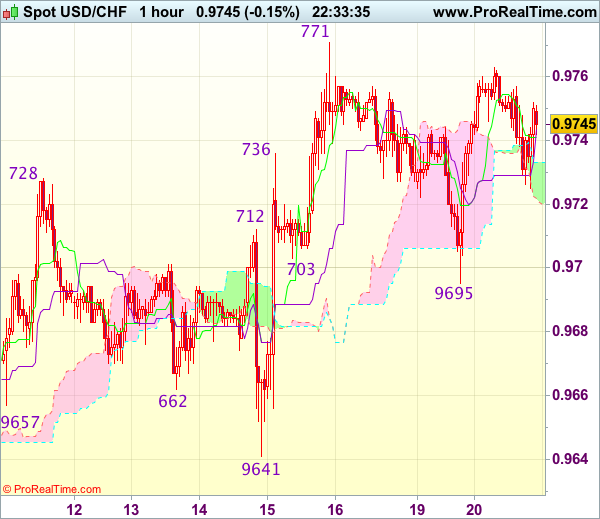
Trade Idea Wrap-up: USD/CHF – Hold long entered at 0.9705
USD/CHF - 0.9748
Most recent candlesticks pattern : N/A
Trend : Near term up
Tenkan-Sen level : 0.9741
Kijun-Sen level : 0.9744
Ichimoku cloud top : 0.9733
Ichimoku cloud bottom : 0.9722
Original strategy :
Bought at 0.9705, Target: 0.9805, Stop: 0.9690
Position : - Long at 0.9705
Target : - 0.9805
Stop : - 0.9690
New strategy :
Hold long entered at 0.9705, Target: 0.9805, Stop: 0.9690
Position : - Long at 0.9705
Target : - 0.9805
Stop : - 0.9690
As the greenback found renewed buying interest at 0.9695 and staged a strong rebound, retaining our bullishness and suggesting the pullback from 0.9771 has ended there, hence upside bias remains for a retest of said resistance, break there would extend recent rise from 0.9613 low to resistance at 0.9808 but reckon previous resistance at 0.9825 would hold from here due to near term overbought condition, bring retreat later.
In view of this, we are holding on to our long position entered at 0.9705. Below said support at 0.9695 would defer and risk weakness towards said support at 0.9641 but only break there would abort and revive bearishness, this would also suggest the rebound from 0.9613 has ended instead, bring retest of this level later.
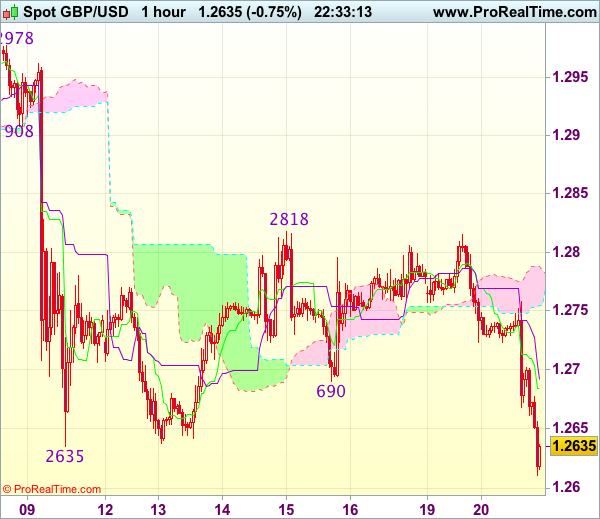
Trade Idea Wrap-up: GBP/USD – Sell at 1.2715
GBP/USD - 1.2635
Most recent candlesticks pattern : N/A
Trend : Near term down
Tenkan-Sen level : 1.2685
Kijun-Sen level : 1.2692
Ichimoku cloud top : 1.2788
Ichimoku cloud bottom : 1.2755
Original strategy :
Sell at 1.2715, Target: 1.2615, Stop: 1.2750
Position : -
Target : -
Stop : -
New strategy :
Sell at 1.2715, Target: 1.2615, Stop: 1.2750
Position : -
Target : -
Stop : -
As cable has fallen again and broke below indicated support at 1.2635, adding credence to our view that recent decline has resumed and bearishness remains for further fall to 12600-05, then towards 1.2575-80, however, near term oversold condition would limit downside to 1.2550 and reckon 1.2520-25 would hold from here, risk from there is seen for a rebound later.
In view of this, we are looking to sell cable on recovery as 1.2715-20 should limit upside. Only above 1.2755-60 would abort and suggest an intra-day low is formed instead, bring a stronger rebound to 1.2780 but price should falter below said resistance at 1.2818.
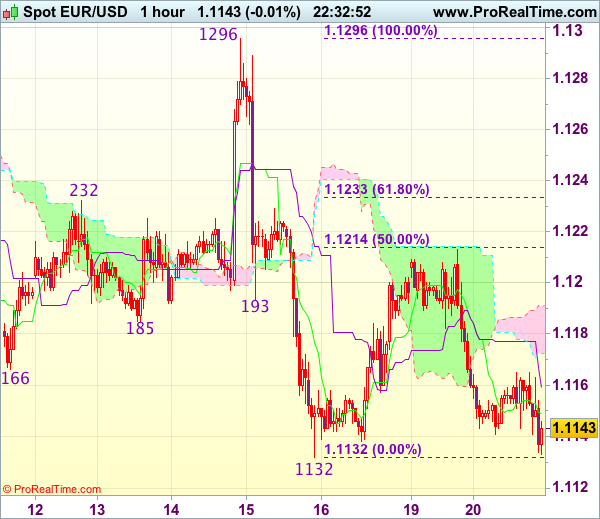
Trade Idea Wrap-up: EUR/USD – Sell at 1.1185
EUR/USD - 1.1143
Most recent candlesticks pattern : N/A
Trend : Near term down
Tenkan-Sen level : 1.1149
Kijun-Sen level : 1.1159
Ichimoku cloud top : 1.1191
Ichimoku cloud bottom : 1.1173
Original strategy :
Sell at 1.1185, Target: 1.1085, Stop: 1.1220
Position : -
Target : -
Stop : -
New strategy :
Sell at 1.1185, Target: 1.1085, Stop: 1.1220
Position : -
Target : -
Stop : -
The single currency met resistance at 1.1213 and retreated quite sharply from there, suggesting the rebound from 1.1132 has ended there and retest of said support would be seen, however, break there is needed to confirm recent decline has resumed and extend weakness to previous support at 1.1109, a drop below this level would encourage for subsequent fall to 1.1075-80 which is likely to hold on first testing.
In view of this, we are looking to sell euro on recovery as 1.1185-90 should limit upside. Only above 1.1213-14 (said resistance and 50% Fibonacci retracement of 1.1296-1.1132) would defer and risk a stronger rebound to 1.1230-35 (61.8% Fibonacci retracement) but upside should be limited to 1.1260-70, bring another decline later.
Trade Idea Wrap-up: USD/JPY – Buy at 111.10
USD/JPY - 111.54
Most recent candlesticks pattern : N/A
Trend : Near term up
Tenkan-Sen level : 111.55
Kijun-Sen level : 111.51
Ichimoku cloud top : 111.07
Ichimoku cloud bottom : 110.53
Original strategy :
Buy at 111.10, Target: 112.10, Stop: 110.75
Position : -
Target : -
Stop : -
New strategy :
Buy at 111.10, Target: 112.10, Stop: 110.75
Position : -
Target : -
Stop : -
As the greenback has maintained a firm undertone after breaking above previous resistance at 111.42, adding credence to our bullish view that the rise from 108.82 low is still in progress for retracement of recent decline from 114.37, hence further gain to 111.90-95 (50% projection of 108.82-111.42-110.65) would be seen, however, overbought condition should prevent sharp move beyond resistance at 112.13 and 112.25 (61.8% Fibonacci retracement of 114.37-108.82 and 61.8% projection) should hold on first testing, price should falter below 112.50.
In view of this, we are looking to buy dollar on pullback as 111.00-05 should limit downside. Below 110.85-90 would defer and suggest a temporary top is formed instead, risk retreat towards previous support at 110.65 but reckon previous resistance at 110.35 would turn into support and contain downside.

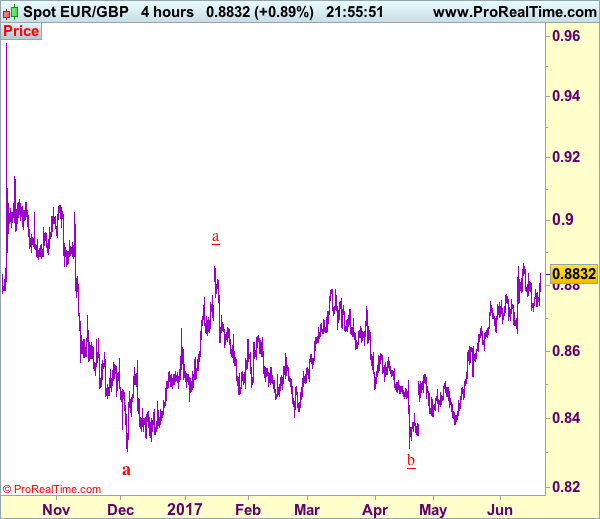
Trade Idea: EUR/GBP – Buy at 0.8660
EUR/GBP - 0.8823
Recent wave: Major double three (A)-(B)-(C)-(X)-(A)-(B)-(C) is unfolding and 2nd (A) has possibly ended at 0.6936.
Trend: Near term up
Original strategy :
Buy at 0.8660, Target: 0.8860, Stop: 0.8620
Position : -
Target : -
Stop : -
New strategy :
Buy at 0.8660, Target: 0.8860, Stop: 0.8620
Position : -
Target : -
Stop : -
Although the single currency has rebounded after finding support at 0.8719 and retest of recent high at 0.8866 cannot be ruled out, break there is needed to confirm recent erratic upmove from 0.8304 low has resumed and extend further gain to 0.8880, then 0.8900, having said that, as broad outlook remains consolidative, reckon current c leg of larger degree wave b should be limited to 0.8950 and price should falter well below 0.9000, bring retreat later. If said resistance at 0.8866 continues to hold, then further consolidation would take place and another retreat to 0.8740-50 cannot be ruled out, however, downside should be limited to support at 0.8652, bring another rise later.
In view of this, we are looking to buy euro on subsequent pullback but one should exit on such rise. Below 0.8650 would defer and risk test of 0.8620, a break below there would signal top is formed instead, bring further fall to 0.8620, then 0.8600 which is likely to hold from here.
Our preferred count is that, after forming a major top at 0.9805 (wave V), (A)-(B)-(C) correction is unfolding with (A) leg ended at 0.8400 (A: 0.8637, B: 0.9491 and 5-waver C ended at 0.8400. Wave (B) has ended at 0.9413 and impulsive wave (C) has either ended at 0.8067 or may extend one more fall to 0.8000 before prospect of another rally. Current breach of indicated resistance at 0.9043 confirms our view that the (C) leg has ended and bring stronger rebound towards 0.9150/54, then towards 0.9240/50.
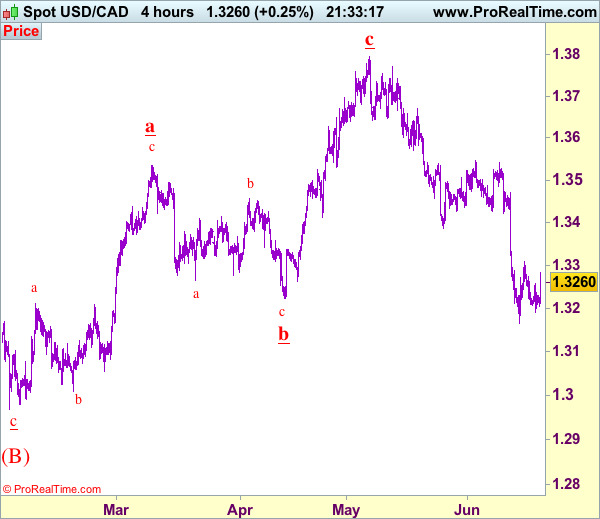
Trade Idea: USD/CAD – Sell at 1.3350
USD/CAD - 1.3280
Recent wave: Only wave v of c has ended at 0.9407 and wave C of major A-B-C correction is underway for headway to 1.4700
Trend: Near term down
Original strategy :
Sell at 1.3350, Target: 1.3130, Stop: 1.3410
Position: -
Target: -
Stop: -
New strategy :
Sell at 1.3350, Target: 1.3130, Stop: 1.3410
Position: -
Target: -
Stop:-
As the greenback found support at 1.3191 and has rebounded, retaining our view that further consolidation above 1.3165 support (last week’s low) would be seen and another bounce to 1.3308, above there would bring retracement of recent fall to 1.3330 but 1.3360-65 would limit upside and bring another decline later, below said support at 13191 would bring retest of 1.3165 but break there is needed to confirm reentry decline from 1.3794 top has resumed and extend weakness to 1.3100-10 and later towards previous support at 1.3078.
In view of this, would be prudent to sell again on subsequent recovery as 1.3350-60 should limit upside. Above previous support at 1.3387 (now resistance) would defer and suggest low is possibly formed, bring a stronger rebound to 1.3420-25 but break there is needed to provide confirmation.
To recap, wave B from 1.3066 is unfolding as an a-b-c and is sub-divided as a: 1.2192, b: 1.2716 and wave c is a 5-waver with i: 1.1983, ii: 1.2506, extended wave iii with minor iii at 1.0206, wave iv ended at 1.0781 and wave v as well as wave iii has ended at 0.9931, hence the subsequent choppy trading is the wave iv which is unfolding as (a)-(b)-(c) with (a) leg of iv ended at 1.0854, followed by (b) leg at 1.0108 and (c) leg as well as the wave iv ended at 1.0674. The wave v is sub-divided by minor wave (i): 0.9980, (ii): 1.0374, (iii): 0.9446, (iv): 0.9913 and (v) as well as v has possibly ended at 0.9407, therefore, consolidation with upside bias is seen for major correction, indicated target at 1.3700 and 1.4000 had been met and further gain to 1.4700 would be seen later.
Sterling Nosedives as Carney Signals no Rate Hike
- European stock markets trade mixed near opening levels in a session devoid of eco releases. US stock markets opened in similar, lacklustre, vein.
- "Now is not yet the time" to tighten monetary policy, BoE governor Carney said in his delayed Mansion House speech, in comments that weighted on sterling. The speech is the governor's first public appearance since three members of the Bank's currently eight-person monetary policy committee voted to raise interest rates last week.
- Boston Fed Rosengren said that persistently low interest rates mean monetary policy will be less capable of fighting off future financial shocks and recessions. Vice-Chair Fischer warned that low rates may have led to "high" house prices.
- The Czech central bank may put off raising interest rates to beyond the third quarter if the crown keeps strengthening at the pace seen in recent weeks, bank board member Marek Mora said.
- The Germany economy is firing on all cylinders, according to the country's influential Ifo think-tank, which has delivered a healthy bump to its GDP growth forecasts for the eurozone's largest economy over the next year (1.8% for 2017 & 2% for 2018), describing it as "strong and stable".
- Hungary's central bank kept its policy rate unchanged at 0.9% and decided to lower its cap on three-month deposits to 300 billion forints by the end of September from 500 billion at the end of June. The bank also reiterated that it would be ready to loosen monetary conditions further via unconventional tools if needed.
- Oil dropped to the lowest in seven months (Brent crude <$46/barrel) amid a revival in output from Libya and rising volumes of fuel held in floating storage. Tonight and tomorrow, weekly inventory data are scheduled for release.
- The ECB is in no hurry to talk about tapering, though it has just six months of its current bond-buying program left. Officials see no need to make a decision until at least September, people familiar to the issue said. That means plans for 2018 may be disclosed only at the October meeting or even in December.
Rates
Boring trading as new impetus is missing
Core bonds moved in a tight range as no eco data of importance were released and central bankers spoke about macro-prudential issues and at best sideways about the economy or policy outlook. The US curve bull flattened with yields down between flat (2-yr) and 2.7 bps. German yields increased by 0.8 bp at the 2-yr and declined between 0.2 bp (2 yr) and 2.3 bps (30-yr).
Fed Rosengren said the low interest rate environment limited the central bank's ability to respond in case of negative shocks and could result in greater reliance on less traditional tools rather than interest rates. He added that policymakers need to factor in "exit strategies from very low rates" and how policy should respond to downturns. One could interpret this as hawkish in the sense that he wants rates to be away from very low levels ahead of a downturn. Rosengren in March favoured 4 rate hikes this year, but we don't know whether he changed his rate projection in June. However, we wouldn't draw too much conclusion from the summary we got from his remarks on a conference on macro-prudential policies.
After the US curve bear steepening yesterday, there was a bull flattening today. The only move worth mentioning was a small jump higher of the Bund when BoE Carney said it was not yet time to raise rates. The Bund rise came in sympathy with a similar jump in the gilt yields. Oil prices were under downside pressure and might have helped the curve flatten, but a time consistent move on the bond market was absent. Equities gradually slipped lower after a strong start, but once more its impact on bonds was small. The overall bond markets remained quiet throughout the session. Volumes remain far below "normal" levels. On intra-EMU bond markets, the peripheral spread narrowing continued, but slowed with Spain outperforming (+4 bps) and Portugal underperforming (+2 bps).
Currencies
USD holding tight ranges
With no important eco data on the agenda, there was again no great story behind USD trading. EUR/USD hovered close to, mostly slightly north of 1.1150. USD/JPY touched a short-term top in the 111.75/80 area, but reversed earlier gains as core yields and equities declined slightly.
Overnight, Asian equities traded mixed. Japan outperformed. Fed's Evens spoke more cautious than Dudley, but the dollar maintained yesterday's gains against the euro (EUR/USD 1.1155 area) and even gained slightly against the yen (111.70 area).
European equities opened strong. The dollar tried to gain some further ground, but the move immediately ran into resistance. European yields declined slightly after the Carny comments, but there was no obvious impact on EUR/USD. The pair hovered up and down in the 1.1140/65 area. USD/JPY gradually slipped off the intraday highs as core bond yields drifted south as the equity rally ran into resistance.
There was still no high profile news in the US to give clear directional guidance for USD trading. The US Q1 current account deficit widened less than expected but didn't help the dollar. Equity gains evaporated further. In technical trade EUR/USD and USD/JPY moved with a marginally negative bias. EUR/USD returned to the mid 1.11 area. The pair is holding within reach of the post-Fed low, but there is no strong enough driver for further USD gains. USD/JPY is changing hands in the 111.40/50 area.
Sterling nosedives as Carney signals no rate hike
Today, sterling traders kept a close eye on a speech of BoE governor Carney. Last week, markets were spooked by an unexpected MPC vote as thee members voted to raise rates by 25 basis points to keep inflation in check. The vote triggered a rebound of sterling. Today, markets were keen to see how much weight Carney would give to the recent rise in inflation. BoE governor Carney gave a straightforward assessment: 'Given the mixed signals on consumer spending and business investment, and given the still subdued domestic inflationary pressures, in particular anaemic wage growth, now is not yet the time to begin that adjustment (a rate hike)' The recent political and economic uncertainty apparently also creates discord within the BoE. UK bond yields and sterling nosedived. EUR/GBP rebounded north of 0.88. Cable dropped well below the 1.27 barrier. The pair trades currently in the 1.2650 area.