
Sample Category Title
GBPAUD Focus To The Downside, Testing 200-Day Moving Average
GBPAUD bias is to the downside after a break below the 50-day moving average and below the key psychological 1.7000 level on June 9.
Momentum oscillators are showing that the downside bias is gathering momentum. RSI is trending down and is below 50 in bearish territory, while MACD is also showing bearishness as it is below zero and falling.
Prices are currently testing the 200-day moving average at 1.6654. It is expected to provide support but a daily close below it would bring about more weakness in the market and accelerate a further decline. Next support would come into view at 1.6240 before 1.5902 (March 16 low).
To the upside, major resistance is provided by the psychological 1.7000 level. A break above this opens the way towards 1.7200 and 1.7500.From here, we could see a re-test of the high at 1.7650. This would bring about a bullish bias and a resumption of the uptrend from 1.5902.
As long as the market can stay above the 200-day moving average, the uptrend that took place from 1.5902 to 1.7650 will likely remain intact. But the short-term bias is to the downside. Looking at the bigger picture, the pair has a neutral outlook.
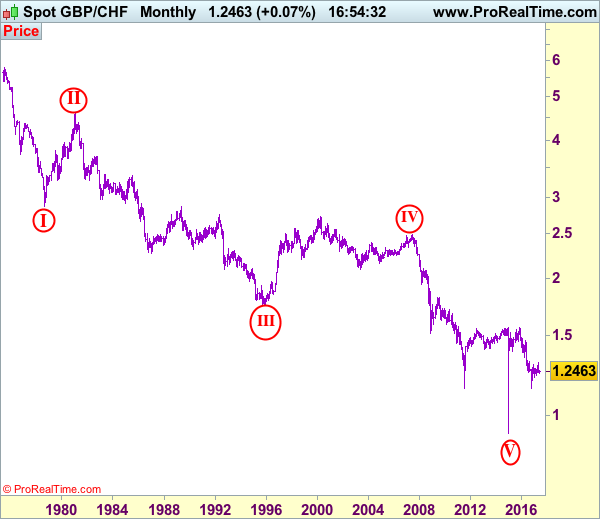
GBP/CHF Elliott Wave Analysis
GBP/CHF – 1.2470
GBP/CHF – Circle wave v ended at 0.9106 and major correction has commenced for subsequent gain to 1.5547.
Sterling finally found support at 1.2241 last week and has rebounded since, suggesting 1-2 weeks of consolidation above this level would be seen and recovery to 1.2500, then test of 1.2540-50 (previous resistance and 38.2% Fibonacci retracement of 1.3069-1.2241) is likely, however, reckon upside would be limited to 1.2655-60 (50% Fibonacci retracement) and bring another decline later (probably in early Q3). Below 1.2320-25 would suggest the rebound from 1.2241 has ended, bring retest of this level, break there would signal the fall from 1.3069 top is still in progress for test of previous chart support at 1.2215, then 1.2150 but loss of momentum should prevent sharp fall below another chart support at 1.2102 (this year’s low).
To recap the larger degree count, the selloff from 2.4965 (July 2007) is the beginning of wave V with circle and is labeled as 1: 2.3760, 2: 2.4425, wave 3 extension ended at 1.1470, followed by wave 4 at 1.5547, the quick rebound from 0.9106 suggests wave 5 as well as entire circle wave V could have ended there, hence consolidation with mild upside bias is seen for major correction to take place, bring initial test of 1.5547 (previous 4th of a lesser degree).
On the upside, whilst initial recovery to 1.2540-50 cannot be ruled out, reckon upside would be limited to 1.2655-60 (50% Fibonacci retracement of 1.3069-1.2241) and bring another decline later. Only a daily close above resistance at 1.2690-95 would abort and suggest first leg of decline from 1.3069 has ended, bring a stronger rebound to 1.2740-50, however, as top has been formed at 1.3069, still reckon upside would be limited to 1.2785-90 and price should falter below 1.2850-60, bring another decline later.
Recommendation: Sell at 1.2655 for 1.2355 with stop below 1.2755.

On the Monthly chart, the longer-term count is that major downtrend is under way with circle wave I at 2.8645 (Sep 1.978), then wave II with circle at 4.6175 (Feb 1981), the wave III with circle ended at 1.7425 (Nov 1995) and followed by wave IV with circle at 2.4965 (July 2007 with a short wave C) and wave V with circle has possibly ended at 0.9106. A monthly close above 1.5547 would add credence to this view, bring major correction to 1.7000, then towards psychological level at 2.0000.
Forex Technical Analysis: EUR/USD, USD/JPY, GBP/USD
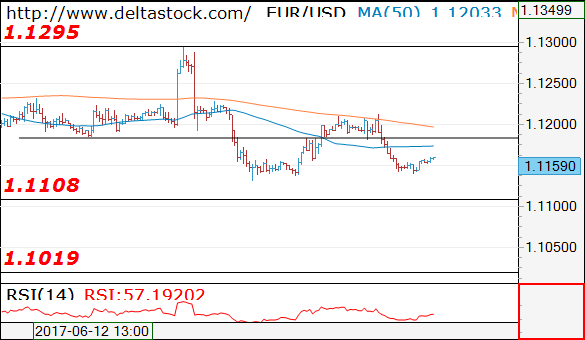
EUR/USD
Current level - 1.1159
The outlook here is bearish below 1.1180 resistance, for a slide through the local low at 1.1132, towards 1.1020 major support.
| Resistance | Support | ||
| intraday | intraweek | intraday | intraweek |
|
1.1180 |
1.1360 |
1.1108 |
1.1022 |
|
1.1300 |
1.1610 |
1.1020 |
1.0838 |
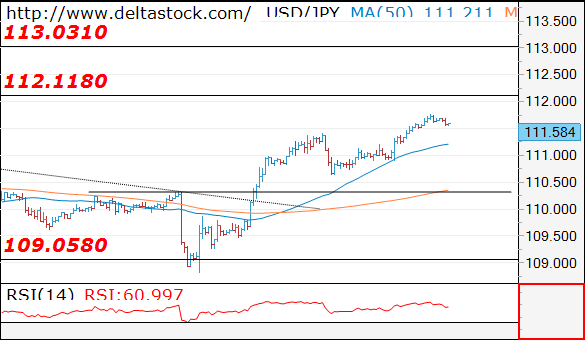
USD/JPY
Current level - 111.58
The violation of the previous high at 111.40 signals, that the uptrend is renewed, heading for a break through 112.10 area, towards 113.00 zone.
| Resistance | Support | ||
| intraday | intraweek | intraday | intraweek |
|
112.10 |
112.10 |
111.40 |
109.08 |
|
113.00 |
114.30 |
109.10 |
108.12 |
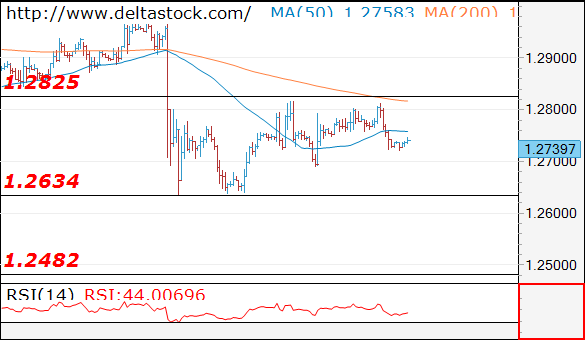
GBP/USD
Current level - 1.2739
My outlook here remains bearish below 1.2825, for a slide through 1.2634 low, towards 1.2480 support area.
| Resistance | Support | ||
| intraday | intraweek | intraday | intraweek |
|
1.2825 |
1.2970 |
1.2685 |
1.2610 |
|
1.2880 |
1.3050 |
1.2610 |
1.2480 |
Trade Idea: GBP/USD – Sell at 1.2750
GBP/USD – 1.2682
Recent wave: Wave V of larger degree wave (III) has ended at 1.1986 and major correction has commenced from there for gain to 1.3000 and 1.3140-50
Trend: Near term down
Original strategy :
Sold at 1.2750, stopped at 1.2810
Position: - Short at 1.2750
Target: -
Stop: - 1.2810
New strategy :
Sell at 1.2750, Target: 1.2600, Stop: 1.2810
Position: -
Target: -
Stop:-
Sterling has retreated after faltering below indicated resistance at 1.2818, retaining our bearishness and suggesting the rebound from 1.2635 has ended at 1.2818, hence consolidation with downside bias remains for retest of said support, however, break there is needed to confirm recent decline from 1.3048 top has resumed for retracement of early upmove to 1.2600, having said that, downside should be limited to 1.2550 and reckon previous support at 1.2515 would hold.
Our preferred count on the daily chart is that cable's rebound from 1.3500 (wave (A) trough) is unfolding as a wave (B) with A ended at 1.7043, followed by triangle wave B and wave C as well as wave (B) has ended at 1.7192, the subsequent selloff is the larger degree wave (C) which is still unfolding with minor wave (III) of larger degree wave 3 ended at 1.1986, hence wave (IV) correction is in progress which could either be a triangle wave (IV) of a complex formation but upside should be limited to 1.3500 and price should falter well below 1.4000, bring another decline in wave (V) of 3 for weakness to 1.1500, then 1.1200.
On the upside, expect recovery to be limited to 1.2750-55 and bring another decline. Only above said resistance at 1.2818 would defer and risk a stronger rebound to 1.2860-70 would but price should falter below 1.2900, bring another selloff later.

Trade Idea: GBP/JPY – Exit long entered at 141.50
GBP/JPY - 141.55
Recent wave: Medium term low formed at 120.50 and (A)-(B)-(C) major correction has commenced with (A) leg ended at 148.45, hence wave (B) is unfolding for retreat to 131.00-10.
Trend: Near term down
Original strategy:
Bought at 141.50, Target: 143.50, Stop: 140.90
Position: - Long at 141.50
Target: - 143.50
Stop: - 140.90
New strategy :
Exit long entered at 141.50,
Position: - Long at 141.50
Target: -
Stop:-
Despite intra-day brief rise to 142.50, lack of follow through buying and the subsequent retreat after faltering below indicated previous resistance at 142.75 suggest a temporary top is possibly formed and consolidation below this level would be seen, near term downside risk has increased for further fall to 141.00, then towards 140.40-50, however, still reckon downside would be limited to 140.15-20 and price should stay above 140.00, bring another rebound later.
In view of this, would be prudent to exit long and look to buy sterling again on subsequent retreat. Above said resistance at 142.50 would signal the rise from 138.70 low is still in progress for retracement of recent selloff to 143.05-10, then 143.50-60 but near term overbought condition should limit upside to resistance at 143.95-00.
Our preferred count is that larger degree wave V with circle is unfolding from 251.12 with wave (I) 219.34, (II): 241.38 and wave (III) is subdivided into 1: 192.60, 2: 215.89 (23 Jul 2008) and wave 3 ended at 118.87 earlier in 2009. The correction from there to 162.60 is wave 4 which itself is a double three and is labeled as first a-b-c ended at 151.53, followed by wave x at 139.03, 2nd a ended at 162.60, 2nd b at 146.75 and 2nd c leg of wave 4 ended at 163.00. Therefore, the decline from 163.00 to 116.85 is now treated as wave 5 which also marked the end of larger degree wave (III), hence wave (IV) major correction has commenced for retracement of the wave (III) from 241.38 and upside target at 183.95-00 (50% Fibonacci retracement of the wave (II) from 241.38) had been met, a drop below 160.00 would suggest wave (IV) has ended at 195.85, bring decline in wave (V) for initial weakness to 130 (already met) and 120.

Technical Outlook: Pound Falls Below 1.2700 Pivot On Dovish Carney
Sterling extends weakness below pivotal support at 1.2700 on Tuesday, as Monday's strong upside rejection at daily cloud top and close in red weighed on market. The pair accelerated further down on dovish comments from BoE's Carney about interest rates on Tuesday. Eventual break below 1.2700 (Fibo 61.8% of 1.2635/1.2817 upleg) signaled double-top at 1.2817/14, where recovery attempts stalled and opened way for full retracement of 1.2635/1.2817correction. Near-term focus turned lower on break of 1.2700 handle, with downside pressure increasing on formation of 10/55SMA bear-cross. Higher base and key support at 1.2635 zone, reinforced by 100SMA is coming under pressure, with break here to signal extension of broader downtrend from 1.3000 zone towards next strong support at 1.2556 (200SMA).
Res: 1.2700, 1.2750, 1.2775, 1.2793
Sup: 1.2667, 1.2635, 1.2600, 1.2556
EUR/USD Analysis: Channel Pattern Spotted
On Tuesday morning various additional pieces of information were spotted on the hourly chart for the EUR/USD currency pair. First of all, it is clear that the 1.1140 level is working as a support level, as it has held the line and forced a rebound already twice. Secondly, a short term descending channel has been spotted. In accordance with the channel the pair is set to decline in a 45 degree angle. Meanwhile, regarding the next twenty four hours, the common European currency is highly likely going to surge until it bounced off a resistance level either at 1.1175 or 1.1190. After a bounce off the pair would continue the decline down to the weekly S1, which is located at the 1.1121 level. However, traders should take into account the mentioned 1.1140 level.
GBP/USD Analysis: Approaches Critical Point
Monday did not favour the Pound, as the Cable once again fell under the monthly S1. However, support was found near 1.2725, namely the ascending channel's support line. The Sterling risks breaking this trend-line if supply at the monthly S1 is strong enough for such an occurrence. Technical indicators support the possibility of the negative outcome today, but the British currency could still receive a boost and outperform the Greenback. Consequently, the GBP/USD pair would then be able to finally stabilise above the tough resistance cluster, which rests circa 1.2770. In turn, a close above this zone is likely to allow the Cable to continue recovering until all post-parliamentary election losses are erased.
USD/JPY Analysis: Attempts To Break Through 111.80
As was anticipated, the US Dollar was able to outperform the Japanese Yen on Monday. Further gains could be limited by the 111.80 level, namely the monthly PP, which could result in the recently acquired up-trend to be broken. A successful surge above the mentioned pivot point is expected to prolong the given pair's bullish momentum and put the monthly R1 at 113.35 into perspective. Technical studies, however, are unable to confirm the possibility of such an outcome, thus, we should not rule out the bearish scenario—a break of the up-trend. Even though the pair is supported by a number of significant levels, downside risks persist amid political and fundamental uncertainties. Ultimately, the pair could slide back to 109.22 if the up-trend gets pierced today.
Trade Idea: EUR/JPY – Buy at 123.80
EUR/JPY - 124.36
Recent wave: wave v of (C) ended at 94.12 and major correction in wave A has ended at 149.79
Trend: Near term up
Original strategy:
Buy art 123.40, Target: 125.40, Stop: 122.80
Position: -
Target: -
Stop: -
New strategy :
Buy art 123.80, Target: 125.30, Stop: 123.20
Position: -
Target: -
Stop:-
As the single currency has continued moving higher, suggesting the rise from 122.40 (last week’s low) is still in progress and bullishness remains for this move to extend further gain to 125.00, however, break of resistance at 125.31 is needed to retain upside bias and signal correction from 125.82 has ended at 122.40, bring subsequent rise towards this level which is likely to hold on first testing due to overbought condition.
In view of this, would not chase this rise here and we are looking to buy euro on dips as 123.80 should limit downside and bring another rebound later. Below 123.30-35 would defer and suggest first leg of rebound from 122.40 has ended instead, risk further weakness to 122.90-00 but price should stay well above said support at 122.40, bring another rebound later.
Our latest preferred count is that wave (ii) is ABC-X-ABC which ended at 123.33 and wave (iii) is unfolding with wave iii ended at 100.77, followed by wave iv at 111.57 and wave v as well as the wave (iii) has ended at 97.04, followed by wave (iv) at 111.43 and wave (v) has ended at 94.12 which is also the end of the larger degree v, this also implied the major wave (C) has also ended there, hence major correction has commenced from there with (A) leg unfolding in its lower degree wave c which has possibly ended at 145.69. Under this count, A-B-C wave (B) has commenced with A leg ended at 136.23, wave B at 143.79 and wave C has possibly ended at 149.79.
Our larger degree count is that the decline from 139.26 is wave (C) and is sub-divided into a diagonal triangle i-ii-iii-iv-v with wave i - 105.44, wave ii- 123.33, wave iii - 97.03, wave iv - 111.43, followed by the final wave v as well as the end of wave (C) at 94.12, this also mark the bottom of larger degree wave B. Under this count, major rise in wave C has commenced as an impulsive wave with minor wave III ended at 145.69, wave V is still in progress for further gain to 150.00. Having said that, this so-called wave V could well be the first leg of larger degree 5-waver wave C and this wave C should bring at least a retest of wave A top at 169.97 (July 2008).
