Sample Category Title
Euro Yawns As Fed Raises Rates, Markets Eye Eurozone Final CPI
The euro has posted slight losses in the Thursday session, as EUR/USD is trading at 1.1170. In economic news, the eurozone surplus dropped sharply, coming in at EUR 19.6 billion. This was well short of the forecast of EUR 22.4 billion. In the US, today's major release is unemployment claims, which is expected to dip to 241 thousand. On the manufacturing front, the markets are braced for a soft reading from Philly Fed Manufacturing Index, with an estimate of 25.5 points. On Friday, the eurozone releases Final CPI and the US will publish Building Permits and Housing Starts.
US consumer numbers were soft on Thursday, as CPI and retail sales reports missed estimates. CPI declined 0.1%, short of the estimate of 0.2%. This was the second decline in three months, as inflation is currently at 15%, well below the Federal Reserve's target of 2.0%. Retail Sales, the primary gauge of consumer spending was dismal, coming in at -0.3%, compared to a forecast of +0.1%. This marked the indicator's weakest reading since August 2016. Weak retail sales is clearly an area of concern – the soft reading could drag down GDP for the second quarter, as as consumer spending accounts for more than two-thirds of economic growth. Although surveys continue to show that US consumers remain optimistic about the economy, this hasn't translated into stronger consumer spending. The euro initially posted gains following the release of this data, but the dollar was able to recover.
As expected, the Federal Reserve raised rates on Thursday by 25 basis points, to a target range of 1.00 percent to 1.25 percent. The rate statement portrayed an optimistic picture, noting that the economy was growing, and the labor market remained strong. As for inflation, which remains stubbornly low, the statement acknowledged that inflation remained below the Fed's target of 2.0%, but expected that goal to be reached in the “medium term”. The Fed projected one more rate hike in 2017, and the markets are circling the December meeting as the most likely date. The odds for a September increase are at 18%, compared to 23% a week ago, according to the CME Group. As for a December increase, the odds are currently at 38%. One surprising development was that Fed Chair Janet Yellen outlined a plan to reduce its $4.2 trillion balance sheet (comprised of Treasury bonds and mortgage-backed securities). Yellen was short on specifics, saying that the goal was to begin the normalization “relatively soon”. The balance sheet ballooned after the financial crisis in 2008, as the Fed implemented a massive quantitative easing program as part of its accommodative monetary policy, together with interest rates of zero. The gradual reduction in the purchase of these assets signifies an important vote of confidence in the strength of the US economy.
USD/CAD Elliott Wave Analysis
USD/CAD – 1.3280
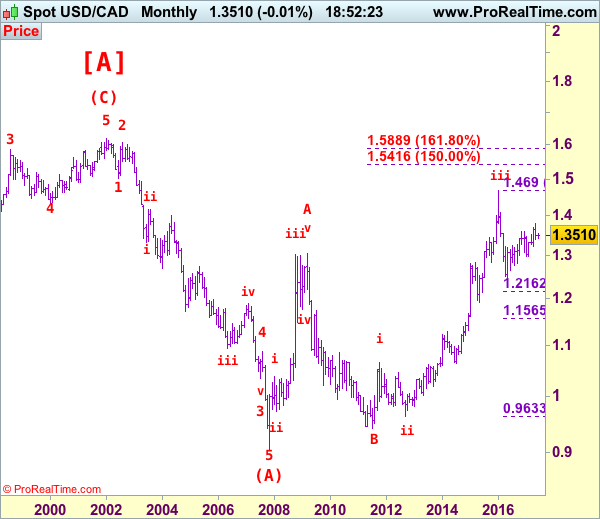
USD/CAD – Wave v ended at 0.9407 and a-b-c correction may extend gain to 1.4700
The greenback finally dropped in line with our bearish expectation, our short position entered at 1.3530 finally met our downside target at 1.3330 with 200 points profit, this anticipated selloff adds credence to our view that top has been formed at 1.3794 and the breach of previous support has reinforced our view that the rebound from 1.2969 ha ended at 1.3794, then further weakness to 1.3150 and then 1.3100 would be seen, however, oversold condition should limit downside and reckon previous support at 1.3056 would hold, price should stay above psychological support at 1.3000.
We are keeping our view that the wave b from 1.0657 (a leg top) has possibly ended at 0.9633 with (a): 0.9800, wave (b): 1.0447 and wave c at 0.9633, the subsequent rise from there is now treated as wave c exceeded indicated upside target at 1.3770-80 and 1.4000 and wave (3) has possibly ended at 1.4690 and wave (4) correction has commenced for retracement back to 1.2832 support, then 1.2410-20.
On the daily chart, our latest preferred count remains that the A of (B) rally from 0.9059 low (7 Nov 2007) unfolded into an impulsive wave with i: 0.9059-1.0380, ii ended at 0.9819, iii at 1.3019 followed by triangle wave iv at 1.2026 , then wave v formed a top at 1.3066 and also ended the wave A. The wave B is unfolding as an double three a-b-c-x-a-b-c and is sub-divided as a: 1.2192, b: 1.2716 and wave c at 1.0784, followed by wave x at 1.1725, another set of a-b-c unfolded with 2nd a at 0.9931, 2nd b at 1.0674. the 2nd c has possibly ended at 0.9407, therefore, consolidation with upside bias is seen for major correction, indicated target at 1.3900 had been met and gain to 1.4700 would follow.
On the upside, whilst initial recovery to 1.3310-15 cannot be ruled out, reckon upside would be limited to 1.3350 and previous support at 1.3387 (now resistance) should hold, bring another decline. A daily close above 1.3387 would suggest low is possibly formed, bring a stronger rebound to 1.3425-30, break there would add credence to this view, then further gain to 1.3490-00 would follow but resistance at 1.3547 should remain intact.
Recommendation: Short entered at 1.3530 met target at 1.3330 with 200 points profit an d would stand aside for this week.

Longer term - The selloff from 1.6194 (21 Jan 2002) to 0.9059 (07 Nov 2007) is viewed as (A) wave which is a 5-waver as labeled on the monthly chart as below, the subsequently rally is labeled as (B) with impulsive A leg of (B) ended at 1.3066, wave B of (B) is unfolding which has either ended at 0.9407 or would extend one more fall but downside should be limited to 0.9200 and 0.9000 should hold.
USD Bounces Back Amid Hawkish Fed, SNB Holds Steady
Fed remains on track despite faltering inflationary pressures
As broadly expected the Federal Reserve lifted borrowing costs by 25bps following a two-day meeting. The decision was already priced in by market participants. However, the Committee created a stir with a surprisingly hawkish statement and press conference from Janet Yellen despite the recent publication of lacklustre economic data.
Indeed, the last CPI and retail sales reports came on the soft side and triggered a USD sell-off, just a couple of hours before the announcement of FOMC's decision. The consumer price index extended only 1.9%y/y in May versus 2.0% expected and down from 2.2% in the previous month amid sustainable downside pressure on crude oil prices. In addition, the core measure, which excludes the most volatiles components such as food and energy prices, slid to 1.7%y/y, down from a previous reading and median forecast of 1.9%. Finally, retail sales printed in negative territory and contracted 0.3%m/m in May, well below market's expectations of a flat reading, signalling that US consumers preferred to remain cautious against the backdrop of political jitters in the US and an uncertain economic outlook.
Committee's members seemed committed to hold the line and keep steady the tightening pace as announced at the preceding meetings. Moreover the Fed remains highly confident the recent set-back in inflation developments is only temporary and expects to increase by another notch the federal funds target before the end of the year.
In our opinion, the fact that the Fed is not really concerned about the disappointing inflation readings suggests that the institution may have started to reconsider the ground for reaching at all cost the 2% inflation target. Indeed, overall the US economy is not in such a bad state as it is not in recession anymore and the economic growth is the envy of many countries.
Finally, the Committee discussed further about balance sheet unwinding as it drafted carefully a plan for policy normalisation; and it is expected to be implement before the end of the year. However, the Fed remained extremely cautious by stating that “the Committee would be prepared to resume reinvestment of principal payments received on securities held by the Federal Reserve if a material deterioration in the economic outlook were to warrant a sizable reduction in the Committee's target for the federal funds rate”.
The USD was broadly higher this morning and erased partially the losses triggered by the release of the CPI and retail sales report. EUR/USD is back below 1.12 and currently trading with a negative bias.
Switzerland: SNB holds rates unchanged
Loose monetary policy is to continue for some more time. The EURCHF pair is back above 1.0900. This morning Swiss policymakers have decide to hold rates unchanged at -0.75% repeating that the Swiss franc is largely overvalued and that this is a threat for the Swiss economy. The Swiss franc is trading at a level around 30 times higher than levels before the financial crisis. Such high levels are definitely boosting deflationary pressures.
The plan is definitely staying the same for the central bank. Defending the Swiss Franc at all costs. The FX reserves keep on growing towards very massive levels. It now represents CHF 700 billion. As long as the Swiss central bank considers the currency is overvalued, the FX reserves are going to keep climbing.
In Swiss political news, Didier Burkhalter, head of the Federal Department of Home Affairs, will leave the Federal Council on October 31st. He was mostly criticised for his pro-Europe views. Monitoring relations with the EU is very important, as one key driver for the CHF depends on its giant neighbour.
For the time being, we can see that political uncertainties have reduced since the French elections. Nonetheless, other political uncertainties seem to arise with Hungary, Czech Republic or Poland seeming to refuse to welcome any more migrants and they will likely be sanctioned by the European Commission.
Trade Idea: EUR/JPY – Stand aside
EUR/JPY - 122.50
Recent wave: wave v of (C) ended at 94.12 and major correction in wave A has ended at 149.79
Trend: Near term up
New strategy :
Stand aside
Position: -
Target: -
Stop:-
Although the single currency has fallen again and near term downside risk remains for recent decline from 125.82 top to extend weakness to 122.00, near term oversold condition should prevent sharp fall below 121.50-60 and reckon 121.25-30 would hold from here, risk from there has increased for a rebound to take place later.
In view of this, would not chase this move here and would be prudent to stand aside in the meantime. Above 123.15-20 would suggest low is possibly formed but break of resistance at 123.65-75 is needed to add credence to this view, bring a stronger rebound towards 124.10-20 which is likely to cap upside.
Our latest preferred count is that wave (ii) is ABC-X-ABC which ended at 123.33 and wave (iii) is unfolding with wave iii ended at 100.77, followed by wave iv at 111.57 and wave v as well as the wave (iii) has ended at 97.04, followed by wave (iv) at 111.43 and wave (v) has ended at 94.12 which is also the end of the larger degree v, this also implied the major wave (C) has also ended there, hence major correction has commenced from there with (A) leg unfolding in its lower degree wave c which has possibly ended at 145.69. Under this count, A-B-C wave (B) has commenced with A leg ended at 136.23, wave B at 143.79 and wave C has possibly ended at 149.79.
Our larger degree count is that the decline from 139.26 is wave (C) and is sub-divided into a diagonal triangle i-ii-iii-iv-v with wave i - 105.44, wave ii- 123.33, wave iii - 97.03, wave iv - 111.43, followed by the final wave v as well as the end of wave (C) at 94.12, this also mark the bottom of larger degree wave B. Under this count, major rise in wave C has commenced as an impulsive wave with minor wave III ended at 145.69, wave V is still in progress for further gain to 150.00. Having said that, this so-called wave V could well be the first leg of larger degree 5-waver wave C and this wave C should bring at least a retest of wave A top at 169.97 (July 2008).

Gold Analysis: Reaches Above 1,280 Before Falling
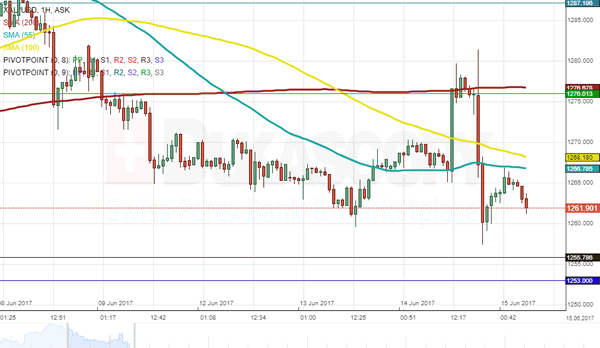
The yellow metal is continuing its decline, as the metal traded near the 1,260 mark on Thursday morning. However, there are bad news for the bears, as during the data releases of Wednesday the commodity price managed to surge and reach above the 1,280 mark, which most likely triggered a lot of stop losses. The bullion retreated once more to trade near the 1,260 after the Federal Reserve made their announcements at 18:00 GMT during yesterday’s trading session. It can still be expected that the gold price will decline down to the 1,255.79 mark where the first weekly support was located at on Thursday. The support is also strengthened by the close by located monthly pivot point at the 1,253 mark.
Trade Idea: AUD/USD – Buy at 0.7525
AUD/USD – 0.7597
Recent wave: Wave 5 ended at 1.1081 and major correction has commenced for fall to 0.7000 and then towards 0.6500-10
Trend: Near term down
Original strategy :
Buy at 0.7500, Target: 0.7650, Stop: 0.7440
Position: -
Target: -
Stop: -
New strategy :
Buy at 0.7525, Target: 0.7670, Stop: 0.7465
Position: -
Target: -
Stop:-
As the Australian dollar has eased after meeting resistance at 0.7636, suggesting consolidation below this level would be seen and pullback t0 0.7550-60 cannot be ruled out, however, reckon support at 0.7524 would limit downside and bring another rise later, above said resistance at 0.7636 would extend recent upmove from 0.7329 towards resistance at 0.7680 but loss of momentum should limit upside and price should falter below chart point at 0.7750.
In view of this, we are looking to buy aussie on dips as 0.7520-25 should limit downside and bring another rise. Only below support at 0.7457 would abort and suggest top is possibly formed, bring weakness to 0.7415-20 but price should stay well above key support at 0.7372, bring another rebound later.
On the 4-hour chart, the move from 0.8066 is the wave 5 with i: 0.8860, ii: 0.8315, wave iii is an extended move ended at 1.0183, iv: 0.9706 and wave v has ended at 1.1081 (also the top of entire wave 5). The subsequent selloff is the major correction which is unfolding as ABC-X-ABC and 2nd A leg has ended at 0.8848, followed by a-b-c wave B which ended at 0.9758, hence, 2nd C wave is now in progress and indicated downside target at 0.7000 and 0.6950 had been met, so further fall to 0.6710-20 cannot be ruled out.

USD/JPY Analysis: Subject To More Weakness
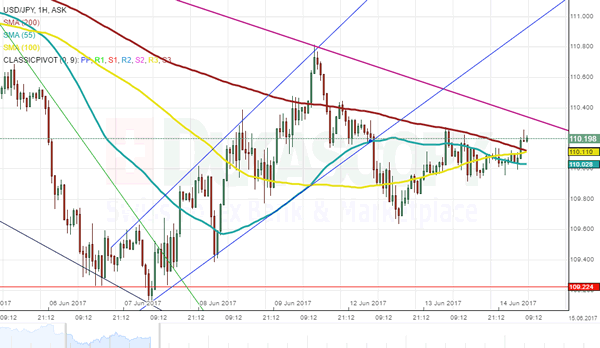
As was anticipated, the retest of the six-week down-trend caused the Buck to decline against the Yen yesterday, as poor US fundamentals and political ‘issues’ overshadowed the Fed’s hawkish tone. As a result, the key support, namely the monthly S1 at 109.22, was briefly pierced, but the exchange rate quickly recovered back towards 109.50. The USD/JPY pair still has a number of strong resistances in close proximity, which are all likely to contribute to another leg down. Moreover, technical indicators keep suggesting the bearish momentum is to prevail today, bolstering the possibility of the negative outcome. Furthermore, with the breach of the key support, the given pair is now exposed to falling under the 109.00 mark, with the next solid support being only the 108.00 psychological level.
GBP/USD Analysis: Orbits Monthly S1
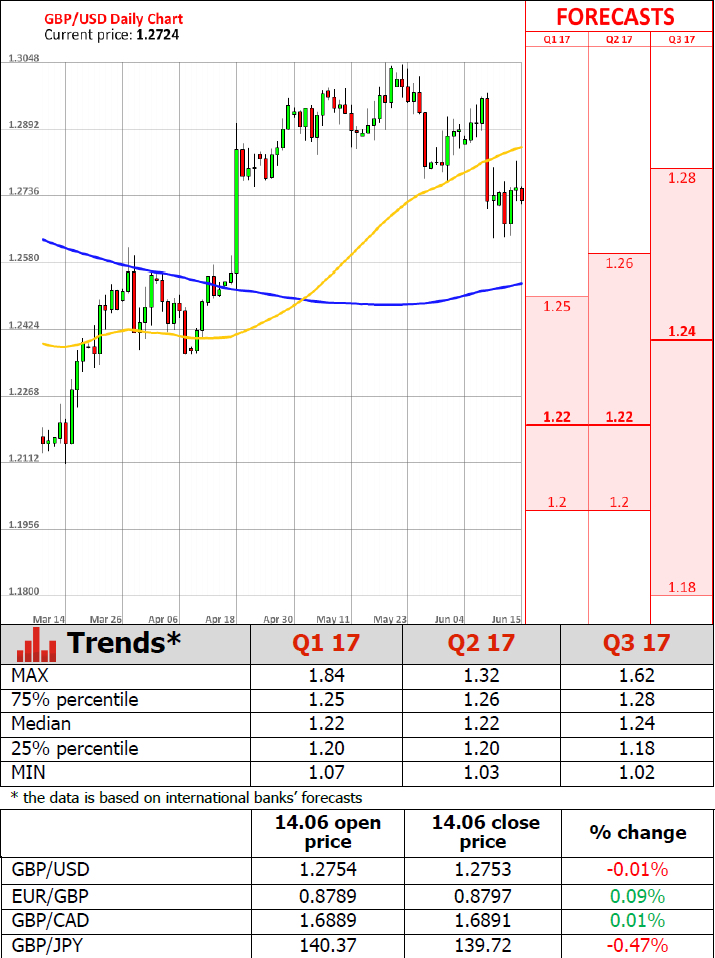
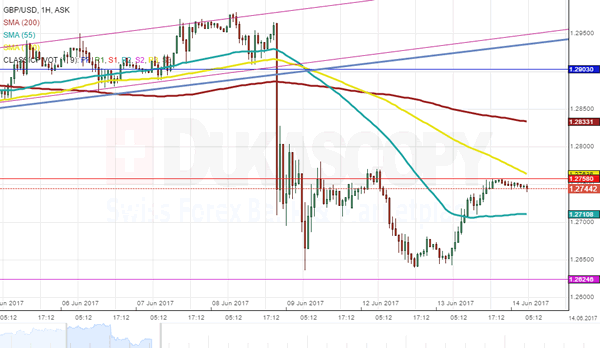
Even though the GBP/USD currency pair experienced some volatility on Wednesday, trade still closed with the Cable remaining relatively unchanged. The pair was also unable to stabilise above the monthly S1, which suggests that more downside movement is possible. However, technical studies are unable to fully confirm this scenario. The 1.2624 level, namely the monthly S2, is still likely to be the bottom floor, where demand is expected to be sufficient to either limit the losses or even trigger a rebound. In case the Sterling manages to outperform the Buck, thus, climb above the monthly S1, a potential resistance area would be just above the 1.28 handle, represented by the 200hour SMA and the upper Bollinger band.
EUR/USD Analysis: Highly Volatile On Fundamentals
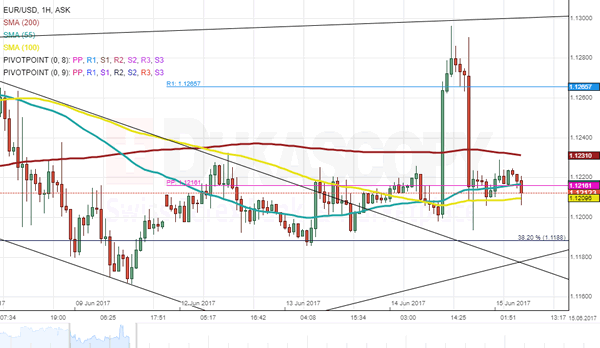
The common European currency remains near previous session opening levels against the US Dollar. However, there is a huge arch observable on the hourly chart. The jump of the currency exchange rate was caused by the US CPI and Retails Sales data set release, which turned out to be a lot less than the average market forecast. That caused the EUR/USD pair to jump and almost reach the 1.13 mark. However, at 18:00 GMT the Federal Reserve made their announcements, which strengthened the US Dollar all across the markets. As a result the pair trades in limbo around the cluster of levels of significance at just above the 1.12 mark. The rate can either retreat to the 38.20% Fibonacci retracement level at the 1.1188 level or begin a surge up to the 200-hour SMA at 1.1231 by the end of the day.
Weak UK Pay Growth Raises Concerns Over Economy Growth
'The wage figures are astonishingly weak.' - Samuel Tombs, Pantheon Macroeconomics
The number of Britons applying for unemployment benefits dropped more than expected, whereas wage growth slowed unexpectedly in the three-month period to April. The Office for National Statistics reported on Wednesday that the unemployment rate came in at 4.6% for the period between February and April, unchanged from the prior month and in line with forecasts. Meanwhile, the number of claimants fell to 7.3K, following the preceding month's upwardly revised figure of 22.0K and surpassing expectations for a decrease to 12.5K. Meanwhile, the number of people in work rose 109K in the three-month period to April. Thus, the employment rate climbed to a record high of 74.8%. Apart from that, average hourly earnings grew just 2.1% between February and April, the weakest since February 2016 and following the March quarter's downwardly revised increase of 2.3%, whereas analysts anticipated a rise of 2.4%. A combination of weak wage growth and strong inflation raised concerns over the ability of consumer spending to contribute to economic growth.