
Sample Category Title
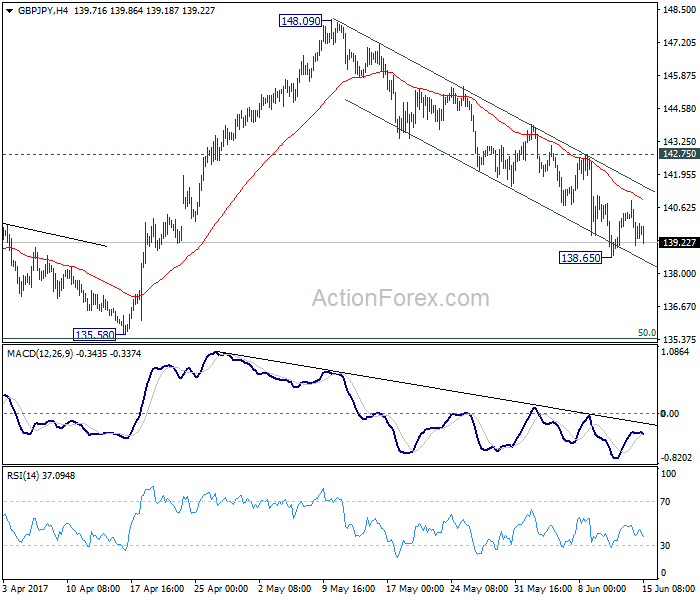
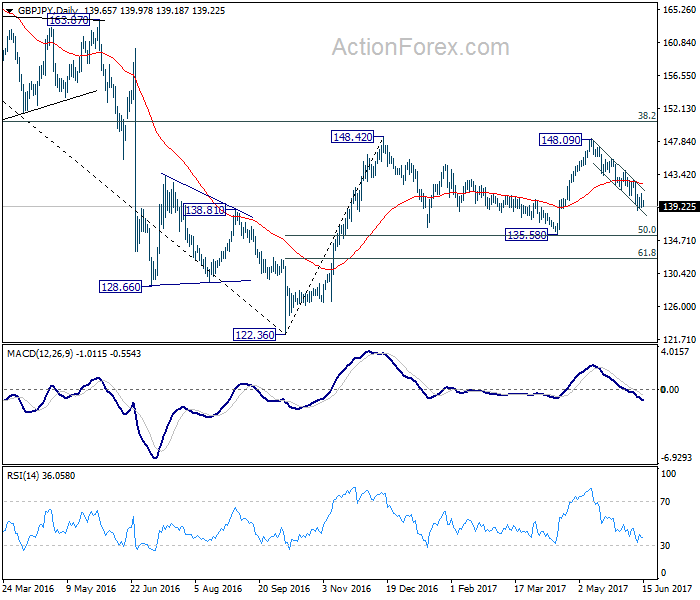
GBP/JPY Daily Outlook
Daily Pivots: (S1) 138.91; (P) 139.91; (R1) 140.72; More....
Intraday bias in GBP/JPY remains neutral for consolidation above 138.65 temporary low. Near term outlook stays bearish with 142.75 resistance intact. Fall from 148.09 could still extend lower. In that case, we'd look for bottoming signal around 135.58, which is close to 135.39 fibonacci level, to bring rebound. Break of 142.75, nonetheless, will argue that fall from 148.09 is completed and turn bias back to the upside for this resistance.
In the bigger picture, while the fall from 148.09 is deeper than expected, we're not bearish in the cross yet. Price action from 148.42 is possibly developing into a sideway pattern with fall from 148.09 as the third leg. Deeper decline could be seen but we're looking for strong support from 135.58 and 50% retracement of 122.36 to 148.42 at 135.39 to contain downside. Rise from 122.36 is still mildly in favor to resume at a later stage. However, sustained break of 135.58/39 will confirm reversal and target a retest on 122.36 low.
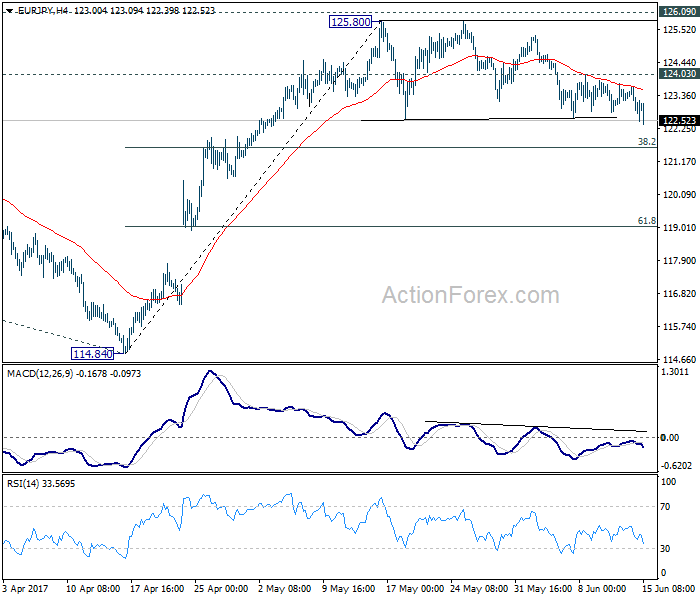
EUR/JPY Daily Outlook
Daily Pivots: (S1) 122.58; (P) 123.10; (R1) 123.45; More...
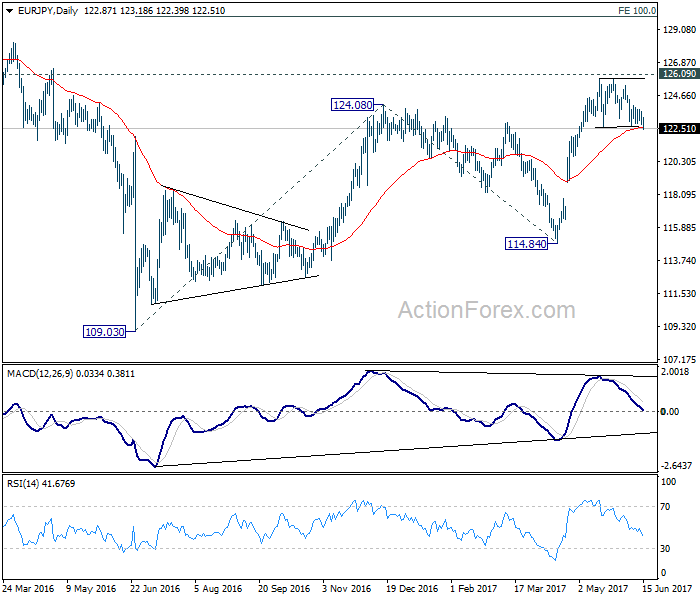
EUR/JPY dips to as low as 122.39 so far as the correction from 125.80 extends. Deeper fall could still be seen. But we'd expect downside to be contained by 38.2% retracement of 114.84 to 125.80 at 121.61 to bring rise resumption. Above 124.03 minor resistance will turn bias back to the upside for 125.80/126.09 resistance zone. We're staying mildly bullish in the cross. And, break of 126.09 key resistance will extend the whole rebound from 109.03 to 100% projection of 109.03 to 124.08 from 114.84 at 129.89. Nonetheless, firm break of 121.61 will dampen our bullish view and bring deeper fall to 61.8% retracement at 119.02.
In the bigger picture, focus is staying on 126.09 support turned resistance. Decisive break there will confirm completion of the down trend from 149.76. And in such case, rise from 109.20 is at the same degree and should target 141.04 resistance and above. Meanwhile, rejection from 126.09 and break of 114.84 will extend the fall from 149.76 through 109.20 low.
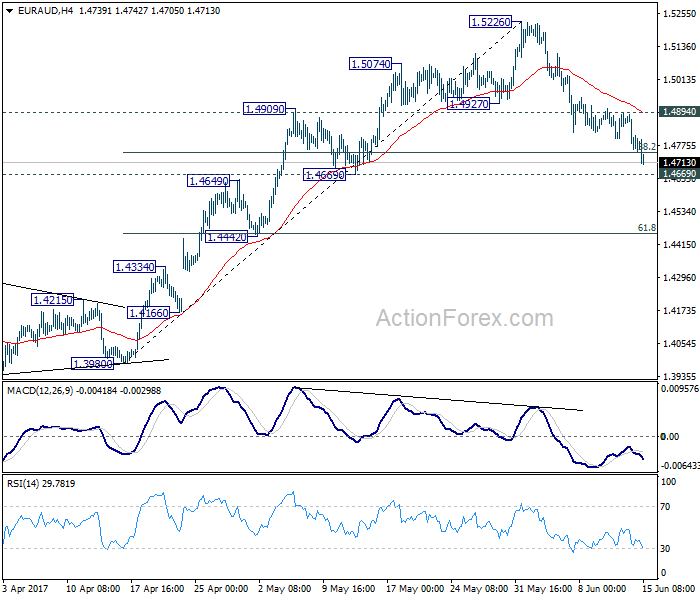
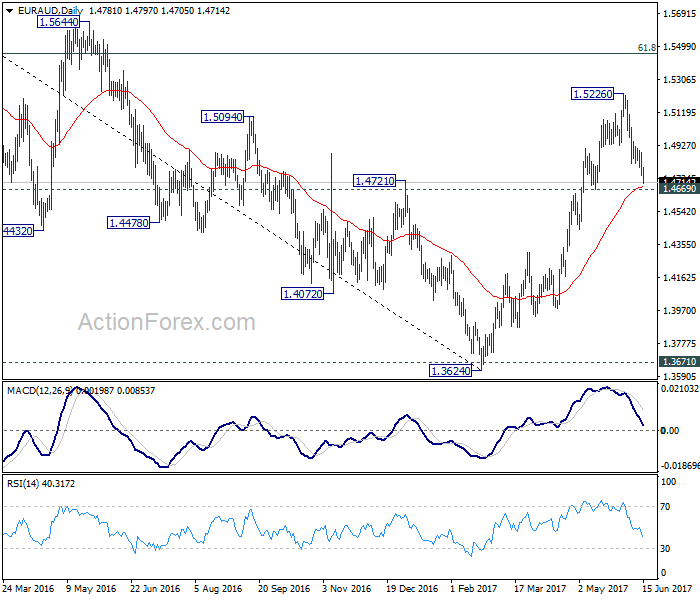
EUR/AUD Daily Outlook
Daily Pivots: (S1) 1.4727; (P) 1.4807; (R1) 1.4860; More...
EUR/AUD's pull back from 1.5226 extended lower and broke 38.2% retracement of 1.3980 to 1.5226 at 1.4750. But at this point, we'd still expect strong support from 1.4669, close to 55 day EMA at 1.4685, to contain downside and bring rebound. Above 1.4894 minor resistance will turn bias back to the upside for retesting 1.5226 high. However, firm break of 1.4669 will argue that rise from 1.3642 is completed and bring deeper pull back.
In the bigger picture, price actions from 1.6587 medium term top are viewed as a corrective pattern. Such correction should be completed at 1.3624 after defending 1.3671 key support. Rise from 1.3642 is now expected to target 61.8% retracement of 1.6587 to 1.3624 at 1.5455. Sustained break there will pave the way to retest 1.6587. In any case, outlook will now stay cautiously bullish as long as 1.4669 support holds. Break of 1.4669 will dampen the bullish view and would at least bring deeper fall back to 55 week EMA (now at 1.4539).
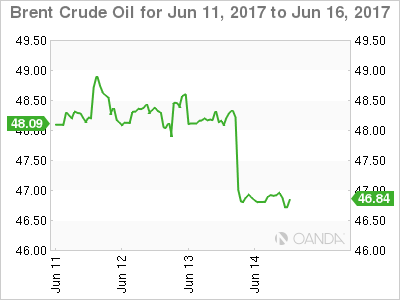
Oil Tries Putting Out Fires, With Gasoline
Putting out fires with gasoline will never be a good life decision, but that is what happened overnight with crude oil exploding, to the downside.
For OPEC, an oversupply headache became a migraine overnight as oil slumped by 4 % after the release of the U.S. DOE Crude Inventory numbers. In fact, it wasn't the crude inventory number itself that started the rot, although the drawdown of -1.66 million barrels was less than expected, rather it was the gasoline inventories which came in at +2.1 million bpd against an expected reduction of -1.15 million bpd.
Given we are in U.S. driving season, this was unexpected and suggests that the persistent surplus is being shunted further down the oil value chain. Instead of being stored in huge tanks in Cushing Oklahoma as crude, it is being taken out, refined into gasoline and err, being stored in huge tanks. The gasoline inventories don't normally have such an aggressive effect on crude prices. What is perhaps enlightening, therefore, is the light it shines on market sentiment. It would appear that the support was nervously wobbling before the numbers with the release being the straw that broke the camels back.
The gasoline inventories don't normally have such an aggressive effect on crude prices. What is perhaps enlightening, therefore, is the light it shines on market sentiment. It would appear that the support was nervously wobbling before the numbers with the release being the straw that broke the camels back.
Brent and WTI didn't hang around though, with both contracts heading out of the door and turning South at high speed. Brent and WTI both finished the New York session at their lows, a bearish technical development in itself, and are now eyeing the panic liquidation lows of early May.
Brent spot opened at 46.85 this morning with well-formed resistance now at 48.50. The May low at 46.05 is the first support followed by 45.50.
WTI spot opened at 44.60 with substantial resistance above 46.25. The May low at 43.55 is initial support with a daily close below here possibly targeting the November lows around 42.00.
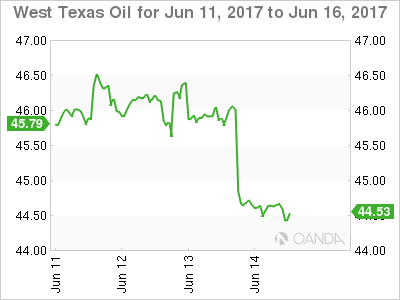
A break of the latter level on WTI would no doubt send shockwaves through both OPEC/Non-OPEC and U.S. Shale. It would shine the spotlight on Saudi Arabia, much to their reluctance, as the world's only major swing producer capable of making rapid, meaningful cuts to rebalance prices urgently. Its effect on the OPEC/non-OPEC alliance could turn either way. On the one hand, they may be faced with the unpalatable scenario of deepening the production cut agreement and then adhering to it. On the contrary, it may spawn a noncompliance every man for himself situation and undermine the agreement terminally.
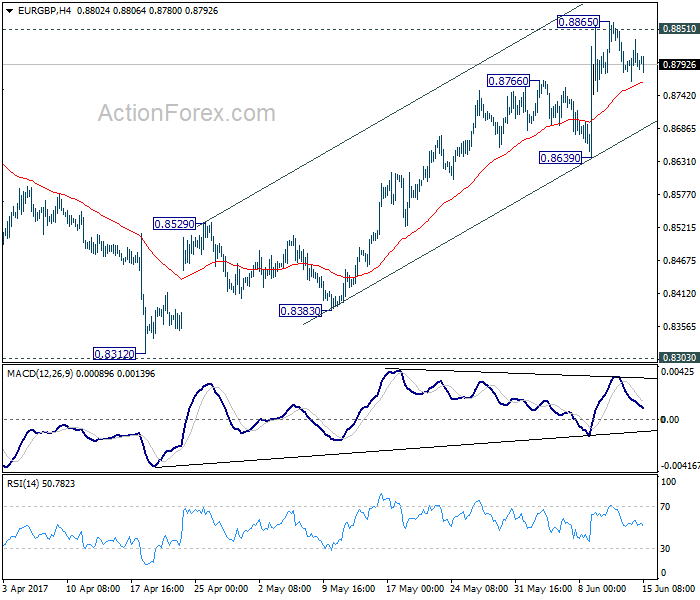
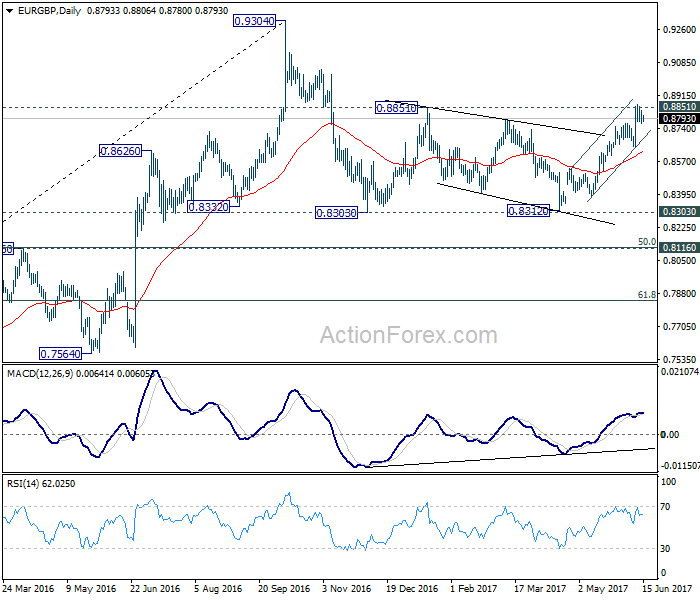
EUR/GBP Daily Outlook
Daily Pivots: (S1) 0.8763; (P) 0.8799; (R1) 0.8832; More...
Intraday bias in EUR/GBP remains neutral for consolidation below 0.8865 temporary top. Downside of retreat should be contained above 0.8639 support and bring another rally. Firm break of 0.8851 will pave the way to retest 0.8304 high. . At this point, there is no clear sign of larger up trend resumption yet. Hence, we'll be cautious on topping around 0.9304. However, break of 0.8639 support will now indicate near term topping and bring deeper pull back to 55 day EMA (now at 0.8615) and below.
In the bigger picture, price actions from 0.9304 are viewed as a medium term corrective pattern. The leg from 0.9304 should have completed after testing 0.8332 structural support. But it's too early to say that larger rise from 0.6935 is resuming. Rejection from 0.9304 will extend the consolidation with another falling leg. Meanwhile, firm break of 0.9304 will target 0.9799 (2008 high). In case of another decline, we'd expect strong support from 0.8116 cluster support (50% retracement of 0.6935 to 0.9304 at 0.8120) to contain downside and bring rebound.
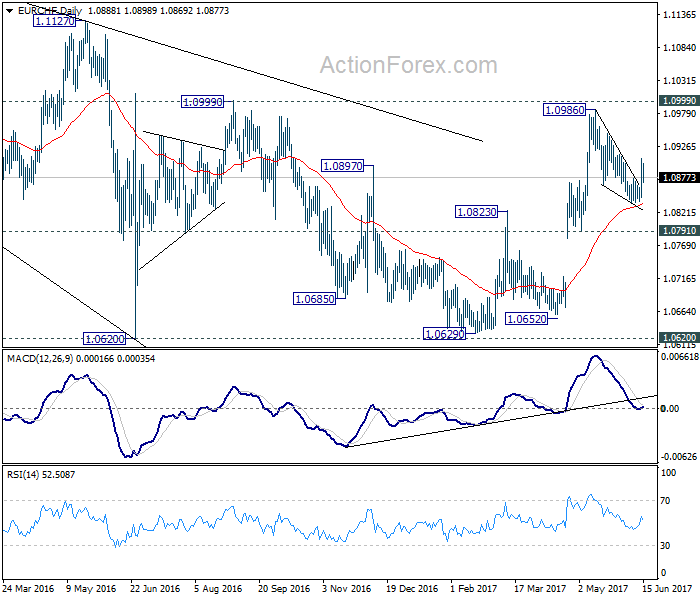
EUR/CHF Candlesticks and Ichimoku Analysis
Weekly
• Last Candlesticks pattern: Doji
• Time of formation: 20 Feb 2017
• Trend bias: Up
Daily
• Last Candlesticks pattern: Doji
• Time of formation: 1 Sep 2016
• Trend bias: Near term down
EUR/CHF – 1.0877
As the single currency has rebounded after holding above support at 1.0838, retaining our bullishness and consolidation above this level would be seen with upside bias for gain to 1.0920 but break of resistance at 1.0949 is needed to signal the pullback from 1.0988 has ended, bring test of 1.0960, break there would suggest upmove has resumed for retest of 1.0988, then towards previous resistance at 1.1001. Looking ahead, only a break there would retain bullishness and encourage for headway to 1.1050-60, then 1.1100, having said that, price should falter below another previous resistance at 1.1201.
On the downside, expect pullback to be limited to 1.0855 and said support at 1.0838 should hold, bring another rise later to aforesaid upside targets. Below 1.0838 support would risk test of previous support at 1.0792 but only a daily close below there would signal top is formed at 1.0988 instead, bring subsequent fall to 1.0750 and then towards 1.0700-10 but support at 1.0671 should remain intact, the single currency shall stage another rebound from there.
Recommendation: Hold long entered at at 1.0865 for 1.1065 with stop below 1.0835.

On the weekly chart, as indicated support at 1.0838 has continued to hold, retaining our bullishness and consolidation with upside bias remains for gain to 1.0949 resistance but break there is needed to signal the pullback from 1.0988 has ended, bring retest of this level, break there would extend recent upmove from 1.0631 to previous resistance at 1.1001, a sustained breach above this level would signal the fall from 1.1201 has ended, bring further gain to 1.1100 and possibly test of resistance at 1.1129 but price should falter below said recent high at 1.1201, bring retreat later.
On the downside, as long as said support at 1.0838 holds, prospect of such a rebound remains. Below this level would risk test of the Kijun-Sen (now at 1.0810) but only break of previous support at 1.0780 would abort and signal top has been formed at 1.0988 instead, bring further weakness to 1.0720, however, still reckon support at 1.0656 would remain intact, bring another rally later.

Technical Outlook: Cable Is Standing At The Back Foot Ahead Of BOE
Wednesday's probe above daily cloud / 55SMA (1.2793) was short-lived and subsequent pullback left Doji candle with long upper shadow, signaling strong hesitation at important 1.2800 resistance zone (reinforced by daily Tenkan-sen at 1.2806).
Fresh easing on Thursday threatens of further downside but bears were so far contained by hourly cloud top / Wednesday's low at 1.2722.
Markets are awaiting BoE's policy decision today for fresh signals. The central bank is expected to keep rates unchanged, but traders will be closely watching BoE's stance in regards to rising inflation, mixed numbers from labor sector and political turmoil following last week election.
Hawkish BoE may offer temporary support to the pound, however, overall bearish short-term structure continues to weigh.
Key supports lay at 1.2640 zone (near-term base) and 1.2623 (100SMA), loss of which would further weaken the structure and expose next significant support at 1.2565 (200SMA).
At the upside, renewed attempts above 1.2800 resistance zone will face resistance at 1.2841 (daily Kijun-sen) and are expected to stay capped by falling 20SMA (1.2870).
Res: 1.2760, 1.2793, 1.2817, 1.2841
Sup: 1.2722, 1.2704, 1.2673, 1.2635
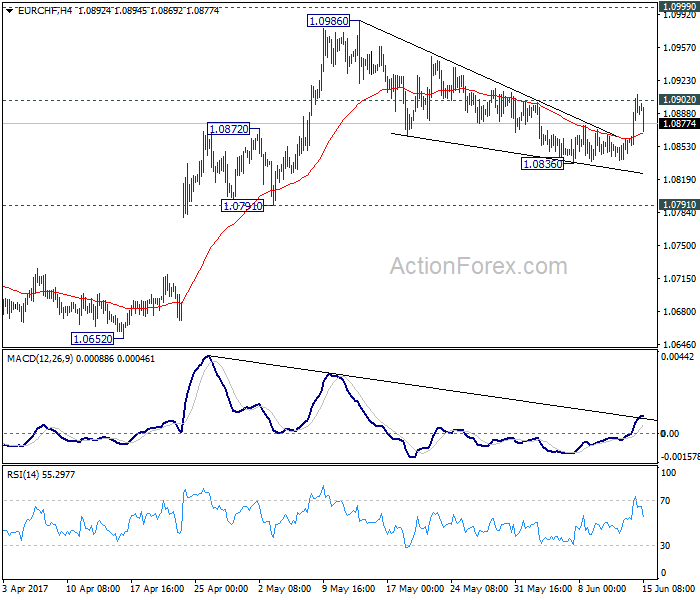
EUR/CHF Daily Outlook
Daily Pivots: (S1) 1.0855; (P) 1.0881; (R1) 1.0918; More...
Breach of 1.0902 minor resistance argues that the correction from 1.0986 could have completed at 1.0836 already. Intraday bias is turned back to the upside for retesting 1.0986/0999 resistance zone. Below 1.0836 will extend the correction. Still, we'd expect strong support from 1.0791/0872 support zone to bring rebound.
In the bigger picture, the price actions from 1.1198 are seen as a corrective move. Such correction could have completed after defending 38.2% retracement of 0.9771 to 1.1198 at 1.0653. Decisive break of 1.0999 resistance will target a test on 1.1198 high. For now, this will be the preferred case as long as 1.0791 support holds.
Forex Technical Analysis: EUR/USD, USD/JPY, GBP/USD
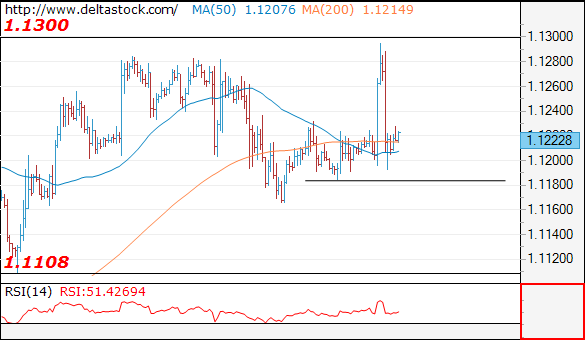
EUR/USD
Current level - 1.1222
Yesterday's failure at 1.1300 resistance signals a bearish bias, for a break through 1.1185, towards 1.1108 low.
| Resistance | Support | ||
| intraday | intraweek | intraday | intraweek |
| 1.1260 | 1.1360 | 1.1185 | 1.1022 |
| 1.1300 | 1.1610 | 1.1109 | 1.0838 |
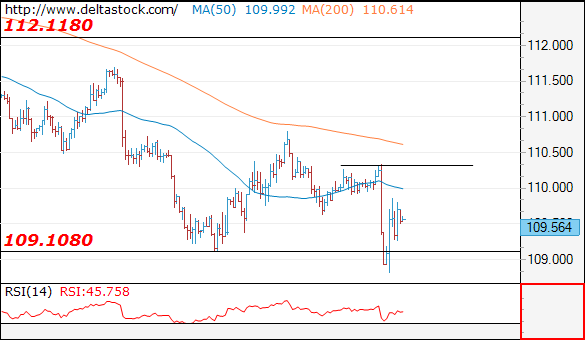
USD/JPY
Current level - 109.56
The recent slide to 108.80 should be considered a finale of the whole slide since 114.37 and my outlook is bullish, for a break through 110.35, towards 112.10.
| Resistance | Support | ||
| intraday | intraweek | intraday | intraweek |
| 109.80 | 112.10 | 109.20 | 109.08 |
| 110.40 | 114.30 | 108.80 | 108.12 |
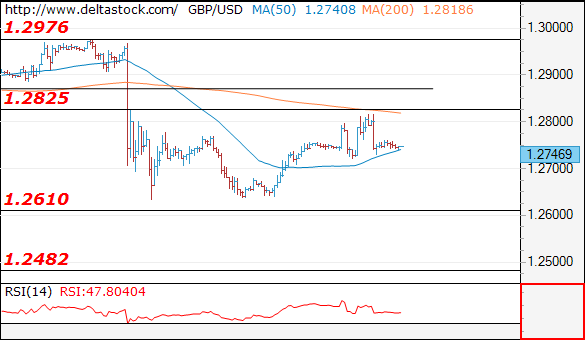
GBP/USD
Current level - 1.2746
The bias here is negative after the recent failure below 1.2830, for a break through 1.2720, towards 1.2610.
| Resistance | Support | ||
| intraday | intraweek | intraday | intraweek |
| 1.2830 | 1.2970 | 1.2720 | 1.2610 |
| 1.2880 | 1.3050 | 1.2610 | 1.2480 |
Aussie Gains on Upbeat Jobs Report; Kiwi Drops after GDP; Greenback Steady post-Fed
The US dollar mostly held onto gains made after the Federal Reserve was not as dovish as some had expected and the aussie was one of the best performing major currencies after strong jobs data. The kiwi slid after soft GDP data.
The Fed announced on Wednesday it raised interest rates for the second time this year, taking the target range for the Fed funds rate to between 1.00-1.25%, as was widely expected. The US central bank cited continued US economic growth and job market strength, and announced it would begin cutting its holdings of bonds and other securities this year. Fed Chair Janet Yellen indicated the Fed was still looking through soft inflation and blamed recent low inflation numbers on one-off effects.
The greenback rose post-FOMC to 109.85 yen but could not make up for Wednesday's losses made after weak US CPI and retail sales data when it fell to 108.92 from 110.3 yen. The dollar's gains will likely be limited as US political uncertainty weighs on the currency after the Washington Post reported that US President Donald Trump was under investigation by Special Counsel Robert Mueller for possible obstruction of justice.
The aussie surged after strong Australian employment data and jumped up to $0.7630 from $0.7582. Australian jobs beat forecasts in May with the economy adding 42,000 positions versus 10,000 expected. The unemployment rate hit 5.5%, its lowest since 2013. It was expected to remain at 5.7%.
The kiwi fell following weak New Zealand growth data to reach a session low of $0.7207. First quarter GDP missed forecasts and rose 0.5% versus 0.7% forecast, following an increase of 0.4% in the December 2016 quarter.
Sterling was little changed against the dollar after falling yesterday on weak UK average earnings numbers. Focus shifts to the Bank of England policy meeting later today, although rates are expected to remain on hold. Cable traded around $1.2750 during the Asian session.
The euro reversed all of its gains made versus the dollar yesterday, when it came close to the key $1.1300 level, only to fall back down to below $1.1200.
Aside from the forex markets, looking at commodities, US WTI oil prices consolidated losses after dropping below $45 a barrel to a five-week low on Wednesday following a disappointing report on US crude and gasoline stockpiles. Gold slid to its lowest in three weeks at $1257.07 an ounce. The precious metal is usually sensitive to US interest rates, and thus weakened after Wednesday's Fed rate hike.