
Sample Category Title
Trade Idea : GBP/USD – Sell at 1.2790
GBP/USD - 1.2729
Most recent candlesticks pattern : N/A
Trend : Near term down
Tenkan-Sen level : 1.2742
Kijun-Sen level : 1.2771
Ichimoku cloud top : 1.2724
Ichimoku cloud bottom : 1.2704
Original strategy :
Sell at 1.2850, Target: 1.2750, Stop: 1.2885
Position : -
Target : -
Stop : -
New strategy :
Sell at 1.2790, Target: 1.2690, Stop: 1.2825
Position : -
Target : -
Stop : -
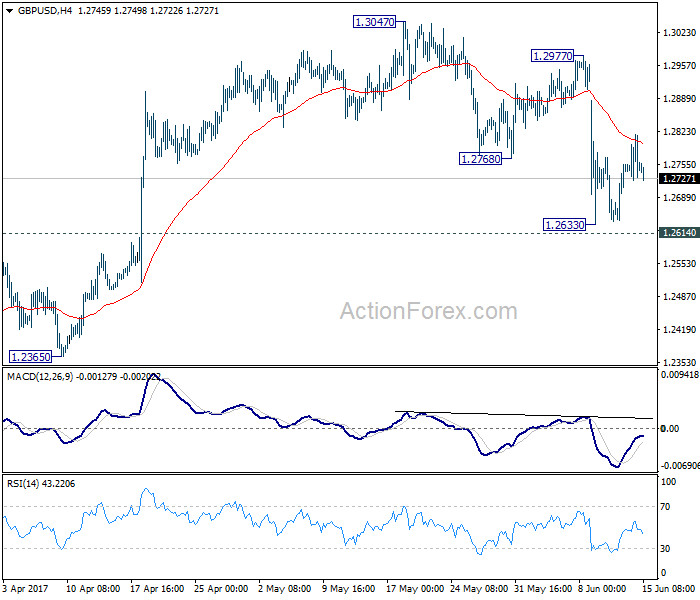
As the British pound ran into resistance at 1.2818 yesterday and has retreated on dollar’s broad-based strength after Fed rate hike, suggesting the rebound d from 1.2635 has ended there and consolidation with mild downside bias remains for weakness to 1.2700, however, break of 1.2680 is needed to retain bearishness and bring further fall to 1.2650, then towards said support at 1.2635.
In view of this, we are looking to sell cable on recovery as 1.2790-00 should limit upside. Above said resistance at 1.2818 would defer and risk a strong rebound to 1.2845-50 (61.8% Fibonacci retracement of 1.2978-1.2635) but upside should be limited to 1.2870-80.

GBP/USD Daily Outlook
Daily Pivots: (S1) 1.2710; (P) 1.2764; (R1) 1.2804; More...
GBP/USD failed to sustain above 4 hour 55 EMA and retreats. At this point, intraday bias remains neutral and the consolidation from 1.2633 temporary low might extend. Near term outlook remains bearish with 1.2977 resistance intact. We continue to favor the case that consolidation pattern from 1.1946 has completed at 1.3047 already. Decisive break of 1.2614 resistance turned support would confirm our bearish view and target a test on 1.1946 low next. However, break of 1.2977 will dampen our view and turn bias back to the upside for 1.3047 and above.
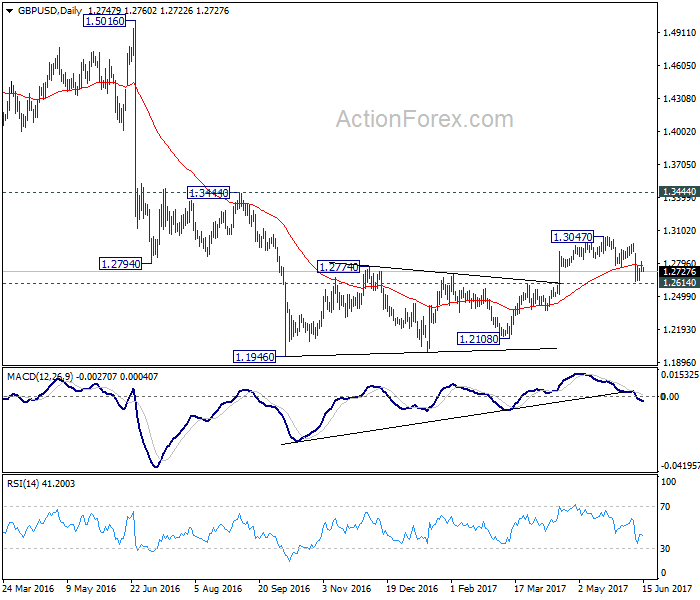
In the bigger picture, fall from 1.7190 is seen as part of the down trend from 2.1161. Price actions from 1.1946 medium term low are seen as a consolidation pattern, which could have completed after hitting 55 week EMA. Break of 1.1946 low will target 61.8% projection of 1.5016 to 1.1946 from 1.3047 at 1.1150 next. In case the consolidation from 1.1946 extends, outlook will stay remain bearish as long as 1.3444 resistance holds.
Trade Idea : EUR/USD – Sell at 1.1240
EUR/USD - 1.1192
Most recent candlesticks pattern : N/A
Trend : Up
Tenkan-Sen level : 1.1207
Kijun-Sen level : 1.1241
Ichimoku cloud top : 1.1209
Ichimoku cloud bottom : 1.1209
Original strategy :
Bought at 1.1235, stopped at 1.1200
Position : - Long at 1.1235
Target : -
Stop : - 1.1200
New strategy :
Sell at 1.1240, Target: 1.1140, Stop: 1.1275
Position : -
Target : -
Stop : -
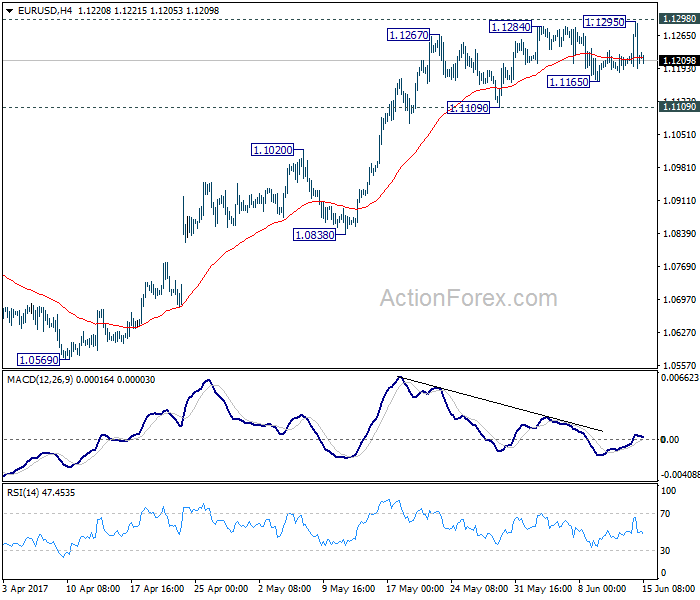
Although the single currency surged to as high as 1.1296, lack of follow through buying on break of previous resistance at 1.1285 and the subsequent reversal signal top has been formed there and consolidation with downside bias is seen for weakness to previous support at 1.1166 but break there is needed to add credence to this view, bring further fall to 1.1135-40, then towards another previous support at 1.1109.
In view of this, we are looking to sell euro on recovery as 1.1235-40 should limit upside. Above 1.1260-65 would defer and risk rebound to 1.1280 but price should falter below said resistance at 1.1296 and bring another decline later.

FOMC Review: Hawkish Yellen Ignores Inflation And Weaker Data
- We were obviously wrong about our non-consensus call that the Fed would skip hiking at this meeting. However, we are surprised that the Fed is not more worried about low inflation. We still fear the Fed is making a policy mistake, as economic data do not justify a hike, in our view.
- Unchanged dots but four FOMC members expect no further hikes this year – and we guess three of them are voting members. This puts a third hike this year into question.
- Fed may hike again in December, as it targets unemployment but risks are skewed toward a pause in the hiking cycle, so we expect a maximum of 1-2 hikes next year if anything. More details on quantitative tightening (QT) may come already in September so actual QT can start in Q4.
- Fed plans to shrink the balance sheet by USD300bn the first year and USD600bn per year afterwards, which may be too optimistic in our view. There is a risk that a perfect storm will hit USD liquidity in H2 17.
- A combination of a more dovish Fed and a more hawkish ECB towards year-end may be the catalyst for unlocking the EUR/USD upside potential
As very much expected by everyone else than us, the Federal Reserve hiked its target range by 25bp to 1.00%-1.25%. As we wrote in our preview, we are not surprised that the Fed hiked given the very high expectations but we are surprised that the Fed is not more worried about recent inflation prints, as both CPI and PCE inflation are now below 2%. While the Fed still says it monitors inflation 'closely', Yellen was more hawkish during the press conference, as she said one should not over-interpret the recent fall in inflation rates, which she referred to as 'noise' - this despite the fact that the Fed has failed to achieve its 2% inflation target the past eight years when looking at PCE core inflation.
Yellen repeatedly referred to the low unemployment rate and strong labour market data in general, which should be sufficient to push wage growth and inflation higher eventually, in her view. At least the Fed's inflation target seems more like a ceiling than a symmetric target. Also note that Fed removed that it closely monitors 'global economic and financial developments'. Overall, markets interpreted Yellen's comments at the press conference quite hawkishly, as the USD strengthened and US yields moved higher.
We think we learned two very important things. Firstly, the Fed is not as data dependent as it claims to be. Secondly, the Fed more or less only targets the labour market. As we wrote in FOMC Preview: Expectations are high but economic data do not justify a hike, we fear the Fed is making a policy mistake here, as economic data do not justify a rate hike, in our view. Our base case was that a data-dependent Fed would wait at least one meeting to get more data points to support that the weakness in economic data is temporary, especially as it could afford to stay patient, as underlying inflation pressure is not high. This is also what the market tells us since market-based inflation expectations have dropped since the surprising hike in March and the market thinks it is less than 50/50 whether the Fed hikes again this year. However, we stick to our view that the Fed would at some point be forced to do the right thing.
Turning to the updated projections, the 'dots' signal was unchanged at one more hike this year, three hikes next year and a neutral Fed funds rate at 3%. However, it is quite interesting to look at the individual dots, as four FOMC members expect no further hikes this year. One is obviously Bullard (non-voter), who has been an outlier for a long time. The other is Kashkari who dissented yesterday. The question is whether the last two are voting FOMC members or not. We guess it is Evans and Brainard (both voting FOMC members), who have expressed concerns about the recent weakness in inflation rates. If we are right, three of the nine voting FOMC members are quite dovish, which also puts a third Fed hike this year into question.
Based on yesterday's meeting we agree with markets that it is not a given that the Fed hikes again this year but given the Fed's desire to start quantitative tightening we will likely get more details in September so it can start actual QT in Q4 this year (see more below). Right now we are tilted towards a third hike this year in December, as Yellen targets the unemployment rate, but since monetary policy works with a lag and real rates have risen close to neutral (approximately 0% according to the Laubach-Williams estimate) due to lower inflation expectations, the Fed may not hike again this year. At least we think risks are skewed towards the Fed pausing its hiking cycle next year, so we expect a maximum of 1-2 hikes next year if anything.
Fed may be too hawkish on quantitative tightening
We are also surprised that we got a combination of a rate hike and a lot more details on the Fed's plan to shrink its balance sheet ('quantitative tightening', QT), see also FOMC issues addendum to Policy Normalisation Principles and Plans. That said, we are still missing the two most important details: the actual triggers (which most FOMC members want to attach to a quantitative threshold based on the FOMC minutes from the March meeting, see FOMC minutes: Quantitative tightening moving closer, 5 April) and the target for the future appropriate size of the balance sheet. However, the Fed seems very committed to start QT this year and Yellen said at the press conference that it could begin 'relatively soon', i.e. already in September, so it is not unlikely the Fed has skipped the idea of announcing a quantitative threshold for starting QT.
The Fed plans to:
- Initially cease reinvesting for USD6bn in Treasuries, which will increase in steps of USD6bn every quarter over a year until it reaches USD30bn per month.
- Initially cease reinvesting for USD4bn in mortgage-backed securities, which will increase in steps of USD4bn every quarter over a year until it reaches USD20bn.
In total, the Fed will cease reinvesting in bonds for an amount of USD300bn the first year (60% Treasuries and 40% mortgage-backed securities) and USD600bn per year the following years until the target is reached.
In Research US - Fed's regulatory hurdle for starting quantitative tightening we highlighted an optimistic scenario for reducing the balance sheet to be one that targets a total reduction of around USD1,700bn over five years that would amount to an average monthly reduction of USD30bn. With the details provided, the Fed may be too optimistic about QT, as it will amount to USD50bn per month after the first year. However, we still do not know what target for the level of the balance sheet it aims at.
However, in our view, a good thing is that the Fed recognises that the size of the balance sheet must be higher now than pre-crisis since demand for central bank reserves has increased due to increasing financial regulation. In 2015, most of the largest US banks held 20-50% of their HQLA in cash and central bank reserves. Furthermore, European and Asian banks are also required to monitor their liquidity reserve in USD. Large Nordic banks are required to hold HQLA in USD. That said, it remains a question whether the Fed is still too optimistic about how much it can reduce the balance sheet
EUR/USD still set to move higher in 12M
Following the FOMC announcement EUR/USD essentially saw the gains towards 1.13 caused by the weak US CPI figures in the afternoon being wiped and the cross is now back to slightly above the 1.1210 level. Markets clearly interpreted Fed chair Yellen hawkishly during the press conference since she emphasised the strength of the labour market and downplayed lower actual inflation and inflation expectations. However, the drop in actual core inflation in May combined with lower inflation expectations make the FX market – rightly in our view - doubt that the Fed will in the end be able to move on with the somewhat aggressive tightening scheme that yesterday's message otherwise hints at. In that sense, yesterday's move from the Fed is not too different from that of the ECB last week in illustrating the eagerness of central banks to move away from very accommodative and non-conventional measures, but the inflation outlook does not yet justify them taking such moves much further any time soon. Thus, USD strength driven by Fed should prove temporary in our view.
We are tactically short EUR/USD in the Danske FX Trading Portfolio for a dip below 1.10 in the cross over the summer driven by a Fed determined to move on with policy normalisation and an ECB that could be side-lined for a while as inflation and eurozone growth lose momentum. That said, we see a clear risk of the Fed moving too much, too fast on hikes and/or QT near term and thus will be forced to pause later on - and possibly at a time when the ECB is ready to take the next step away from further easing towards yearend. Crucially, this could in our view be the catalyst for unlocking the EUR/USD upside potential (our models point to the mid 1.20s as 'fair' longer term) that fundamentals have been pointing to for an extended period of time
Perfect storm may hit USD liquidity in H2 17
We see a risk that a perfect storm may hit USD liquidity in H2 17. Besides Fed rate hikes and quantitative tightening the US Treasury will likely soon begin to drain liquidity from the market, when a solution to the debt limit issue is found. US Treasury exhausts its 'extraordinary measure' possibly early autumn so Congress must either lift or suspend the debt limit soon to avoid a US government default. As we expect a deal to be reached eventually (although most likely not until very close to the deadline whenever it precisely is), the US Treasury will likely begin to rebuild its cash buffer (which US Treasury aims at USD150-450bn) in late Q3 or in the beginning of Q4 this year, thus draining dollars from the system.
As the Fed may be too optimistic about its ability to shrink its balance sheets, we see a risk of the start of an unwarranted tightening of USD liquidity over the coming 3-12M depending on the timing of the start of the reduction. That should widen the EUR/USD XCCY basis and be a negative contributing factor for EUR/USD, especially now that 40% of the reduction is conducted by ceasing reinvesting mortgage backed securities
Trade Idea : USD/JPY – Hold short entered at 109.60
USD/JPY - 109.65
Most recent candlesticks pattern : N/A
Trend : Down
Tenkan-Sen level : 109.54
Kijun-Sen level : 109.59
Ichimoku cloud top : 110.07
Ichimoku cloud bottom : 109.98
Original strategy :
Sold at 109.60, Target: 108.60, Stop: 109.95
Position : - Short at 109.60
Target : - 108.60
Stop : - 109.95
New strategy :
Hold short entered at 109.60, Target: 108.60, Stop: 109.90
Position : - Short at 109.60
Target : - 108.60
Stop : - 109.90
Although the greenback staged a strong rebound after marginal fall to 108.82 and consolidation above this level would be seen, as long as 109.85-90 holds, mild downside bias remains for another retreat, below 109.20-25 would bring retest of said support but break there is needed to confirm recent decline from 114.37 top has resumed for further weakness towards 108.40-45 (1.618 times projection of 110.81-109.63 measuring from 110.35), however, price should stay well above previous chart support at 108.13.
In view of this, we are holding on to our short position entered at 109.60. Above 109.85-90 would defer and prolong consolidation but only break of resistance at 110.35 would signal an intra-day low is formed instead, bring another bounce to 110.50, then towards said resistance at 110.81.

Currencies: EUR/USD Cannot Take Out Resistance With A Little Help Of The Fed
Sunrise Market Commentary
- Rates: Markets ignore Fed
The Fed tried to sooth markets by holding on to the blueprint of its future tightening cycle, but bond markets largely ignored this message. US yields crashed after weaker inflation readings and couldn't recover lost ground after the Fed meeting. US yield tested or broke below support levels. A confirmed break suggests a return to pre-Trump levels. - Currencies: EUR/USD cannot take out resistance with a little help of the Fed
EUR/USD tested key resistance after weak US inflation and retail sales, but made a U-turn following the FOMC meeting, completely erasing earlier gains. Bonds gave the FOMC decisions a cool reception, suggesting that the “FOMC” turnaround was largely technical-inspired and not driven by fundamental considerations.
The Sunrise Headlines
- In line with expectations, the Fed raised its target rate to 1-1.25%. The press statement contained few surprises as the FOMC is still convinced inflation will rise. The rate projections in the dot plot stayed the same, bar the 2019 projection which was lowered marginally. The Fed also announced details of winding down its balance sheet, which will start ‘relatively soon'.
- US equities ended mixed, with Nasdaq underperforming (-0.41%). Overnight, Asian stocks slumped. Oil touched the lowest level since November, below $47/barrel, as US gasoline supplies unexpectedly rose for a second week.
- The Aussie dollar jumped above AUD/USD 0.76 after an encouraging jobs report. Employment again surged in May, led by a rebound in full-time positions, sending the jobless rate to the lowest level in more than four years.
- New Zealand's dollar fell from near a four-month high after a report showed gross domestic product grew 0.5% Q/Q in Q1, less than the forecast of 0.7%. Y/Y growth printed at 2.5% compared to a consensus of 2.7%.
- The special counsel investigating Russia's interference in the '16 election is now expanding the scope of special counsel Mueller's investigation from Trump's associates to Trump himself, sources familiar with the inquiry reported.
- ECB Nowotny asked whether adopting an inflation range, rather than a specific target, would make more sense in a situation where price growth is low for a long time.
- The eco calendar today contains the Bank of England's rate decision and UK retail sales. In the US, industrial production and initial jobless claims data will be released this afternoon. Spain and France tap the market.
Currencies: EUR/USD Cannot Take Out Resistance With A Little Help Of The Fed
Dollar rollercoaster ride on data and FOMC
The dollar made a rollercoaster ride yesterday. Weak US inflation and retail sales pushed the dollar lower across the board. EUR/USD shot higher from about 1.12 to about 1.13, while USD/JPY dropped from 110.30 to just below 109. The FOMC hiked rates as expected, left its rate path virtually early unchanged and announced that the start of the balance sheet run-off would be “relatively soon”. It couldn't convince bond traders. Bonds only retraced very partially strong gains on the weak data. The dollar however made a full U-turn with EUR/USD back to 112 (close 1.1218). USD/JPY didn't completely erase losses, closing at 109.58 from 110.07 on Tuesday. We think that technical arguments played a role in the full retracement of EUR/USD's initial gains, as resistance could not be taken out (triggering profit taking).
Asian equities trade in negative territory overnight, but without sharp losses. Oil digests yesterday's big inventory-related price drop. USD/JPY tested the downside early on, but reverted to opening levels soon (109.60). EUR/USD traded uneventful in Asia around 1.1220.
The US calendar is well filled today. US production is expected at 0.2% M/M in May, albeit after a strong 1% M/M in April. More attention will go to business sentiment data of NY and Philadelphia. The NY measure may be slightly higher, while there is scope for a drop in the Philly Fed index given recent very high, unsustainable (?), levels. Jobless claims and NAHB housing market sentiment may be close to unchanged, but at high levels. We don't expect mixed data to give FX markets firm direction.
The dollar gained ground on the FOMC decision, even as US yields didn't move much higher. EUR/USD approached key resistance at 1.1300/66, but the test failed, keeping our hypothesis that the upside of EUR/USD is capped alive. We don't expect a sharp comeback of the dollar in the near term without distinctively better US growth and higher inflation readings. While markets decided to (largely) ignore the FOMC decision, we think they should at some point move in the Fed's direction. Therefore we favour EUR/USD to move lower in the 1.08/1.13 range, but a trigger is currently unavailable. We remain cautious on the upside in USD/JPY ahead of Friday's BOJ meeting. The pair might still go for a test of the 108.13 April low if equities correct lower. At least more signs of a bottoming out are needed to favour long USD/JPY longs.
Technical picture
The USD/JPY rally ran into resistance in early May. A mini sell-off pushed the pair below the previous top (112.20), making the short-term picture negative and driving the pair further down in the 108.13/114.37 range. There is no convincing sign of a U-turn yet.
Early May, EUR/USD failed to break below the 1.0821/1.0778 support (gap). Poor US data and US political upheaval propelled EUR/USD north of the 1.1023 range top to a corrective top of 1.1323 early June. A higher low, higher high pattern developed, but the pair is digesting earlier gains and consolidates near the top. The Trump top/correction top at 1.1300/1.1366 is next strong resistance. USD sentiment will have be very negative to clear this hurdle. A return below 1.1023 would indicate that the upside momentum has eased.
EUR/USD: Failed test of 1.1300/66 resistance. Prefer to see EUR/USD moving deeper in 1.08/1.13 range, but trigger is not available
EUR/GBP
Sterling likely to remain weak
The Bank of England reconvenes today to decide on its the policy rate and the direction of future policy decisions. Earlier this week, the May UK inflation rate rose more than expected, from 2.7% to 2.9%. Meanwhile, the labour market data came in lower than expected with weekly hourly earnings (excl. bonuses) rising only 1.7% compared to a consensus forecast of 2%. On balance, UK consumers are thus losing purchasing power. The combination of the latest sterling depreciation, the evidence of the pass through of sterling to CPI, the potentially weaker economic growth and lower wage inflation suggest that inflation might by higher in the short term and potentially lower in the longer term. This lowers the chance of UK inflation overshooting the BoE target in the longer run and therefore weakens the need for the BoE to hike rates. In addition, political uncertainty remains elevated. A moderately dovish adjustment to the language and guidance is possible and would buy some time until the August meeting when the new inflation projections are available. By then, the political situation could possibly have become clearer as well.
Sterling began and ended the day yesterday at around the same level compared to the dollar (around 1.2750 for cable) and to the euro (around 0.88 EUR/GBP).
From a technical point of view, EUR/GBP broke above the 0.8774 resistance and tested the 0.8854 area (2017 top) on Friday. A real break didn't occur. A retest of that area is possible. A break beyond would open the way to the 0.90 area. A return below the 0.8655 correction low would be an indication that the pressure on sterling is easing
EUR/GBP: first test of 2017 top rejected, but sterling remains in the defensive
EUR/USD Daily Outlook
Daily Pivots: (S1) 1.1189; (P) 1.1206 (R1) 1.1228; More....
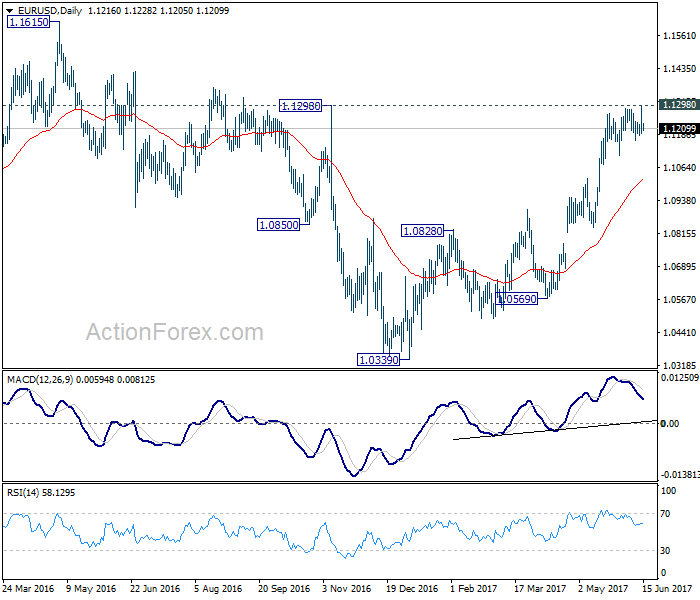
EUR/USD edged higher to 1.1295 but failed to take out 1.1298 key resistance and retreated. As the pair is staying above 1.1109 near term support, intraday bias remains neutral first. Main focus remains on 1.1298. Decisive break there will carry larger bullish implication and target 1.1615 resistance next. On the downside, break of 1.1109 support will indicate short term topping and rejection from 1.1298. In such case, intraday bias will be turned to the downside for 1.0838 support.
In the bigger picture, the case for medium term reversal continues to build up with EUR/USD staying far above 55 week EMA (now at 1.0922). Also, bullish convergence condition is seen in weekly MACD. Focus will now be on 1.1298 key resistance. Rejection from there will maintain medium term bearishness and would extend the whole down trend from 1.6039 (2008 high). However, firm break of 1.1298 will indicate reversal. In such case, further rally would be seen back to 1.2042 support turned resistance next.
Dollar Not Out of the Woods Despite Upbeat FOMC, SNB and BoE Next
Dollar recovered overnight as Fed delivered the widely expected rate hike. The overall announcement, including new economic projections, was not as bad as some anticipated. Fed maintained the projection of a total of three rate hike this year. Downward revision in 2017 inflation forecast was somewhat offset by the upward revision in GDP forecast and downward revision in unemployment rate forecast. On other hand, both growth and inflation forecasts for 2018 and 2019 were held unchanged. While the greenback was lifted, it's clearly not out of the woods yet as markets seem not fully convinced by what Fed said.
More on FOMC Rate Decision:
- Dollar Recovers after Not that Dovish Fed Hike
- Fed Stands By Its Rate Path
- FOMC: Model Dominates the Outlook Over Current Inflation
- Fed Raises Rates Hoping Inflation Turns Soon
- No Surprise as the Fed Raises Rates, Continues to Signal Gradual Tightening
- Dollar Surges As Hawkish Fed Raises Rates, Maintains Rate Outlook, Talks Balance Sheet Reduction
TNX stays in near term down trend
Reactions in treasury yield is an evidence the markets are not as optimistic as Fed. 10 year yield dipped to as low as 2.103 after yesterday's CPI disappointment. FOMC decision lifted TNX mildly to close at 2.138. But that's still way off prior day's close at 2.207. Near term outlook will remain bearish as long as 2.229 resistance holds. And we'd expect further decline to 50% retracement of 1.336 to 2.621 at 1.9785.
Fed fund futures implies just 18% chance of September hike
Fed fund futures are pricing in just 18.03% chance of another rate hike in September. That's lower than prior day's pricing at 28.19% and last month's pricing at 26.7%.
Dollar stays bearish against Euro, Swiss Franc, Yen and Loonie
Technically, while EUR/USD failed to take out 1.1298 key resistance, it's still holding well above 1.1109 near term support. For now, outlook in EUR/USD stays bullish and current development could be just delaying the upside breakout. Meanwhile, USD/CHF is held well below 0.9807 resistance. USD/JPY is staying bearish with 110.80 resistance intact. USD/CAD also stays well below 1.3387 support turned resistance and remains bearish.
Aussie lifted by job data
Australia unemployment rate unexpectedly dropped to 5.5% in May, down from 5.7% and below expectation of 5.7%. That's also the lowest number since February 2013. Headline job number showed 42k growth, well above expectation of 10k. Full-time jobs grew 52.1k while part-time jobs fell -10.1k. Participation rate also rose 0.1% to 64.9%. Speculations of a rate cut by RBA receded after the release.
Kiwi underwhelmed by GDP miss
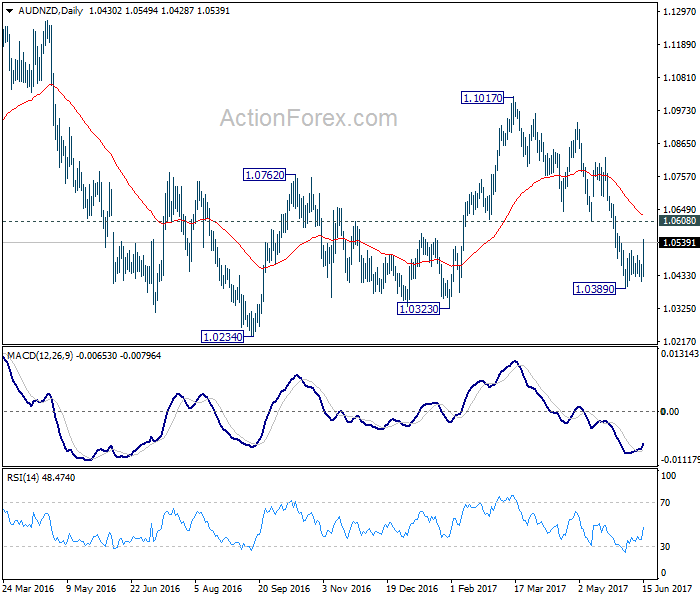
On the other hand, New Zealand GDP grew only 0.5% qoq in Q1, below expectation of 0.7% qoq. While Kiwi remains the second strongest major currency for the month, it's overtaken by Aussie. AUD/NZD's strong rebound confirms short term bottoming at 1.0389 and further rise would be seen. Focus is back on 1.0608 resistance. As long as this resistance holds, we're holding on to the view that consolidation from 1.0234 has completed at 1.1017 and deeper fall is expected through 1.0234 low at a later stage. But firm break of 1.0608 will suggest that stronger rise would be seen back to 1.1017 resistance.
SNB and BoE to watch in European session
SNB and BoE rate decisions are the key events to watch in European session. SNB is expected to keep the Libor target range unchanged at -0.25% to -0.75% today. The central bank will likely maintain its current monetary stance and reiterate its complaint on Franc overvaluation. BoE is widely expected to keep bank rate unchanged at 0.25% and asset purchase target at GBP 435b. Attention will be on voting but after the CPI upside surprise earlier this week, Kristin Forbes will likely continue to vote for a hike. Both central bank announcements could turn out to be non-events.
Also to be released in European session include Swiss PPI, UK retail sales and Eurozone trade balance. In US session, US will release import price index, Empire State manufacturing index, Philly Fed survey, jobless claims, industrial production and NAHB housing market index.
EUR/USD Daily Outlook
Daily Pivots: (S1) 1.1189; (P) 1.1206 (R1) 1.1228; More....
EUR/USD edged higher to 1.1295 but failed to take out 1.1298 key resistance and retreated. As the pair is staying above 1.1109 near term support, intraday bias remains neutral first. Main focus remains on 1.1298. Decisive break there will carry larger bullish implication and target 1.1615 resistance next. On the downside, break of 1.1109 support will indicate short term topping and rejection from 1.1298. In such case, intraday bias will be turned to the downside for 1.0838 support.
In the bigger picture, the case for medium term reversal continues to build up with EUR/USD staying far above 55 week EMA (now at 1.0922). Also, bullish convergence condition is seen in weekly MACD. Focus will now be on 1.1298 key resistance. Rejection from there will maintain medium term bearishness and would extend the whole down trend from 1.6039 (2008 high). However, firm break of 1.1298 will indicate reversal. In such case, further rally would be seen back to 1.2042 support turned resistance next.
Economic Indicators Update
| GMT | Ccy | Events | Actual | Forecast | Previous | Revised |
|---|---|---|---|---|---|---|
| 22:45 | NZD | GDP Q/Q Q1 | 0.50% | 0.70% | 0.40% | |
| 1:00 | AUD | Consumer Inflation Expectation Jun | 3.60% | 4.00% | ||
| 1:30 | AUD | Employment Change May | 42.0K | 10.0K | 37.4K | |
| 1:30 | AUD | Unemployment Rate May | 5.50% | 5.70% | 5.70% | |
| 7:15 | CHF | Producer & Import Prices M/M May | 0.00% | -0.20% | ||
| 7:15 | CHF | Producer & Import Prices Y/Y May | 0.90% | 0.80% | ||
| 7:30 | CHF | SNB Sight Deposit Interest Rate | -0.75% | -0.75% | ||
| 7:30 | CHF | SNB 3-Month Libor Lower Target Range | -1.25% | -1.25% | ||
| 7:30 | CHF | SNB 3-Month Libor Upper Target Range | -0.25% | -0.25% | ||
| 8:30 | GBP | Retail Sales M/M May | -0.90% | 2.30% | ||
| 9:00 | EUR | Eurozone Trade Balance (EUR) Apr | 22.4B | 23.1B | ||
| 11:00 | GBP | BoE Rate Decision | 0.25% | 0.25% | ||
| 11:00 | GBP | BoE Asset Purchase Target Jun | 435B | 435B | ||
| 11:00 | GBP | MPC Official Bank Rate Votes | 1--0--6 | 1--0--7 | ||
| 11:00 | GBP | MPC Asset Purchase Facility Votes | 0--0--7 | 0--0--8 | ||
| 12:30 | CAD | Manufacturing Shipments M/M Apr | 0.90% | 1.00% | ||
| 12:30 | USD | Import Price Index M/M May | -0.10% | 0.50% | ||
| 12:30 | USD | Empire State Manufacturing Index Jun | 6 | -1 | ||
| 12:30 | USD | Initial Jobless Claims (JUN 10) | 241K | 245K | ||
| 12:30 | USD | Philly Fed Manufacturing Index Jun | 25 | 38.8 | ||
| 13:15 | USD | Industrial Production May | 0.20% | 1.00% | ||
| 13:15 | USD | Capacity Utilization May | 76.80% | 76.70% | ||
| 14:00 | USD | NAHB Housing Market Index Jun | 70 | 70 | ||
| 14:30 | USD | Natural Gas Storage | 106B | |||
| 20:00 | USD | Net Long-term TIC Flows Apr | 37.3B | 59.8B |
Market Update – Asian Session: Strong Aussie Jobs Dent RBA Rate Cut Outlook
Asia Mid-Session Market Update: Strong Aussie jobs dent RBA rate cut outlook; Trump under expanded probe for obstruction
US Session Highlights
(US) MAY ADVANCE RETAIL SALES M/M: -0.3% V 0.0%E; RETAIL SALES EX AUTO M/M: -0.3% V 0.1%E
(US) MAY CPI M/M: -0.1% V 0.0%E (2nd negative reading in last 3 months); CPI EX FOOD AND ENERGY M/M: 0.1% V 0.2%E; CPI INDEX NSA: 251.329 V 251.580E
(US) DOE CRUDE: -1.7M V -2.5ME; GASOLINE: +2.1M V -1ME; DISTILLATE: +0.3M V +0.5ME
FOMC decides to lift key interest rates 1/4%, as expected, to 1%-1.25%, leaving room for one more rate hike in 2017. Fed Chair Yellen also said that starting this year the Fed would gradually start unwinding its $4.5 trillion balance sheet, and the lack of slowdown in the projected rate hike path suggests the Fed can both do balance sheet reduction and rate hikes concurrently.
US markets on close: Dow +0.2%, S&P500 -0.1%, Nasdaq -0.4%
Best Sector in S&P500: Consumer Staples
Worst Sector in S&P500: Energy
Biggest gainers: ALXN +9.3%; HRB +7.9%; M +2.3%
Biggest losers: URI -6.1%; SWN -5.4%; MUR -5.4%
At the close: VIX 10.6 (+0.2pts); Treasuries: 2-yr 1.36% (+1bps), 10-yr 2.14% (-7bps), 30-yr 2.78% (-8bps)
US movers afterhours
AVXS Announces alignment with FDA on GMP Commercial Manufacturing Process for AVXS-101 ; +6.8% afterhours
JBL Reports Q3 $0.31 v $0.29e, Rev $4.49B v $4.41Be; Guides Q4 $0.50-0.74 v $0.61e, R$4.7-5.1B v $4.79Be - Guides FY18 ~$2.60 v $2.08e ; +3.3% afterhours
PACB Announces proposed public offering of common stock; size not disclosed; -10.2% afterhours
Politics
(US) Special Counsel Mueller investigating President Trump for possible obstruction; Probe has widened to include Trump after he fired FBI Director Comey - Washington Post
Key economic data
(AU) AUSTRALIA MAY EMPLOYMENT CHANGE: +42.0K (3rd straight increase) V +10.0KE; UNEMPLOYMENT RATE: 5.5% (4-year low) V 5.7%E
(AU) AUSTRALIA JUNE CONSUMER INFLATION EXPECTATION: 3.6% V 4.0% PRIOR (6-month low)
(NZ) NEW ZEALAND Q1 GDP Q/Q: 0.5% V 0.7%E; Y/Y: 2.5% V 2.7%E
Notes and Observations
Asian markets taking the latest FOMC rate hike mostly in stride, with the exception of Hong Kong property names coming under pressure from a matching rate increase by HKMA.
Moderate USD strength weighing on precious metals, leading to losses among Australian gold producers.
AUD/USD rallied about 50pips on much stronger than expected Aussie jobs data, as unemployment rate fell to 4-year low despite the rise in participation rate; Conversely, NZD under pressure after a miss in Q1 GDP, falling some 60pips from the highs toward 0.72
Risk-off flows materializing after a Washington Post report claimed Special Counsel Mueller is looking directly at President Trump for obstruction in relation to firing of FBI Dir Comey and pressure to end investigation of Michael Flynn. Mueller to interview Head of Intelligence Coats, NSA head Coats, and others as soon as next week.
Speakers and Press
China
(CN) PBOC injected funds through open market operations (OMO) today to counter liquidity stress from tax payments and maturing repos - press
(CN) China Academy of Social Sciences (CASS): House prices in Beijing fell 4.1% m/m - Shanghai Daily
(CN) China NDRC: out 43.4Mt of crude steel capacity and 97Mt of coal capacity as of the end of May
Japan
(JP) Junichi Fukuda said to replace Shinichi Sato as Japan Administrative Vice Minister - Japan press
Australia/New Zealand
(AU) CBA: Australia pace of employment growth clearly accelerated; Recent run of strong data takes RBA rate cut off the table for now - press
(NZ) Stats NZ: Investment in plant, machinery and equipment has been the strongest in almost seven years, reflecting higher domestic production and greater imports of machinery - NZ Press
Korea
(KR) South Korea Fin Min Kim: Job creation is a top priority of President Moon's administration
Asian Equity Indices/Futures (00:00ET)
Nikkei -0.4%, Hang Seng -1.1%, Shanghai Composite -0.1%, ASX200 -1.3%, Kospi -0.7%
Equity Futures: S&P500 -0.3%; Nasdaq -0.5%, Dax closed, FTSE100 -0.3%
FX ranges/Commodities/Fixed Income (00:00ET)
EUR 1.1205-1.1230; JPY 109.30-109.80; AUD 0.7580-0.7630; NZD 0.7210-0.7270
Aug Gold -0.7% at 1,267/oz; July Crude Oil -0.1% at $44.69/brl; July Copper +0.5% at $2.58/lb
SPDR Gold Trust ETF daily holdings fall 12.1 tonnes to 854.9 tonnes; lowest since June 5th and first decline since May 23rd
(CN) PBOC SETS YUAN MID POINT AT 6.7852 V 6.7939 PRIOR; 2nd straight firmer Yuan fix; Strongest Yuan fix since Nov 9th
(CN) PBOC to inject combined CNY150B v CNY90B prior in 7-day, 14-day and 28-day reverse repos
Asia equities notable movers
Australia
Watpac (WTP) -11.4%; Guides FY17 underlying Net to be broadly breakeven y/y (implies ~A$8.5M)
Oil Search (OSH) -2.8%; Affirms FY17 production 28.5-30.5 MMBOE; closed upsized refinancing of $500M debt facility to $600M - investor slides
Tox Free (TOX) -0.6%; Guides FY17 underlying EBITDA of A$82-83M v A$83Me; H2 trading has improved on H1 meeting budget expectations
Japan
Kobe Steel (5406) -3.7%; targeting FY20 pretax profit ¥20B (v ¥12B FY16/17) - Nikkei
Toshiba (6502) -1.1%; On track to select preferred bidder for chip unit in the second half of June; To be demoted to the second section of Tokyo Stock Exchange (TSE) amid financial statement delay
TEPCO (9501) -1.1%; Plans for restructuring of nuclear power business do not impact forming capital ties with other power utilities - Nikkei
Hong Kong
Meitu (1357) -6.4%; shareholder to sell 66M shares at HK$8.50/shr
China Southern (1055) -0.5%; Reports May passenger traffic +13% y/y
Oriental Watch (398) -1.7%; Reports FY16/17 (HK$) Net 16.1M v loss 15.8M y/y; Rev 3.14B v 3.03B y/y
Rykadan Capital (2288) -11.9%; Reports FY17 (HK$) Net 54.4M v loss 91.6M y/y; Rev 602.3M v 153.1M y/y
Besunyen Holdings (926) +6.6%; Guides H1 Net CNY25-35M
China Life Insurance Co (2628) -2.0%%; Reports May YTD premium income CNY298.5B, +19% y/y
Fed Stands By Its Rate Path
- The FOMC raised its FF rate target as expected by 25 bps to 1-1.25%
- Press statement showed little surprises; Yellen sees inflation going higher
- Fed’s median rate projections for 2017, 2018 unchanged; 2019 marginally lower
- Fed intends to start balance sheet tapering soon if economy evolves as expected
- Starting cap for tapering $6B/month for Treasuries & $4B for MBS
- At full speed (after 1 year) tapering amounts to $50B/month or 600B/year
FOMC unmoved by slower inflation
The FOMC as expected raised its Fed funds target range by 25 basis points to 1%‐1.25%, the third consecutive quarterly rate increase. The press statement didn’t contain much surprises compared to the March and May statements. Growth projections were virtually unchanged from the March ones, the unemployment rate was substantially revised lower for the years up to 2019 and the long run employment rate was lowered 0.1%‐point to 4.6%. The FOMC lowered the inflation projection for end 2017 to 1.6% from 1.9% in March, but kept it unchanged for headline and core PCE inflation at 2% for 2018 and 2019. The statement recognizes that inflation has declined recently and is running somewhat below 2%. The FOMC said it expected inflation to remain below 2% in the near term, but to stabilize around 2% over the medium term. Yellen attributed the recent decline in inflation to idiosyncratic reasons like wireless services prices and prices for prescription drugs. She however maintained her view that the Philips curve, while rather flat, is still valid. When the labour market tightens further, she expects higher wages growth and ultimately higher inflation. She summarized that the growth and inflation environment was broadly the same as in March. Inflation developments would, however, be followed closely , suggesting that some governors are concerned about recent inflation readings.
FOMC sticks to its rate path projection
The FOMC policy outlook (dot plot) was virtually unchanged. Before the end of 2017, the Fed expects one more rate hike (1.375%) and 3 for 2018 3 (2.125%). In 2019, the the Fed expects 3 rate hikes (to 2.875%) instead of 3.5 hikes (to 3%) in March. This was mainly due to the number of participants (16 instead of 17). Looking to the individual dots, it looks that 1 governor of the majority (Evans? Brainard?) changed his 2017 view from 3 to 2 rate hikes (which took already place). So, the FOMC as a Committee stuck to its projected path of gradual rising rates over the next years.
Tapering balance sheet to start in 2017
The FOMC confirmed its intention to start winding down its balance, by not fully reinvesting the proceeds of the maturing assets, this year, if the economy evolves as expected. We suspect that the FOMC wants to raise rates once again in September and start its balance sheet run‐off in early Q4, suggesting unchanged rates in December to gauge the impact of the tapering. The Fed published an addendum to the policy normalization principles and plans
Initial run-off small ($10B/month)
The central bank will shrink its balance sheet (and at the same time the reserves held by financial institutions at the Fed) by decreasing its reinvestments, but only to the extent the payments of the maturing assets it receives exceed a gradually rising cap. For Treasuries, the cap will be $6B/month at the start and will increase in steps of $6B at 3‐month intervals over 12 months until it reaches $30B/month. For Agency and MBS debt, the initial cap is $4B/month to be increased over 1 year to $20B/month. Once these maximum amounts are reached, the caps remain in place until the desired size of the balance sheet is reached. That desired size will be decided later on and depends on the way the Fed wants to conduct its monetary policy. Yellen said that the post‐crisis policy setting was working very well, suggesting the Fed may not go back to its pre‐crisis system of open market operations. This means that the size of the balance sheet (and the reserves), after normalization, will be appreciable below levels seen in recent years, but larger than before the crisis.
Fed Fund rate to remain main tool
The FOMC affirms that the FF rate will remain the main tool to adjust its policy, but it is ready to resume reinvestments if a material deterioration in the economic outlook were to warrant a sizeable reduction in the FF target. It would also re‐use the QE tools, including altering the size and composition of the balance sheet if the FF rate would be near the zero bound and more accommodation was needed.
How long will it take to normalize?
After one year (end 2018?), the reduction of the reinvestments would amount to $50B/month or $600B/year (first year $300B). If the current $4.5 T balance would be lowered to $2.5T (Bernanke suggestion), it would take less than 4 years (to about end 2021) to reach the end of the normalization if our $2.5 T hypothesis is correct..
Market reaction subdued after FOMC
US Treasuries sharply rallied in the afternoon on weak CPI and retail sales. After the FOMC, they returned some of the gains. In a daily perspective, the curve was still substantially lower and flatter with yields down between 3.2 bps and 9.9 bps. Markets clearly don’t believe that the FOMC will be able to increase rates as they project it in the dot plot. Probabilities for an additional 2017 rate hike in September are 21%, and 36% for December. For end 2018, markets expect a 1.50% FF rate versus 2.125% for the Fed. End 2019 markets don’t even discount an extra rate hike. So, the gap between markets and the Fed remains as large as before.
The dollar lost substantial ground on the afternoon data releases, but recouped them after the FOMC. Only USD/JPY remained slightly below opening levels.
US equities ended the session narrowly mixed with the Dow eking out marginal gains, the S&P 500 nearly unchanged and the NASDAQ registering modest losses