
Sample Category Title
GBP/USD Mid-Day Outlook
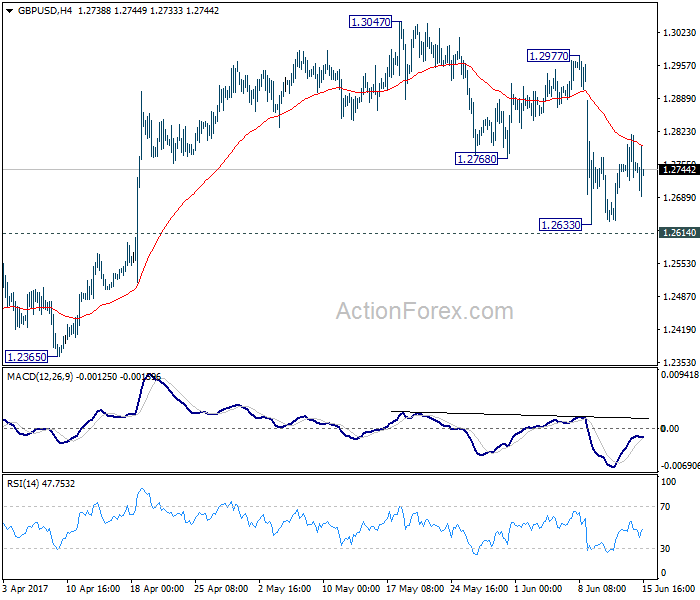
Daily Pivots: (S1) 1.2710; (P) 1.2764; (R1) 1.2804; More...
Intraday bias in GBP/USD remains neutral for the moment and consolidation from 1.2633 might extend. Near term outlook remains bearish with 1.2977 resistance intact. We continue to favor the case that consolidation pattern from 1.1946 has completed at 1.3047 already. Decisive break of 1.2614 resistance turned support would confirm our bearish view and target a test on 1.1946 low next. However, break of 1.2977 will dampen our view and turn bias back to the upside for 1.3047 and above.
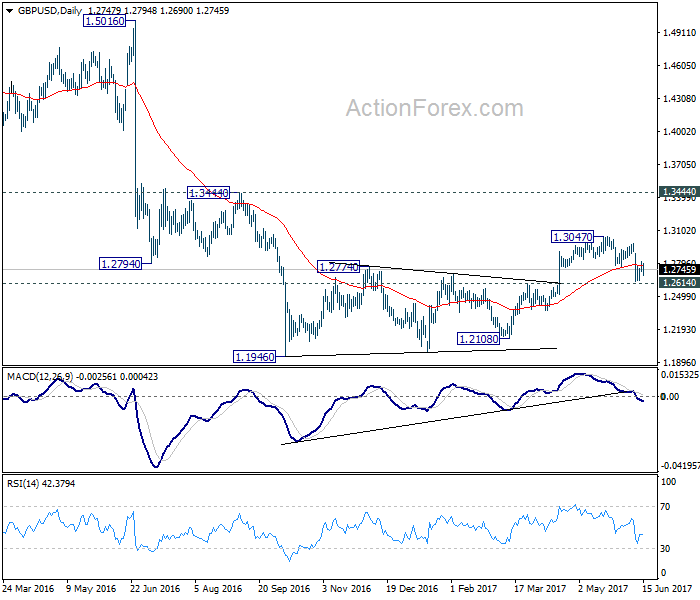
In the bigger picture, fall from 1.7190 is seen as part of the down trend from 2.1161. Price actions from 1.1946 medium term low are seen as a consolidation pattern, which could have completed after hitting 55 week EMA. Break of 1.1946 low will target 61.8% projection of 1.5016 to 1.1946 from 1.3047 at 1.1150 next. In case the consolidation from 1.1946 extends, outlook will stay remain bearish as long as 1.3444 resistance holds.
USD/JPY Mid-Day Outlook
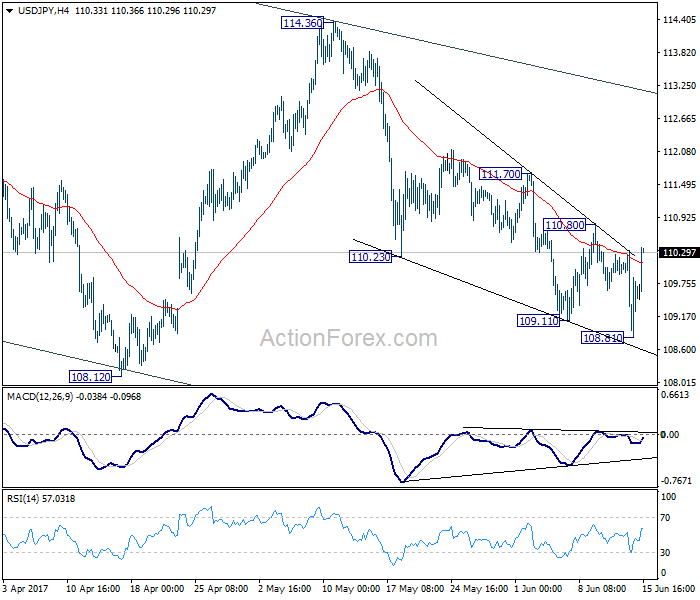
Daily Pivots: (S1) 108.79; (P) 109.56; (R1) 110.34; More...
With 4 hours MACD crossed above signal line, intraday bias in USD/JPY is turned neutral first. With 110.80 resistance intact, further decline is still expected to 108.12 low first. Break will extend the whole corrective fall from 118.65 to 61.8% retracement of 98.97 to 118.65 at 106.48. We will look for bottoming sign there. However, break of 110.80 should indicate completion of fall from 114.36. In that case, intraday bias will turned back to the upside for 111.70. Break will target 114.36 key resistance.
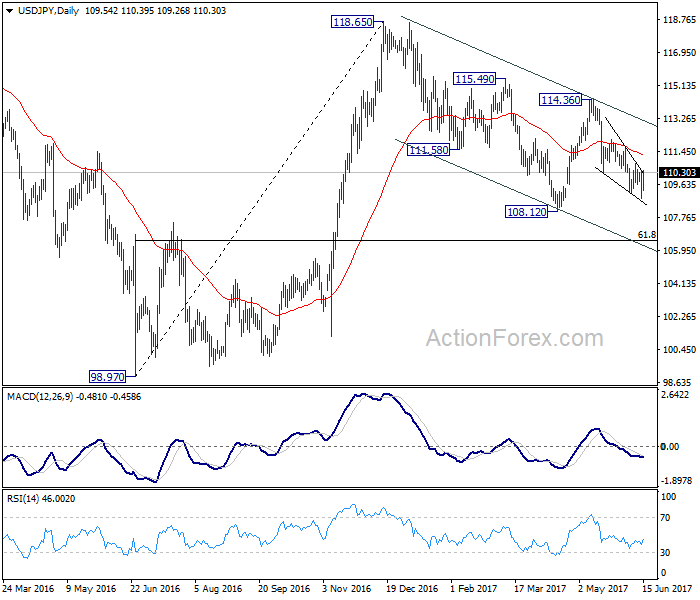
In the bigger picture, price actions from 125.85 high are seen as a corrective pattern. It's uncertain whether it's completed yet. But in case of another fall, downside should be contained by 61.8% retracement of 75.56 to 125.85 at 94.77 to bring rebound. Overall, rise from 75.56 is still expected to resume later after the correction from 125.85 completes.
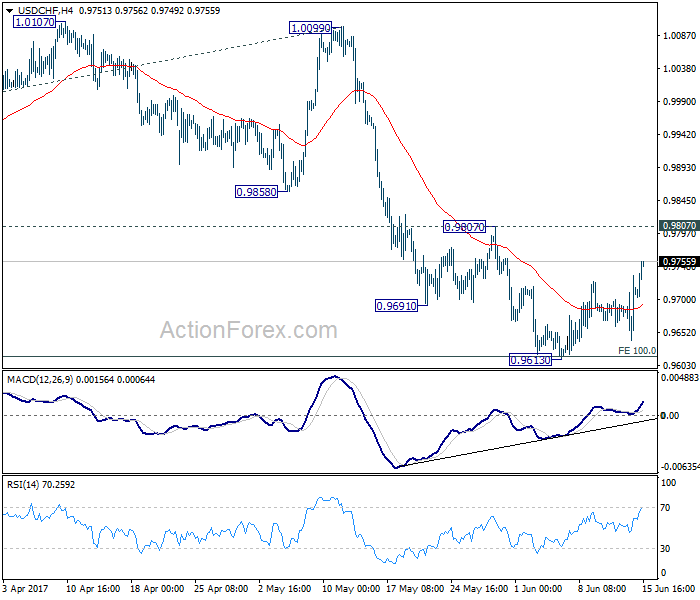
USD/CHF Mid-Day Outlook
Daily Pivots: (S1) 0.9654; (P) 0.9694; (R1) 0.9749; More.....
USD/CHF's rebound from 0.9613 extends to as high as 0.9755 so far. However, it's kept well below 0.9807 resistance. Thus, there is no clear indication of reversal yet. As long as 0.9807 stays intact, deeper fall is still in favor. Break of 0.9613 will extend the whole decline from 1.0342 to 0.9548 support and below. We'd start to look for bottoming signal again as it approaches 0.9443 key support level. However, considering bullish convergence condition in 4 hour MACD, break of 0.9807 will indicate near term reversal and turn outlook bullish for 1.0099 resistance next.
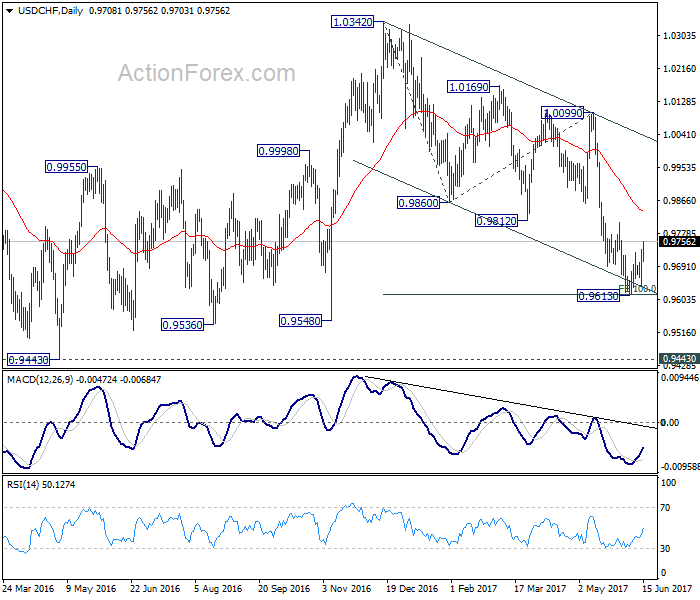
In the bigger picture, USD/CHF is still bounded in medium term range of 0.9443/1.0342 for the moment. Consolidative trading would likely continue and medium term outlook remains neutral. Break of 1.0342 key resistance is needed to confirm underlying bullish momentum in the pair. Meanwhile, downside attempts should be contained by 0.9443 key support level. However, sustained break of 0.9443 will carry larger bearish implication and target 0.9 handle.
GBPUSD Failed To Break Resistance, AUDUSD Looks Bullish
GBPUSD pair fails to break the resistance at 1.2815, investors slams the pair back into consolidating zone
GBPUSD is currently closing to the 1st support at 1.2707, the June 13 mid open/close price, if it breaks through, the further support will be on 1.2636, the June 9 low and the last support is on 1.2625-15, the 100 direct moving average and also the March 27 high. The first resistance is on 1.2815-18, the 200 hour moving average and June 14 high, whereas the second is on 1.2846-53, the 2nd and 3rd June lows are also 61.8% Fibonacci. If the price breaks through the 2nd resistance, it might form a bullish trend since it will be trading above 2 moving averages and challenge the 3rd resistance, 1.2876, the 21-DMA
AUDUSD bullish on the heels of economic data, eyes on first resistance 0.7636, June 14 high
AUDUSD is currently trading at 0.76032, a short fall after today's high. If the price successfully breaks out of the first resistance 0.7636, the June high, the bullish trend might persist to the second resistance 0.7651, which is 76% Fibonacci of the March-May slump, and the last resistance lies at 0.7680, the March 30 high. The chart's first support is on 0.7566, the June high, whereas the 2nd support is on 0.7527-20, the DMA June 9 low. However, if the price falls below the 3rd support, 0.75, which is the June 7 low, it might signify a huge selling pressure as the price will be trading under 2 moving averages. (Yellow = 50 day moving average, Green = 100 day moving average)
Is a BoE Rate Hike Closer Than We Thought?
The Bank of England caught traders off-guard on Thursday, turning what was expected to be a rather mundane affair into something far more interesting, as two policy makers joined Kristin Forbes in voting for a rate hike.
That took the vote to 5 to 3 in favour of no change which is dramatically closer than markets had anticipated. The belief prior to today's meeting was that we'll be waiting until at least 2019 for a rate hike and that policy makers will look through temporary spikes in inflation in the meantime, in favour of supporting the economy. The minutes suggested something very different though, instead suggesting that continued employment growth could suggest space capacity and the central banks tolerance of above-target inflation is being eroded.
While sterling did rally on the news, it has so far failed to break 1.28 against the dollar, having traded around 1.27 prior to the release. While it may still break above there today, it would appear that traders are refusing to overreact to the minutes and there are some good reasons why. The most obvious is that Forbes is leaving the BoE at the end of the month, reducing the number of those favouring a hike - and possibly the most hawkish - by one. With the economic outlook still challenging, wage growth will likely remain weak which should act as a drag on longer term inflation once the currency impact passes, assuming we don't see further dramatic shifts lower in sterling.
The one thing that today's announcement will achieve is that markets will be less complacent going into future meetings and while the BoE may refrain from raising interest rates, should they feel they have to, the markets should be somewhat prepared.
USD/CAD Rebounds from Major Support
USD/CAD has seen a substantial 3.65% slump since May 5th.
The FOMC made a hawkish statement on Wednesday evening, June 15th, resulting in a sharp rebound of USD and USD/CAD.
As a result, the USD/CAD downtrend was held above the short term major support level at 1.3200, after hitting a 3-and-a-half-month low of 1.3164,
There is stronger support at the level at 1.3200, we will likely see an ongoing rebound as a correction post a slump.
On the 4-hourly chart, the price has been moving from the lower band to the middle band by the Bollinger Band indicator, suggesting increased bullish momentum.
The daily Stochastic Oscillator reading is below 20, suggesting a rebound.
The resistance level is at 1.3300, followed by 1.3350.
The support line is at 1.3250, followed by 1.3200.
The US initial jobless claims (the week ending June 9th) will be released at 13:30 BST this afternoon. Be aware that it will likely affect USD and USD/CAD.
Daily Technical Analysis: EURUSD, GBPUSD, USDJPY, USDCHF
EURUSD
The EURUSD attempted to push higher yesterday, slipped above 1.1285 but whipsawed to the downside and closed lower at 1.1217. As long as stay above 1.1080 I remain bullish, but we may have a false breakout bearish pullback scenario as you can see on my H4 chart below. The bias is bearish in nearest term testing 1.1160. A clear break below that area could trigger further bearish pressure testing 1.1080 key support which remains a good place to buy with a tight stop loss. On the upside, we need a clear break above 1.1285 to continue the bullish scenario testing 1.1350 – 1.1425 region.
GBPUSD
The GBPUSD was indecisive yesterday. Price slipped above 1.2780 key resistance but closed lower at 1.2750. The bias is neutral in nearest term probably with a little bearish bias testing 1.2700 area. A clear break below that area could trigger further bearish pressure testing 1.2635 key support. The pin bar bullish scenario should remain valid but need a clear break above 1.2780 key resistance to confirm the bullish scenario targeting 1.2900 – 1.3000/50 region. On the downside, a clear break below 1.2635 would nullify any bullish scenario targeting 1.2500 area.
USDJPY
The USDJPY attempted to push lower yesterday bottomed at 108.82 but closed higher at 109.57. The bias is neutral in nearest term probably with a little bullish bias testing 110.35 area but as long as stay below the trend line resistance I remain bearish targeting 108.00 region and any upside pullback should be seen as a good opportunity to sell. Immediate support is seen around 109.25. A clear break below that area could trigger further bearish pressure retesting 108.80 region.
USDCHF
The USDCHF was indecisive yesterday. The bias is neutral in nearest term but as long as stay below 0.9815 I remain bearish and any upside pullback should be seen as a good opportunity to sell. Immediate support is seen around 0.9650 followed by 0.9600. Immediate resistance is seen around 0.9735. A clear break above that area could trigger further bullish pressure testing 0.9815 which is a good place to sell with a tight stop loss.
DAX Slips As Fed Delivers Hawkish Rate Statement, Eurozone CPI Next
The DAX index has posted considerable losses in the Thursday session, dropping 1.04 percent. The index is currently at 12,684.50 points. On the release front, the eurozone trade surplus dropped sharply, coming in at EUR 19.6 billion. This was well short of the forecast of EUR 22.4 billion. On Friday, the eurozone releases Final CPI, which is expected to drop to 1.4 percent.
The ECB has indicated it is in no rush to change its ultra-loose monetary policy, despite better economic conditions in the euro-area. However, a major player has long been unhappy about this, and the complaints are getting louder. Germany wants to see a tighter policy out of Brussels, arguing that the current low-interest environment is hurting savers and is ill-fitted to Germany’s strong economy. On Tuesday, German finance minister Wolfgang Schaeuble called on the ECB to change its policy in a “timely manner”. For its part, the cautious ECB has argued that it must keep its asset -purchase program and low interest rates in place while inflation remains at low levels. However, with Germany facing elections in September, the pressure on the ECB to tighten policy will only increase, especially if economic indicators continue to points upwards.
The US released key consumer indicators on Thursday, and the readings disappointed the markets, as CPI and retail sales reports missed estimates. CPI declined 0.1%, short of the estimate of 0.2%. This was the second decline in three months, as inflation is currently at 1.5%, well below the Federal Reserve’s target of 2.0%. Retail Sales, the primary gauge of consumer spending was dismal, coming in at -0.3%, compared to a forecast of +0.1%. This marked the indicator’s weakest reading since August 2016. Weak retail sales is clearly an area of concern – the soft reading could drag down GDP for the second quarter, as as consumer spending accounts for more than two-thirds of economic growth. Although surveys continue to show that US consumers remain optimistic about the economy, this hasn’t translated into stronger consumer spending.
The markets had priced in a rate hike at close to 100%, and the Federal Reserve complied, as it hiked rates on Thursday by 25 basis points, to a target range of 1.00 percent to 1.25 percent. The rate statement was more hawkish than expected, as policymakers portrayed an optimistic picture, noting that the economy was growing and the labor market remained strong. As for inflation, which remains stubbornly low, the statement acknowledged that inflation remained below the Fed’s target of 2.0%, but expected that goal to be reached in the “medium term”. The Fed projected one more rate hike in 2017, and the markets are circling the December meeting as the most likely date. The odds for a September hike are at 18%, down from 23% a week ago, according to the CME Group. As for a December increase, the odds are currently at 38%. One surprising development was that Fed Chair Janet Yellen outlined a plan to reduce its $4.2 trillion balance sheet (comprised of Treasury bonds and mortgage-backed securities). Yellen was short on specifics, saying that the goal was to begin the normalization “relatively soon”. The balance sheet ballooned after the financial crisis in 2008, as the Fed implemented a massive quantitative easing program as part of its accommodative monetary policy, together with interest rates of zero. The gradual reduction in the purchase of these assets signifies an important vote of confidence in the strength of the US economy.
Daily Technical Analysis: GBP/USD Rectangle Range Prior To The MPC Policy Decision
The BOE ( Bank Of England ) will decide today about their interest rates and the event should provide huge volatility in the GBP currency basket. The BOE's MPC meeting minutes provides the result of the interest rate vote for each MPC member during the most recent meeting.
The GBP/USD is currently trapped in a rectangle range and the breakaway gap hasn't been closed yet. During my yesterday's live trading webinar the GBP was very volatile but eventually dropped and turned trade into the profit. However, today the movement might be two fold, that's why we should pay attention to potential breakouts. If the pair spikes above 1.2825 next resistance is 1.2845 and if it proceeds above we might see 1.2930-40. The bottom of the gap is very close to W H4 so the gap might be closed. On the contrary, if the pair drops below 1.2634 next target could be 1.2550.
(BOE) Bank Rate Held at 0.25%, Government Bond Purchases at £435bn and Corporate Bond Purchases at up to £10bn
The Bank of England's Monetary Policy Committee (MPC) sets monetary policy to meet the 2% inflation target, and in a way that helps to sustain growth and employment. At its meeting ending on 14 June 2017, the MPC voted by a majority of 5-3 to maintain Bank Rate at 0.25%. The Committee voted unanimously to maintain the stock of sterling non-financial investment-grade corporate bond purchases, financed by the issuance of central bank reserves, at £10 billion. The Committee also voted unanimously to maintain the stock of UK government bond purchases, financed by the issuance of central bank reserves, at £435 billion.
The MPC set out its most recent assessment of the outlook for inflation and activity in the May Inflation Report. That assessment depended importantly on three main judgements: that the lower level of sterling continues to boost consumer prices broadly as projected, and without adverse consequences for inflation expectations further ahead; that regular pay growth remains modest in the near term but picks up significantly over the forecast period; and that more subdued household spending growth is largely balanced by a pickup in other components of demand.
CPI inflation has been pushed above the 2% target by the impact of last year's sterling depreciation. It reached 2.9% in May, above the MPC's expectation. Inflation could rise above 3% by the autumn, and is likely to remain above the target for an extended period as sterling's depreciation continues to feed through into the prices of consumer goods and services. The 2½% fall in the exchange rate since the May Inflation Report, if sustained, will add to that imported inflationary impetus.
In contrast, pay growth has moderated further from already subdued rates, even as the unemployment rate has fallen to 4.6%, its lowest in over 40 years.
GDP growth declined markedly in the first quarter, in part reflecting weaker household spending. It remains to be seen how large and persistent this slowdown in consumption will prove. In recent months, there have been further signs of a slowing housing market and new car registrations have fallen sharply. Consumer confidence has remained relatively resilient, however, and employment has continued to rise. Outside the household sector, export indicators have strengthened, probably reflecting both the depreciation of sterling and increasingly robust global demand. Most surveys of investment intentions have remained above their historic averages. Surveys of general business activity suggest a modest recovery in GDP growth in the second quarter.
Monetary policy cannot prevent either the necessary real adjustment as the United Kingdom moves towards its new international trading arrangements or the weaker real income growth that is likely to accompany that adjustment over the next few years. Attempting to offset fully the effect of weaker sterling on inflation would be achievable only at the cost of higher unemployment and, in all likelihood, even weaker income growth. For this reason, the MPC's remit specifies that, in such exceptional circumstances, the Committee must balance any trade-off between the speed at which it intends to return inflation sustainably to the target and the support that monetary policy provides to jobs and activity.
The projections that the Committee published in May showed that the economy was expected to operate with a small degree of spare capacity for most of the three-year forecast period, justifying the tolerance of some degree of above-target inflation. The continued growth of employment could suggest that spare capacity is being eroded, lessening the trade-off that the MPC is required to balance and, all else equal, reducing the MPC's tolerance of above-target inflation. Looking ahead, key considerations in judging the appropriate stance of monetary policy are the evolution of inflationary pressures, the persistence of weaker consumption and the degree to which it is offset by other components of demand.
In light of these considerations, five members thought that the current policy stance remained appropriate to balance the demands of the MPC's remit. Three members considered it appropriate to increase Bank Rate by 25 basis points. All members agreed that any increases in Bank Rate would be expected to be at a gradual pace and to a limited extent. The Committee will continue to monitor closely the incoming evidence, and stands ready to respond to changes in the economic outlook as they unfold to ensure a sustainable return of inflation to the 2% target.