Sample Category Title
GBP/USD Candlesticks and Ichimoku Analysis
Weekly
• Last Candlesticks pattern: Long white candlestick
• Time of formation: 16 Jan 2017
• Trend bias: Down
Daily
• Last Candlesticks pattern: Long white candlestick
• Time of formation: 18 Apr 2017
• Trend bias: Near term up
GBP/USD – 1.3003
Although cable has rebounded after finding support at 1.2769 late last week and consolidation with initial upside bias is seen for recovery to 1.2970-80, reckon 1.3000 would limit upside and price should falter below recent high at 1.3048, bring another retreat later. Below 1.2830 would bring test of said support at 1.2769, break there would signal a temporary top has been formed, bring retracement of recent upmove to the upper Kumo (now at 1.2703) and possibly towards 1.2650, having said that, reckon downside would be limited and previous resistance at 1.2616 would turn into support and contain downside, bring rebound later.
On the upside, whilst initial recovery to 1.2975-85 cannot be ruled out, reckon resistance at 1.3015 would hold from here, bring another retreat later. Only a daily close above said resistance at 1.3015 would signal retreat from 1.3048 has ended, bring retest of this level later. Once this recent high at 1.3048 is penetrated, this would signal the upmove from 1.1986 low (Jan low) has resumed for retracement of early downtrend, hence further gain to 1.3050-60, then 1.3100 would be seen, however, loss of near term upward momentum should prevent sharp move beyond 1.3140-50 (38.2% Fibonacci retracement of 1.5018-1.1986) and reckon 1.3200 would hold.
Recommendation: Stand aside for this week.

On the weekly chart, although cable has rebounded after finding support at 1.2769, break of 1.3015 resistance is needed to signal pullback from 1.3048 has ended, bring retest of this level, once this recent high is penetrated, this would signal the erratic upmove from 1.1986 low (2017 low) has resumed, bring retracement of early decline to 1.3090-00, then towards 1.3140-50 (38.2% Fibonacci retracement of 1.5018-1.1986) but price should falter well below 1.3200-10, risk from there is seen for a retreat to take place later.
On the downside, expect pullback to be limited to 1.2830-40 and bring another rebound. Below 1.2830 would bring test of 1.2769 support, break there would bring correction to the Tenkan-Sen (now at 1.2707), however, downside should be limited to 1.2665-70 and bring another rise. Only below previous resistance at 1.2616 would abort and signal top is formed instead, bring weakness to 1.2550-60, however, still reckon downside would be limited and previous support at 1.2515 should remain intact.

USD/CHF Candlesticks and Ichimoku Analysis
Weekly
• Last Candlesticks pattern: Shooting star
• Time of formation: 7 Mar 2017
• Trend bias: Sideways
Daily
• Last Candlesticks pattern: Morning star
• Time of formation: 9 May 2017
• Trend bias: Near term up
USD/CHF – 0.9643
The greenback has fallen again after meeting renewed selling interest at 0.9808 late last month, adding credence to our bearish view that early decline from 1.0344 top (2016 high) is still in progress and downside bias remains for further fall to 0.9600, then towards support at 0.9550, however, near term oversold condition should prevent sharp fall below latter level and price should stay above psychological level at 0.9500, risk from there has increased for a rebound later.
On the upside, whilst initial recovery to the Tenkan-Sen (now at 0.9715), then 0.9755-60 is likely, reckon upside would be limited to said resistance at 0.9808, bring another decline. A daily close above 0.9859-61 (previous support now resistance and current level of the Kijun-Sen) would defer and suggest a temporary low is formed, bring a stronger rebound to the lower Kumo (now at 0.9966) but price should falter below 1.0000 and bring another selloff.
Recommendation: Sell at 0.9805 for 0.9605 with stop above 0.9905

On the weekly chart, as the greenback has remained under pressure after forming another black candlestick last week, adding credence to our bearish view that early erratic fall from 1.0344 top is still in progress, hence bearishness remains for this move to bring retracement of early upmove to 0.9600, then towards previous support at 0.9550, however, reckon downside would be limited to 0.9500 and another previous support at 0.9444 should remain intact, risk from there has increased for a strong rebound later.
On the upside, although initial recovery to 0.9750-60 cannot be ruled out, reckon said resistance at 0.9808 would limit upside and bring another decline. A weekly close above the Tenkan-Sen (now at 0.9866) would defer and risk a stronger rebound to 0.9940-50 but 1.0007 (previous resistance) should limit upside and price should falter well below 1.0100, bring another selloff later. Above 1.0100 would signal low is formed instead and suggest the aforesaid decline from 1.0344 has ended, bring test of 1.0171 resistance next.

Trade Idea : USD/CHF – Sell at 0.9685
USD/CHF - 0.9641
Most recent candlesticks pattern : N/A
Trend : Near term down
Tenkan-Sen level : 0.9641
Kijun-Sen level : 0.9646
Ichimoku cloud top : 0.9671
Ichimoku cloud bottom : 0.9654
Original strategy :
Sell at 0.9685, Target: 0.9585, Stop: 0.9720
Position : -
Target : -
Stop : -
New strategy :
Sell at 0.9685, Target: 0.9585, Stop: 0.9720
Position : -
Target : -
Stop : -
As the greenback has remained under pressure after Friday’s selloff, bearishness remains for recent decline to resume after consolidation, below support at 0.9622 would extend weakness to 0.9600-05 (50% projection of 1.0100-0.9692 measuring from 0.9808) but oversold condition should limit downside to 0.9570 and price should stay above support at 0.9550, risk from there has increased for a rebound to take place later.
In view of this, we are looking to sell dollar on recovery as 0.9685-90 should limit upside. Only break of resistance at 0.9720 would abort and signal a temporary low is formed instead, bring a stronger rebound to 0.9750 and then 0.9770 but price should falter below resistance at 0.9808.

Trade Idea : GBP/USD – Stand aside
GBP/USD - 1.2928
Most recent candlesticks pattern : N/A
Trend : Near term down
Tenkan-Sen level : 1.2927
Kijun-Sen level : 1.2906
Ichimoku cloud top : 1.2873
Ichimoku cloud bottom : 1.2872
New strategy :
Stand aside
Position : -
Target : -
Stop : -
Although sterling has edged higher again in part due to cross-buying in pound and gain to 1.2950-55 and possibly towards 1.2970 cannot be ruled out, as broad outlook remains consolidative, reckon upside would be limited to 1.3000 and near term overbought condition would cap price below indicated previous resistance at 1.3015, bring retreat later.
In view of this, would not chase this rise here and would be prudent to stand aside for now. Below 1.2890-95 would bring test of 1.2845-50 but break of latter level is needed to signal top is formed, bring test of 1.2830 support, once this level is penetrated, this would signal the rebound from 1.2769 has ended, bring further fall to 1.2800, however, said support at 1.2769 should remain intact.

Trade Idea : EUR/USD – Hold long entered at 1.1205
EUR/USD - 1.1248
Most recent candlesticks pattern : N/A
Trend : Up
Tenkan-Sen level : 1.1260
Kijun-Sen level : 1.1257
Ichimoku cloud top : 1.1259
Ichimoku cloud bottom : 1.1244
Original strategy :
Bought at 1.1205, Target: 1.1305, Stop: 1.1235
Position : - Long at 1.1205
Target : - 1.1305
Stop : - 1.1235
New strategy :
Hold long entered at 1.1205, Target: 1.1305, Stop: 1.1235
Position : - Long at 1.1205
Target : - 1.1305
Stop : - 1.1235
As the single currency has retreated again after faltering below resistance at 1.1285 in part due to cross-selling against yen, suggesting further consolidation below this level would be seen, however, as long as 1.1235-40 holds, mild upside bias remains for recent upmove to resume after consolidation, above said resistance at 1.1285 would extend rise to another previous chart resistance at 1.1300, break there would encourage for headway to 1.1340-45 but overbought condition should limit upside to chart point at 1.1366.
In view of this, we are holding on to our long position entered at 1.1205. Only below support at 1.1202 would abort and signal top is formed instead, risk weakness towards indicated support at 1.1164, once this level is penetrated, this would signal recent upmove has ended, bring further fall to 1.1130-40 first.

Trade Idea : USD/JPY – Sell at 110.20
USD/JPY - 109.66
Most recent candlesticks pattern : N/A
Trend : Down
Tenkan-Sen level : 110.02
Kijun-Sen level : 110.13
Ichimoku cloud top : 111.01
Ichimoku cloud bottom : 110.77
Original strategy :
Sell at 111.00, Target: 110.00, Stop: 111.35
Position : -
Target : -
Stop : -
New strategy :
Sell at 110.20, Target: 109.20, Stop: 110.55
Position : -
Target : -
Stop : -
As the greenback met renewed selling interest at 110.73 yesterday and decline has accelerated after breaking below indicated support at 110.24, confirming our bearish view that recent decline from 114.37 top is still in progress and bearishness remains for further weakness to 109.30-35 (100% projection of 111.71-110.31 measuring from 110.73), then towards 109.00-05 (1.236 times projection) but near term oversold condition should limit downside to 108.70-75, bring rebound later.
In view of this, would not chase this fall here and would be prudent to sell dollar on recovery as previous support at 110.24 should turn into resistance and limit dollar’s upside, bring another decline. Above 110.50 would defer but only break of said resistance at 110.73 would signal low is formed instead.

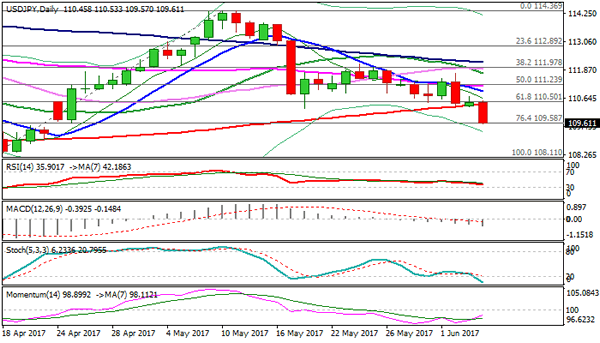
Technical Outlook: USDJPY Falls Below Daily Cloud On Growing Risk-Off Sentiment
The US dollar fell against Japanese yen to the lowest levels in nearly six weeks on strong risk aversion sentiment, fuelled by escalating geopolitical tension in the Middle East.
The pair eventually took out 200SMA support (110.34) which held downside attempts on Fri/Mon and broke below daily cloud base (110.15) and psychological 110.00 support during Asian session. Fresh extension lower was seen at the beginning of European trading that hit target at 109.58 (Fibo 76.4% of 108.11/114.36 rally. Bears are looking to fill the gap from 24 Apr for extension towards key short-term support at 108.11 (17 Apr low).
Daily studies turned into full bearish setup and support scenario, however, strongly oversold slow stochastic warns of correction.
Broken daily cloud base and 200SMA now act as solid resistances which should ideally cap corrective rallies.
Res: 110.00, 110.36, 110.53, 110.76
Sup: 109.48, 108.87, 108.32, 108.11
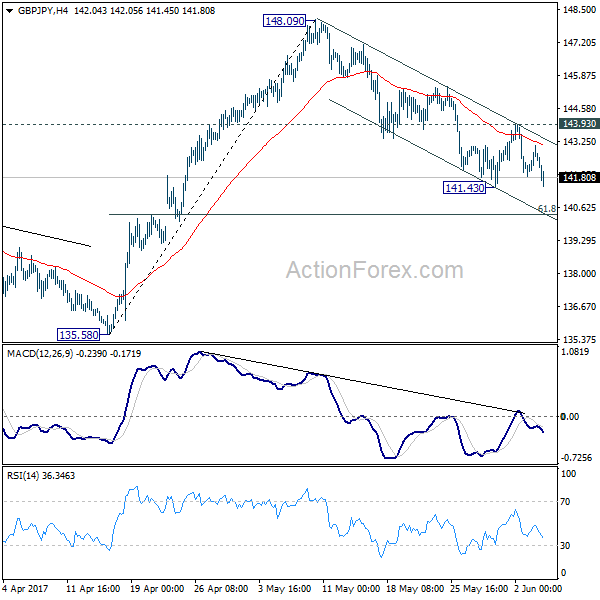
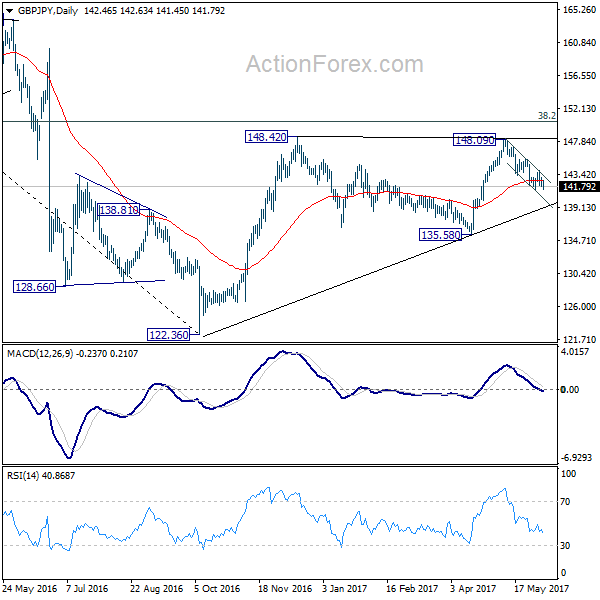
GBP/JPY Daily Outlook
Daily Pivots: (S1) 141.89; (P) 142.49; (R1) 143.13; More....
GBP/JPY is still staying above 141.43 temporary low and intraday bias remains neutral first. On the downside, break of 141.43 will extend the decline from 148.09. In such case, intraday bias is turned to the downside for 61.8% retracement of 135.58 to 148.09 at 140.35. At this point, we'd still expect rebound from 122.36 to resume later. Hence, we'd look for strong support below 140.35 to contain downside and bring rebound. On the upside, break of 143.93 will turn bias back to the upside for 148.09 resistance.
In the bigger picture, rise from 122.36 medium term bottom is still expected to extend to of 195.86 to 122.36 at 150.42. And decisive break there could pave the way to 61.8% retracement at 167.78. However, as the cross is starting to lose upside momentum, rejection below 150.42 and break of 135.58 support will indicate reversal and bring deeper fall back to retest 122.36 instead.
Currencies: Dollar Continues To Struggle, USD/JPY Slips Below The 110 Barrier
Sunrise Market Commentary
- Rates: Sideways ahead of big events on Thursday?
The eco calendar lacks impetus for trading today and tomorrow, suggesting investors will be side-lined ahead of Thursday's big events (ECB meeting, UK election, Comey hearing). The developing crisis in the Gulf region is a wildcard which could influence bond markets via equity markets or oil prices. - Currencies: Dollar continues to struggle; USD/JPY slips below the 110 barrier
Friday's poor US payrolls report kept the dollar in the defensive. This morning, USD/JPY fell below the psychological barrier of 110. FX traders are looking forward that Thursday's multiple event-risk with the UK election, ECB meeting and the hearing of former FBI director Comey. Risk aversion might be negative for USD/JPY, but more neutral for EUR/USD.
The Sunrise Headlines
- US equities traded near opening levels during yesterday's trading session and eventually closed slightly lower. Overnight, Asian stock markets are mixed with Japan underperforming (-0.5%) on a stronger yen.
- Saudi Arabia blamed the tiny Persian Gulf emirate of Qatar for “financing, adopting and sheltering extremists”. Egypt, the UAE, Yemen and Bahrain joined Saudi Arabia in breaking diplomatic and some commercial ties with Qatar
- Industries making up the bulk of the US economy continued to expand at a solid pace in May, adding to signs of steady growth this quarter. The May non-manufacturing ISM printed at 56.9 (vs 57.1 consensus), down from 57.5.
- Australia's central bank kept its policy rate at 1.5% amid growing concerns on the eco outlook. Conditions on the housing market still vary considerably, but there were signs the brisk rises in some markets were “starting to ease.”
- IMF Lagarde has offered a way out of the impasse over Athens' debts that would allow the EMU to release the next aid tranche. She suggested agreeing a deal whereby the IMF would stay on board in the bailout, as Berlin wants, but not pay out further aid until debt relief measures are clarified.
- President Trump will meet with House and Senate leadership today to plot a path forward on health care and tax reform—two of the administration's top legislative priorities that have been stalled in recent months.
- Today's eco calendar is very thin with only EMU retail sales and bond auctions in Austria and Germany (inflation-linked).
Currencies: Dollar Continues To Struggle, USD/JPY Slips Below The 110 Barrier
Dollar struggles; USD/JPY drops below 110 barrier
Trading was mostly technical in nature yesterday. EMU and US eco data had only a limited impact on FX trading. EUR/USD failed to extend its payrolls' gains. The pair even fell prey to modest intraday profit taking in thin trading. EUR/USD closed the session at 1.1254. USD/JPY hovered in a tight range near the post-payrolls lows as equities traded with a cautious negative bias. There was no additional negative fall-out on USD/JPY though. The pair closed the day at 110.45, almost unchanged from Friday.
Overnight, Asian stock markets trade cautiously negative with Japan underperforming. USD/JPY dropped below the post-payrolls lows, triggering additional yen buying. The pair fell below the psychological barrier of 110 to currently trade in the 109.70 area. USD/JPY's decline also weighs slightly on the dollar against the euro. The pair returned to the 1.1275 area, but for now the recent top stays out of reach. The decline of EUR/JPY is helping to cap further gains. The Reserve Bank of Australia as expected left its policy rate unchanged. The Aussie dollar lost temporary ground in lockstep with USD/JPY's decline overnight, but rebounded after the RBA decision. The RBA didn't profoundly change its assessment on the economy.
The eco calendar is almost empty today. Global factors and upcoming event risk will set the tone for FX trading. Markets will especially look forward to Thursday, with the UK Parliamentary elections, the ECB policy meeting and the testimony of former FBI director James Comey to a Senate committee. Political or other event risk mostly only had a temporary impact on global trading recently. This might again be the case this time, but some investor caution is likely until the uncertainty is out of the way. We expect USD/JPY to remain in the defensive short-term. The picture for EUR/USD might be a bit different. The ECB might make some amendments on its forwards guidance and could remove the downside risks to the economy outlook. As such this could be a precursor for more important action in September. Looking at the recent euro rally, a modestly positive change in the ECB's assessment is probably already discounted. This might cap further EUR/USD gains. Some ST squaring of positions/profit taking is possible. A cautious risk-off sentiment and the decline of EUR/JPY makes further EUR/USD gains less easy. We keep a neutral bias on EUR/USD and don't preposition for further gains
Technical picture
The USD/JPY rally ran into resistance in early May. A mini sell-off pushed the pair below the previous top (112.20), making the short-term picture negative. At the end of last week, there were tentative signs that the decline could slow. However, the post-payrolls decline and this morning's break below 110 are making the picture again outright negative. Return action lower in the 108.13/114.37 range remains possible.
Earlier May, EUR/USD failed to break below the 1.0821/1.0778 support (gap). Poor US data and political upheaval propelled EUR/USD north of the 1.1023 range top. The pair initially reached a short-term correction top at 1.1268. There was a minor break after Friday's disappointing US payrolls, but for now there are no follow-through gains. The Trump top/correction top at 1.1300/1.1366 is next resistance. USD sentiment will have to be quite negative to clear this hurdle short-term. For now, we don't preposition for a sustained break of this area. A return below 1.1023 would indicate that the upside momentum has eased.
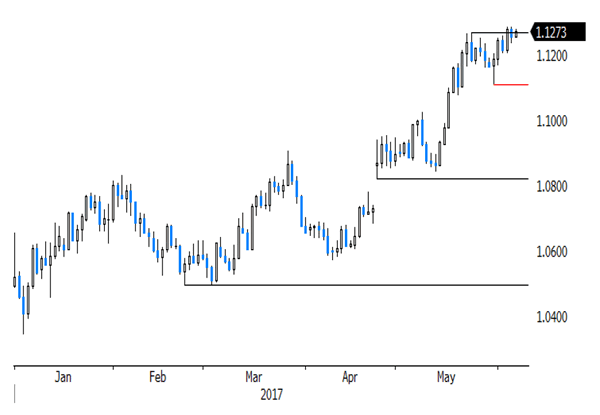
EUR/USD holding near the post-payrolls top, but no follow-through gains
EUR/GBP
Sterling decline to slow ahead of the election?
Yesterday morning, sterling trade went into the defensive after the terrorist attack in London. However, the losses were modest and sterling soon returned to levels last seen at the end of the previous week. The UK services PMI declined more than expected from 55.8 to 53.8, but the report was largely ignored as an important factor for sterling trading. Quite the reverse, in technical trade, the UK currency even regained ground gradually later in the session. EUR/GBP closed the session at 0.8721. Cable finished the day at 1.2904.
Overnight, the BRC like-for-like sales declined slightly more than expected (-0.4% Y/Y), but we didn't see any lasting impact on sterling trading. There are no other important eco data in the UK today. Markets will try to get some insight on the potential impact of the terrorist attack on the outcome of Thursday's election. The lead of the conservative party is declining, but they are still in pole position. We don't expect a sustained rebound of sterling, but some profit taking of sterling shorts going into the final stage of the election is possible. So, a break of EUR/GBP beyond the recent top might become more difficult. First resistance comes in the 0.8774/88 area. EUR/GBP 0.8655 is a first minor support. A sustained return below the EUR/GBP 0.86 alert would suggest that the worst is over for sterling
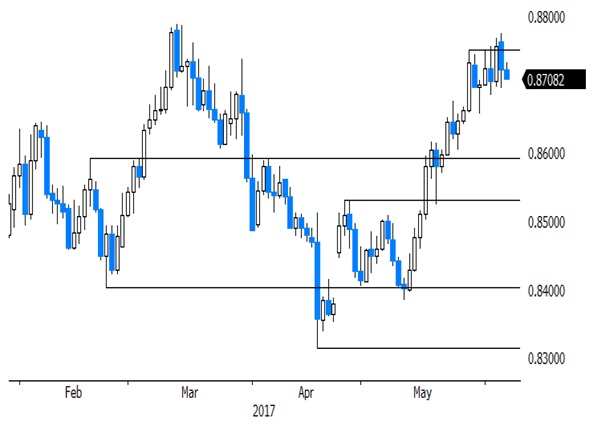
EUR/GBP: most of the bad news for sterling discounted?
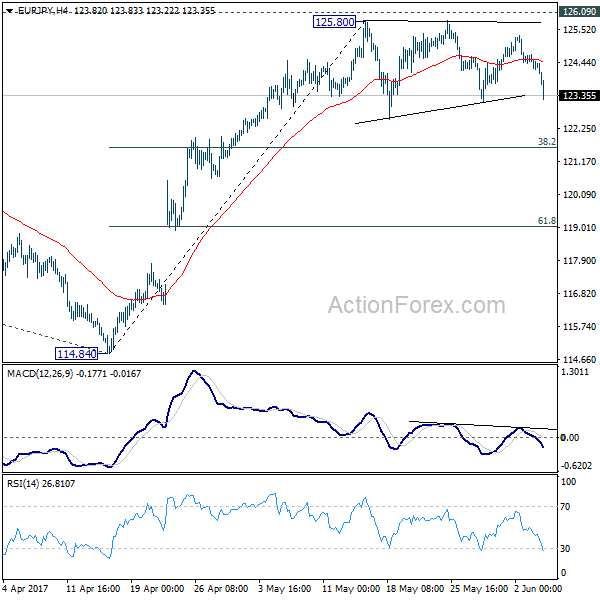
EUR/JPY Daily Outlook
Daily Pivots: (S1) 124.11; (P) 124.40; (R1) 124.62; More...
EUR/JPY drops sharply today but still, price actions from 125.80 are seen as a corrective pattern. In case of deeper fall, downside should be contained by 38.2% retracement of 114.84 to 125.80 at 121.61 to bring rise resumption. We're staying mildly bullish in the cross. And, break of 126.09 key resistance will extend the whole rebound from 109.03 to 100% projection of 109.03 to 124.08 from 114.84 at 129.89. Nonetheless, firm break of 121.61 will dampen our bullish view and bring deeper fall to 61.8% retracement at 119.02.
In the bigger picture, focus is staying on 126.09 support turned resistance. Decisive break there will confirm completion of the down trend from 149.76. And in such case, rise from 109.20 is at the same degree and should target 141.04 resistance and above. Meanwhile, rejection from 126.09 and break of 114.84 will extend the fall from 149.76 through 109.20 low.