
Sample Category Title
What’s On The Cards For The Kiwi Dollar Moving Forward?
Key Points:
- We could be approaching a near-term peak for the NZD.
- The technical bias is suggesting that a reversal is warranted.
- Losses likely to be capped at the 0.7053 handle.
The Kiwi Dollar may need to moderate slightlyin the coming days as a number of technical signals are beginning to cast doubt on hopes of extending gains significantly in the near-term. Nevertheless, we may not have reached our reversal point just yet which could mean that we still have a small degree of ground left to be claimed – especially if the impending GDT Price Index comes in above targets.
Firstly, if we look at the daily chart, it is becoming apparent that the pair is beginning to encounter some rather stiff resistance which could, eventually, result in a reversal for the NZD. In particular, the presence of a historical point of inflection and the upside of the regression channel are working against the bulls – likely meaning gains will be capped by the 0.7163 handle. However, we obviously haven't quite hit this price just yet which could mean we don't see a correction begin for a couple of sessions.
Regardless, any further gains will bring the NZD into conflict with the 0.7163 handle which could spell the end of the recent uptrend. Subsequently, the pair should move into retreat, at least until the stochastics and RSI have moved out of overbought territory. However, this would almost definitely invert the Parabolic SAR reading to bullish which could see a sizable tranche of losses begin. Despite this, our current bias is that the Kiwi Dollar sinks to the 0.7053 handle and no further, largely due to the 100 day EMA providing dynamic support around this price.
As for the fundamental side of things, the release of the GDT Price Index this week should work in concert with the technical forecast. On the one hand, if we see a yet another increase in the figure, upsides will be present but not too aggressive as a positive outcome has largely been priced in. On the other hand, if a negative print is seen, it will simply kick start the downtrend that has been described above. This being said, don't expect to see the pair go into free fall as the index is still at its highest point since mid-2014.
Ultimately, despite some residual buying pressure, the outlook for the NZD is rather bearish. As mentioned, the presence of that resistance level around the 0.7163 handle could prove to be a near-term high for the pair and a downtrend could begin once it has been tested properly. Nevertheless, not all is doom and gloom as there is a decent chance that losses are capped at 0.7053 which leaves the pair in possession of most of the gains made over the past month.
Elliott Wave View: EURJPY Bounce Expected
Short Term EURJPY Elliott Wave view suggests the rally from 4/16 low is unfolding as a double three Elliott Wave structure. Up from 4/16 (114.8) low, Intermediate wave (W) ended at 125.81 and Intermediate wave (X) is proposed complete at 122.53. A break above 125.81 however is still needed to add conviction that the next leg higher has started.
From 122.53 low, the rally is also unfolding as a double three Elliott Wave structure. Minute wave ((w)) ended at 125.8 and Minute wave ((x)) ended is proposed complete at 123.11. Rally from there is unfolding as a double three where Minutte wave (w) ended at 125.31 and Minutte wave (x) pullback has reached 100% in 3 swing from 6/2 high. Thus while pair stays above 123.11, and more importantly above 122.53, expect pair to extend higher or at least bounce in 3 waves. If pair breaks below 123.11, then pair is likely doing a double correction from 5/16 peak. This suggests pair can open extension lower to 121.6 – 122.25 area in case of a double correction. From this area, buyers should appear again for an extension higher or at least a 3 waves bounce.
EURJPY 1 Hour Elliott Wave Chart
(RBA) Statement by Philip Lowe, Governor: Monetary Policy Decision
At its meeting today, the Board decided to leave the cash rate unchanged at 1.50 per cent.
The broad-based pick-up in the global economy is continuing. Labour markets have tightened further in many countries and forecasts for global growth have been revised up since last year. Above-trend growth is expected in a number of advanced economies, although uncertainties remain. In China, growth is being supported by increased spending on infrastructure and property construction, with the high level of debt continuing to present a medium-term risk. Commodity prices are generally higher than they were a year ago, providing a boost to Australia's national income. The prices of iron ore and coal, however, have declined over recent months as expected, unwinding some of the earlier increases.
Headline inflation rates in most countries have moved higher over the past year, partly reflecting the higher commodity prices. Core inflation remains low, as do long-term bond yields. Further increases in US interest rates are expected over the year ahead and there is no longer an expectation of additional monetary easing in other major economies. Financial markets have been functioning effectively.
Domestically, the transition to lower levels of mining investment following the mining investment boom is almost complete. Business conditions have improved and capacity utilisation has increased. Business investment has picked up in those parts of the country not directly affected by the decline in mining investment. Year-ended GDP growth is expected to have slowed in the March quarter, reflecting the quarter-to-quarter variation in the growth figures. Looking forward, economic growth is still expected to increase gradually over the next couple of years to a little above 3 per cent.
Indicators of the labour market remain mixed. Employment growth has been stronger over recent months, although growth in total hours worked remains weak. The various forward-looking indicators point to continued growth in employment over the period ahead. Wage growth remains low and this is likely to continue for a while yet. Inflation is expected to increase gradually as the economy strengthens. Slow growth in real wages is restraining growth in household consumption.
The outlook continues to be supported by the low level of interest rates. The depreciation of the exchange rate since 2013 has also assisted the economy in its transition following the mining investment boom. An appreciating exchange rate would complicate this adjustment.
Conditions in the housing market vary considerably around the country. Prices have been rising briskly in some markets, although there are some signs that these conditions are starting to ease. In other markets, prices are declining. In the eastern capital cities, a considerable additional supply of apartments is scheduled to come on stream over the next couple of years. Rent increases are the slowest for two decades. Growth in housing debt has outpaced the slow growth in household incomes. The recent supervisory measures should help address the risks associated with high and rising levels of indebtedness. Lenders have also announced increases in mortgage rates, particularly those paid by investors and on interest-only loans.
Taking account of the available information, the Board judged that holding the stance of monetary policy unchanged at this meeting would be consistent with sustainable growth in the economy and achieving the inflation target over time.
Daily Technical Outlook And Review: EUR/USD, GBP/USD, AUD/USD, USD/JPY, USD/CAD, USD/CHF, DOW 30, GOLD
A note on lower timeframe confirming price action...
Waiting for lower timeframe confirmation is our main tool to confirm strength within higher timeframe zones, and has really been the key to our trading success. It takes a little time to understand the subtle nuances, however, as each trade is never the same, but once you master the rhythm so to speak, you will be saved from countless unnecessary losing trades. The following is a list of what we look for:
- A break/retest of supply or demand dependent on which way you're trading.
- A trendline break/retest.
- Buying/selling tails ... essentially we look for a cluster of very obvious spikes off of lower timeframe support and resistance levels within the higher timeframe zone.
- Candlestick patterns. We tend to only stick with pin bars and engulfing bars as these have proven to be the most effective.
We typically search for lower-timeframe confirmation between the M15 and H1 timeframes, since most of our higher-timeframe areas begin with the H4. Stops are usually placed 1-3 pips beyond confirming structures.
EUR/USD
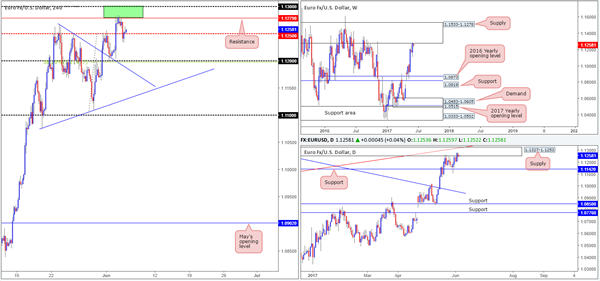
For those who read Monday’s report you may recall our team highlighting the 1.13/1.1279 H4 area as a potential sell zone (round number/H4 resistance). Additionally, we also liked the fact that the H4 zone formed within both weekly and daily supplies (1.1533-1.1278/1.1327-1.1253). As anticipated, H4 price sold off from the above said zone and briefly slipped below the mid-level support at 1.1250. Well done to any of our readers who took this trade as the first take-profit zone, also highlighted on Monday, was set at 1.1250.
Although H4 price is trading back above 1.1250, pressure from the higher-timeframe supplies will likely be too great for the bulls here. We’re expecting at least the 1.12 handle to be achieved.
Our suggestions: Unfortunately our team missed the sell from 1.13/1.1279. All may not be lost though. Should the unit retest this zone today and print a reasonably sized H4 bearish candle from here, preferably a full-bodied candle, we would again look to short, targeting 1.1250 as an initial zone. The reason for needing this additional confluence is, apart from this being a second retest, mainly because we feel price may look to challenge 1.30 and possibly whipsaw above it before serious sellers step in.
Data points to consider: No high-impacting news on the docket today.
Levels to watch/live orders:
- Buys: Flat (stop loss: N/A).
- Sells: 1.13/1.1279 ([waiting for a reasonably sized H4 bear candle – preferably a full-bodied candle – to form before pulling the trigger is advised] stop loss: ideally beyond the candle’s wick).
GBP/USD
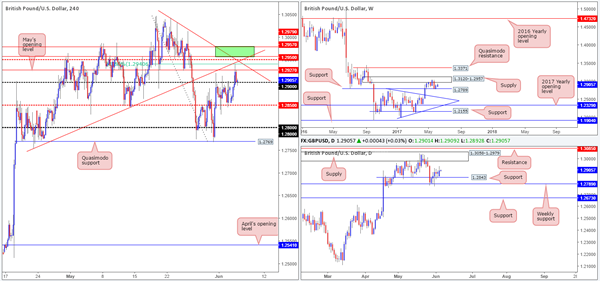
Despite the somewhat bearish start to the week, the bulls were in relatively fine form during yesterday’s sessions. The pair ran through offers at 1.29, whipsawed above May’s opening level at 1.2927 and challenged the H4 61.8% Fib resistance at 1.2941 (converged with a H4 trendline resistance taken from the low 1.2754), before showing any signs of weakness. The pullback from this Fib level has brought price back down to 1.29, which, as you can see, is holding firm as support for the time being.
Based on recent movement, the area we actually have our eye on at the moment, assuming 1.29 continues to hold steady, is 1.2957/1.2979. This green area seen on the H4 chart represents the underside of weekly and daily supplies, and also sits just above the H4 mid-level resistance at 1.2950.
Our suggestions: Although our team has expressed interest at 1.2957/1.2979, they’ve noted that to trade this zone, a reasonably sized H4 bearish candle would also need to form from here, preferably a full-bodied candle. This is simply because there’s a large psychological number 1.30 lurking just above, which has ‘trade me’ written all over it.
Data points to consider: No high-impacting news on the docket today.
Levels to watch/live orders:
- Buys: Flat (stop loss: N/A).
- Sells: 1.2957/1.2979 ([waiting for a reasonably sized H4 bear candle – preferably a full-bodied candle – to form before pulling the trigger is advised] stop loss: ideally beyond the candle’s wick).
AUD/USD
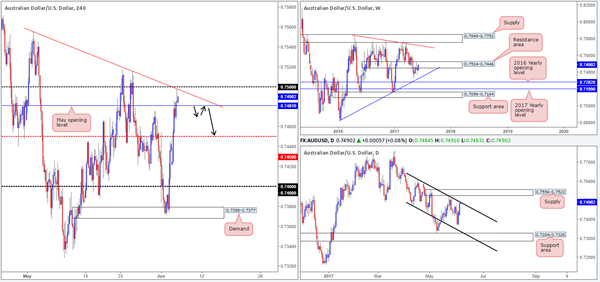
On Monday we saw the Aussie bulls go on the offensive for a second consecutive day, despite weekly price being housed within the walls of a resistance area logged at 0.7524-0.7446. What’s also notable from a technical perspective is that daily price is now seen shaking hands with a channel resistance taken from the high 0.7610.
Given the higher-timeframe resistances in play right now and the fact that 0.75 is lurking just ahead on the H4 chart, it would, in our humble opinion, be chancy to initiate any long positions at the moment. In regards to selling, however, we’d need to see the bears prove themselves as worthy contenders before we show interest.
Our suggestions: To confirm bearish strength, a H4 close back below May’s opening level at 0.7481 would be ideal. This would also clear the runway south down to at least the H4 mid-level support at 0.7450, and quite possibly beyond. Therefore, taking a short on the break/retest of 0.7481 would (as per the black arrows) be something we’d be interested in.
Data points to consider: RBA rate statement at 5.30am GMT+1.
Levels to watch/live orders:
- Buys: Flat (stop loss: N/A).
- Sells: Watch for H4 price to engulf 0.7481 and then look to trade any retest seen thereafter ([waiting for a lower-timeframe confirming sell signal following the retest is advised – see the top of this report] stop loss: dependent on where one confirms this level.
USD/JPY
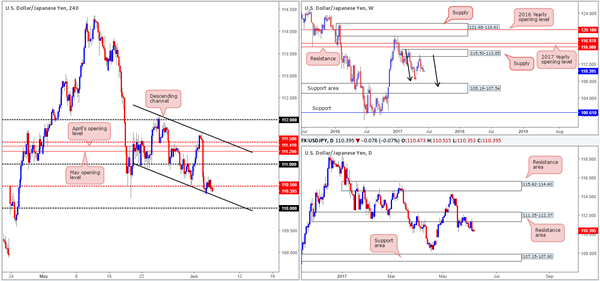
H4 bulls were seen struggling to register any noteworthy movement from the channel support taken from the low 110.92 during yesterday’s trading. The reason we believe this be the case is simply due to the higher-timeframe structures. Weekly bears remain in a relatively strong position after pushing aggressively lower from supply registered at 115.50-113.85. We know there’s a lot of ground to cover here, but this move could possibly result in further downside taking shape in the form of a weekly AB=CD correction (see black arrows) that terminates within a weekly support area marked at 105.19-107.54 (stretches all the way back to early 2014). In conjunction with weekly flow, daily price continues to defend the resistance area penciled in at 111.35-112.37, which could see price drive lower in the coming week to 107.15-107.90: a support zone that’s glued to the top edge of the said weekly support area.
Our suggestions: With the above notes in mind, our desk will be looking for shorts in this market. Should the current H4 candle close as is, we would be very tempted to short. In the event that this comes to fruition, stops would be tucked above 110.50, and we’d initially be targeting the 110 handle as a first take-profit zone.
Data points to consider: No high-impacting news on the docket today.
Levels to watch/live orders:
- Buys: Flat (stop loss: N/A).
- Sells: 110.50 region ([waiting for the current H4 candle to close before making a decision as to where a short is viable or not] stop loss: 110.55).
USD/CAD
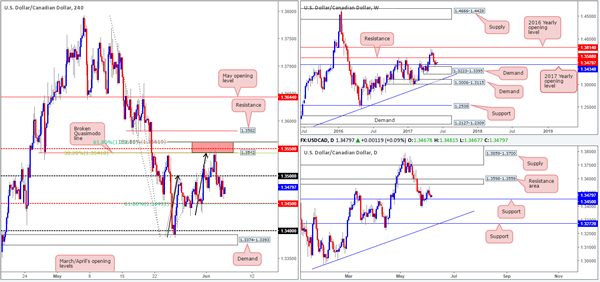
The 1.35 handle, as you can see, managed to hold firm as resistance yesterday. The next downside target from this angle sits at the H4 mid-level support drawn from 1.3450, which also represents a daily support and unites with a 61.8% H4 Fib support line taken from the low 1.3387. Given that this level is also positioned nearby the 2017 yearly opening level at 1.3434 seen on the weekly chart, we will be looking for price to bounce higher from this region today.
Our suggestions: While a bounce from 1.3434/1.3450 is high probability, we’d still recommend waiting for the lower timeframes to prove buyer interest exists here (see the top of this report). This will help avoid an unnecessary loss on a potential fake down to the 1.34 hurdle.
Data points to consider: No high-impacting news on the docket today.
Levels to watch/live orders:
- Buys: 1.3450 region ([waiting for a lower-timeframe buy signal to print is advisable] stop loss: dependent on where one confirms this line).
- Sells: Flat (Stop loss: N/A).
USD/CHF
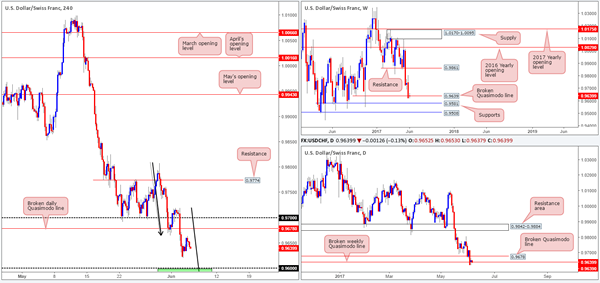
Kicking this morning’s report off with a look at the weekly timeframe, we can see price trading around 0.9639: a recently broken Quasimodo line. The next downside target beyond this line is seen around a support level drawn from 0.9581. Down on the daily chart, however, the unit shows the break below the above said weekly Quasimodo line could have potentially cleared the path south all the way down to 0.9546: a daily triple-bottom formation. Should price reach this line, nevertheless, we’d be wary of taking a long from here since a daily Quasimodo support level is seen lurking just below at 0.9488.
On the H4 chart, the candles are seen lurking 40 pips ahead of the 0.96 handle. 0.96, in our opinion, still deserves attention! Not only is it positioned nearby the weekly support mentioned above at 0.9581, it also sits close to a H4 AB=CD (see black arrows) 161.8% bullish completion point at 0.9572.
Our suggestions: Wait for H4 price to attack 0.9572/0.96 and watch to see if the H4 candles can print a reasonably sized H4 bull candle, preferably a full-bodied candle, before pushing the buy button. This, of course, will by no means guarantee a winning trade, but it will help determine buyer interest and help avoid an unnecessary loss! The first take-profit target from this base will be set around the broken daily Quasimodo line at 0.9678.
Data points to consider: No high-impacting news on the docket today.
Levels to watch/live orders:
- Buys: 0.9572/0.96 ([waiting for a reasonably sized H4 bull candle – preferably a full-bodied candle – to form before pulling the trigger is advised] stop loss: ideally beyond the candle’s tail).
- Sells: Flat (stop loss: N/A).
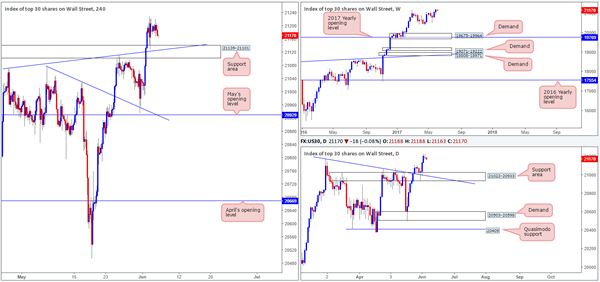
DOW 30
US equity prices are unchanged this morning, despite the index ranging 54 points. With this, much of the following report will echo thoughts put forward from yesterday’s analysis…
Over the course of last week’s trading, US equities punched to fresh record highs at 21229. The move came after a three-month consolidation, which achieved an ultimate low of 20371 back in mid-April. The story on the daily chart shows that the unit extended Wednesday’s bounce further on Friday from the support area pegged at 21022-20933, which, as we already know, achieved fresh all-time highs.
For those who read Friday’s report you may remember we mentioned to keep an eye on the H4 support area at 21139-21101 (intersects with a H4 trendline support etched from the high 21072) for a potential bounce north. As you can see, this played out perfectly! Well done to any of our readers who managed to jump in long on this one! With the market showing little resistance up ahead, we believe the DOW will likely continue to push higher in the coming week.
Our suggestions: Based on recent trading, we’re still interested in trading long from the said H4 support area. However, for this happen, we’d need to see price retest the support area for a second time and hold firm. It would be absolutely fantastic to see a bullish H4 candle present itself from here in the shape of a full-bodied candle, as we’d have little hesitation in jumping in long from this base!
Data points to consider: No high-impacting news on the docket today.
Levels to watch/live orders:
- Buys: 21139-21101 ([waiting for a reasonably sized H4 bull candle to form – preferably a full-bodied candle – is advised] stop loss: ideally beyond the candle’s tail).
- Sells: Flat (stop loss: N/A).
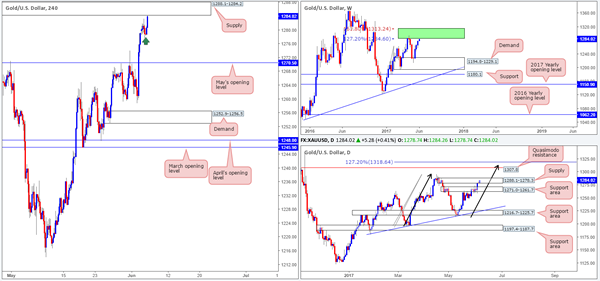
GOLD
Despite daily price printing a bearish pin bar around the underside of a daily supply zone pegged at 1288.1-1278.3 during yesterday’s segment, the bulls have continued to press higher in recent hours. What’s interesting about this daily zone is that it’s glued to the underside of an area comprised of two weekly Fibonacci extensions 161.8/127.2% at 1313.7/1285.2 taken from the low 1188.1 (green zone).
The recent advance has, as you can see on the H4 chart, led to price challenging the H4 supply zone seen at 1288.1-1284.2. As mentioned in Monday’s report, this H4 supply area is attractive since it is located within the upper limits of the daily supply and also positioned within the lower limits of the green weekly zone. Therefore, we believe it will, at the very least, bounce price lower.
Our suggestions: Our team is now short from 1284.0 with a stop planted at 1288.9. Ultimately, we’re going to be looking to reduce risk to breakeven around the nearby H4 demand marked with a green arrow at 1278ish. From thereon, we’d have our eye on May’s opening level at 1270.5, which happens to be positioned within a daily support area at 1271.0-1261.7 (the next downside target on the daily timeframe).
Levels to watch/live orders:
- Buys: Flat (stop loss: N/A).
- Sells: 1284.0 ([live] stop loss: 1288.9).
European Open Briefing: The Dollar Is Under Renewed Pressure
Global Markets:
- Asian stock markets: Nikkei down 0.75 %, Shanghai Composite lost 0.05 %, Hang Seng gained 0.30 %, ASX 200 declined 0.90 %
- Commodities: Gold at $1286 (+0.30 %), Silver at $17.55 (-0.20 %), WTI Oil at $47.06 (-0.70 %), Brent Oil at $49.10 (-0.70 %)
- Rates: US 10-year yield at 2.17, UK 10-year yield at 1.05, German 10-year yield at 0.29
News & Data
- Australia Current Account 3.1bln vs 0.1bln expected
- Australia Net Exports Contribution -0.7 % vs -0.4 % expected
- New Zealand ANZ Commodity Price Index m/m 3.2 % vs -0.2 % previous
- Japan Average Cash Earnings y/y 0.5 % vs 0.3 % expected
- UK BRC Retail Sales Monitor y/y -0.4 % vs -0.5 % expected
- Asian stocks stumble, oil creeps up as markets ponder fallout of Mideast tension – RTRS
- U.S. services, factory data point to moderate economic growth – RTRS
- Oil resumes slide on worries Middle East rift could sap drive to cut output – RTRS
Markets Update:
The Dollar is under renewed pressure. The risk-off sentiment in markets has pushed USD/JPY below 110. A daily close below that level would be quite bearish and signal a move towards 108 in the near-term.
Meanwhile, EUR/USD is likely to test 1.13 soon. The currency remains very well bid, but a major rally seems unlikely ahead of the ECB meeting on Thursday. Traders will likely wait for the new projections from the central bank, as well as the comments from ECB President Draghi. There have been speculations that the ECB will soon signal a turn in their monetary policy.
GBP/USD rose to 1.2925 overnight. The broad USD weakness pushed the pair higher, despite the uncertainty that remains around the UK election. Volatility is likely to increase ahead of the Thursday vote.
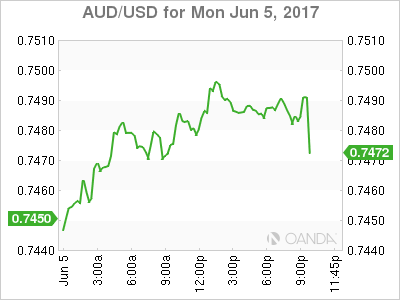
AUD/USD has been quiet overnight, as traders are waiting for the RBA rate decision. Rates are very likely to remain unchanged, but traders are looking forward to any changes in the RBA statement and hints about the future monetary policy.
Upcoming Events:
- 10:00 BST – Euro Zone Retail Sales
- 15:00 BST – US JOLTs Job Openings
- 15:00 BST – Canadian Ivey PMI
Market Morning Briefing: Dollar Index Continues Its Decline Towards The Major Support
STOCKS
Dow (21184.04, -0.10%) is almost on the verge of breaking the horizontal resistance near 21200. In case the resistance holds, we could see a fall back towards 21000 else a rise towards 21400 is possible in the near term.
Dax (12822.94, +1.25%) rose with a gap up and managed to close at higher levels, making a new high of 12878 yesterday. The index could be headed towards 13000 in the coming sessions.
Shanghai (3090.68, -0.03%) is also trading below the immediate resistance on the daily charts and could test 3050 before again bouncing back towards 3070 or higher.
Nikkei (20026.45, -0.72%) came off on fresh fall in Dollar Yen to levels below 110. Also the trendline resistance on the daily charts has held well. While the resistance holds, some more dip in the near term is possible. Else, we need a break above the current resistance to turn more bullish for the near term.
Nifty (9675.10, +0.22%) is slowly inching higher towards 9700-9800 and looks bullish for the near term. We could possibly see attest of 9700 this week if the index continues to rise at this pace.
COMMODITIES
We are doubtful about the sustainability of Gold (1284) at these levels. Maximum upside we are looking at is 1300 but if Gold could not hold its ground above 1275 then it could fall towards its crucial support of 1245-49, which could be a level where the price action has to be checked to assess the future trend. A failure to hold 1245-49 could keep the price range-bound in the 1220-1250 regions; otherwise we may see a fresh upward rally from 1245-50 levels, which could take the price beyond 1350 regions.
Similar kind of trading pattern has been seen in Silver (17.58) also. The recent trading range could be 16.90-17.60, and the chances of a minor correction can’t be fully ruled out due to the overbought condition.
Copper (2.55) is trading within the range of 2.35-2.65. The present bias is on a weaker side thus a close below 2.55 levels could open up 2.40-35 levels, which might be the maximum downside of this particular move. Only above 2.65, higher resistances of 2.80 can come into consideration.
Brent (49.15) and WTI (47.10) have been consolidating in the range of 48.50-50.20 and 45.80-47.42 respectively. As discussed previously, it remains bearish below the medium term channel resistance near 54.50 (Brent) and 51.50 (WTI) and the chances of a decline to 47 (Brent) and 44 (WTI) remains open but it could be prudent to be prepared for a sudden turnaround to the upside in the very short term time frame due to their oversold condition.
FOREX
Dollar Index (96.60) continues its decline towards the major support area of 96.50-25 ahead of the ex-FBI chief Comey’s testimony due Thursday, 8th June. As discussed yesterday, it remains to be seen if the major support of 96.50-25 is able to arrest the decline or else 95 or even lower levels may come into consideration.
Euro (1.1272) has resumed its rally after a pause day as it gets closer not only our target of 1.1300 but also to the huge resistance cluster in the band of 1.1300-1.1450 while its condition is highly overbought. Caution warranted.
Contrary to expectations, the support of 110.00 for Dollar Yen (109.83) has given way and now the lower levels of 109.20 and 108.00 may be tested. The downtrend remains strong till the resistance of 112.00 is overcome.
Pound (1.2917) has strengthened a bit but remains firmly inside the range of 1.2750-1.3000 ahead of the UK election on Thursday, 8th June. Repeat - if the result threatens the current ruling party, then a decline towards 1.2650-00 can be expected but we prefer to wait for the actual result before taking a firm stance.
Aussie (0.7466) has been rejected by the resistance of 0.7500 as expected and now the impact of the RBA decision coming in a few minutes may decide the near term path.
Dollar Rupee (64.36) ended the day slightly lower but the lack of volatility kept the intraday range very narrow. We expect the range of 64.30-70 to continue till the RBI meet conclusion tomorrow.
INTEREST RATES
The US yields have bounced back as expected. The 5YR (1.73%), 10Yr (2.17%) and the 30Yr (2.83%) are all stable. The US 10-5Yr differential (0.44%) has come down as expected and could test support just below current levels before bouncing back towards 0.45%.
The UK-US (-1.13%) is trading below immediate channel resistance and could come off in the near term, limiting the upside for Pound just now.
The Japan-US 10Yr yield spread (2.12%) could bounce back in the near term towards 2.15-2.20%.
USDJPY – Vulnerable, Retains Downside Pressure
USDJPY - The pair faces further downside pressure in the short term though seen hesitating during early Monday trading. On the downside, support comes in at the 110.00 level where a break if seen will aim at the 109.50 level. A cut through here will turn focus to the 109.00 level and possibly lower towards the 108.50 level. On the upside, resistance resides at the 111.00 level. Further out, we envisage a possible move towards the 111.50 level. Further out, resistance resides at the 112.00 level with a turn above here aiming at the 112.50 level. On the whole, USDJPY looks vulnerable to the downside.
USD/CAD Canadian Dollar Slightly Higher On Soft US Data
The Canadian dollar appreciated on Wednesday despite the Arab nations breaking away from Qatar. The middle east nation is accused of supporting known terrorist groups. Qatar is also a US ally, and hosts the US military central command in the region which puts the US in a compromising position as Saudi Arabia is also an ally of the US. Secretary of State Rex Tillerson has said that America will intervene if needed to defuse the situation. Oil prices were in for a rollercoaster ride as Qatari exports are the world leader in liquified natural gas.
The loonie is almost flat as the ups and downs have almost cancelled each other out. Mixed data in the US and the ongoing investigation into Russia and the Trump administration will heat up with the testimony of former FBI Director James Comey this week.
Canadian real estate appears to be finally cooling down as prices in Toronto grew in May but only 14.9 percent year over year and new listings jumped 48.9 percent with 20 percent less sales. There are still many unaccounted factors such as resisting that could skew the numbers, but at this point it looks like Toronto prices are going to fall, but without any major fundamental change such a hike in Canadian interest rates it could prove temporary as Vancouver suffered a similar fall but is now showing signs of a rebound.
Mexico and the United States reached a deal to settle their sugar dispute on Monday. The agreement comes before Canada, Mexico and the US renegotiate NAFTA. The sugar deal ends a dispute before tariffs were put in place and any retaliation that could make the upcoming renegotiation talks even more challenging. In related NAFTA news, the US Agriculture Secretary is asking Canada to eliminate a new dairy-pricing class that according to Americans undercuts sales by the US. The Trump Administration has already started the process that will give it the power to hold talks with NAFTA members as early as August, with an uncertain outcome that could reshape the dynamic between North American nations.
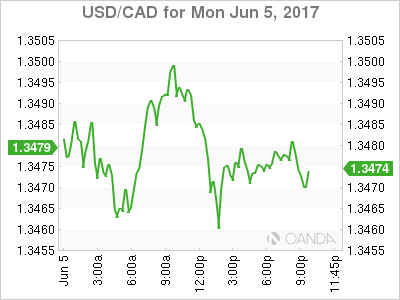
The USD/CAD lost 0.075 percent on Monday. The currency pair is trading at 1.3474 after a volatile start of the week. Oil prices have moved in a 3 percent range since the news about the souring relationships with a host of Arab nations and Qatar. The drop in oil prices kept the loonie under pressure as it close in on the 1.35 price level, only to recover with the underwhelming release of the ISM non-manufacturing PMI data in the United States.
The lower than expected US jobs report on Friday was not enough to derail the expectation of a U.S. Federal Reserve June rate hike, but a series of mixed economic data in the US has put big question marks on when or if there will be a third US benchmark rate raise in 2017.
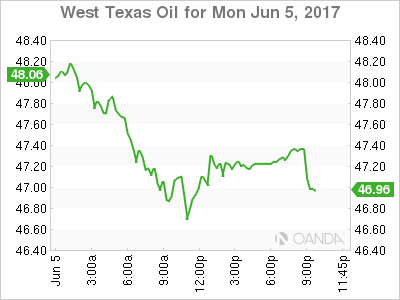
Oil is down 0.577 percent in the last 24 hours. The price of West Texas Intermediate is trading at $47.24 after the political dispute in the Middle East. Saudi Arabia, Egypt, Bahrain, the United Arab Emirates, Libya, and Yemen have severed their relations with Qatar. The group is saying that its a move motivated by national security and to fight terrorism and extremism. Qatar is one of the largest suppliers of natural gas which had far reaching impacts as one of the biggest movers when the news hit was the Australian dollar as Japan and other Asian nations will look to others to fulfill their energy needs. The Aussie climbed 0.58 percent versus the USD.
The price of oil has enjoyed a period of stability following the freefall as supply of crude created a glut while demand remains slow. The Organization of the Petroleum Exporting Countries (OPEC) reached a production cut agreement last year and has now extended that deal into 2018. The situation in Qatar could threaten to break the united front of energy producers. The last time there was political infighting it was in all places during the Doha summit to discuss the original production freeze. The deal was dead on arrival as Iran was not going to participate and Saudi Arabia prefer to end the talks. It remains to be seen which side does Iran aligns itself with, although it would be hard to visualize an allegiance with Saudi Arabia over Qatar. The US crude inventories numbers to be released on Wednesday will bring some raw data for traders to better price in this current development.
US shale production keeps increasing as prices have been in current ranges that make drilling profitable. New technologies are in the horizon that could take US supply even higher and put more pressure on the OPEC and other major producers such as Russia.
Market events to watch this week:
Tuesday, Jun 6
12:30am AUD Cash Rate
9:30pm AUD GDP q/q
Wednesday, Jun 7
10:30am USD Crude Oil Inventories
9:30pm AUD Trade Balance
Tentative CNY Trade Balance
Thursday, Jun 8
All Day GBP Parliamentary Elections
7:45am EUR Minimum Bid Rate
8:30am EUR ECB Press Conference
8:30am USD Unemployment Claims
Friday, Jun 9
4:30am GBP Manufacturing Production m/m
8:30am CAD Employment Change
8:30am CAD Unemployment Rate
AUD Lost In The Shuffle
All the focus is on the UK election and Comey's testimony this week, but news out of Australia has the potential to steal the show. AUD was the top performer Monday benefiting from Qatari gas isolation following its neighbours' blockade. The RBA decision is up next. The Premium video below is contains the current and future positioning for major instruments ahead of the week's key events.
2017 hasn't gone according to plan for many central banks but the RBA might be the most astray. They forecast 2.5% growth this year and 3.3% in 2018. It's part of the longest unbroken streak of developed single-country growth in the modern era.
At the start of the year there were few skeptics, but suddenly there are worries. Some economists a small contraction in Q1 and the consensus is for just +0.3% growth. If the number is positive, it will largely be due to climbing inventories.
The sudden slowdown is likely to be temporary but it won't be brushed aside by the RBA. Policymakers meet today and are fully expected to leave rates unchanged at 1.50%. But the market is increasingly expecting a rate cut by year end. The implied probability has risen to 20%, doubling from a month ago.
That rise was in large part responsible for the Australian dollar's recent struggles. Now, the RBA has an opportunity to validate it. The decision is at 0430 GMT. The May 2 statement was entirely neutral and Lowe said then that forecasts for the Australian dollar were little changed. Complicating his message is that Q1 GDP is due a day later. The RBA is likely to get some insight on what's coming but won't want to be seen as hinting at the results. For traders, a dovish statement and a weak print could set up a quick fall in the Aussie.
Pound Moves Higher Despite Soft UK Services PMI
The British pound has started the week with moderate gains. In Monday's North American session, GBP/USD is trading at 1.2920. On the release front, British Services PMI was a disappointment, dropping to 53.8 in May. This missed the estimate of 55.1 points. In the US, ISM Non-Manufacturing PMI pointed to a slowdown in the services sector, dropping to 56.9 points. This was shy of the estimate of 57.1 points. Later in the day, the UK releases BRC Retail Sales.
The terrorist attack on London Bridge has badly shaken the UK, and the timing couldn't be worse for Prime Minister Theresa May. Just a few weeks ago, May appeared destined to increasing her majority, and the election was little more than a formality. However, two major terrorist attacks in Manchester and London have turned the political landscape upside down, and May's comfortable lead in the polls has largely evaporated just three days before the vote on Thursday. The latest YouGov poll predicts that May's Conservatives will fall just short of a majority. If this happens, May will have a much more difficult job negotiating Britain's departure from the European Union, and the pound could drop sharply. Meanwhile, the economy appears to be slowing down, and the opposition parties will be hoping to gain seats at May's expense, appealing to an electorate which is greatly concerned about the economy as well as the deteriorating security situation. Traders should be prepared for volatility from the pound this week.
The Federal Reserve holds its policy meeting on June 14, and the odds of a quarter-point increase continue to climb. According to the CME Group, the odds of a hike have climbed to 96%, up from 88% just a week ago. The markets have priced in a June move, and a dismal Nonfarm Payroll report has failed to put a dent in market confidence in a June rate hike. Traders should note that ahead of the March hike, the odds of a rate hike were also close to 100%, and the dollar actually lost ground after the Fed followed through with a quarter-point increase. An increase in interest rates represents a vote of confidence in the US economy, but the Fed continues to have some concerns. Inflation remains stubbornly low, despite a labor market that remains close to capacity. Fed policy makers are also scratching their heads over soft consumer spending, which has not kept pace with high levels of consumer confidence. As for additional rate hikes in the second half of 2017, the markets are skeptical, with the odds of a September rate hike at just 26%.