Sample Category Title
Weekly Economic and Financial Commentary
U.S. Review
Economic Data Point Toward a Stronger Q2
- The May nonfarm payroll report showed an additional 138,000 jobs added to the U.S. labor market with the unemployment rate declining to 4.3 percent.
- Personal income and spending data for April showed consumer spending to be off to a much better start in Q2.
- ISM's manufacturing index remained roughly unchanged in May at 54.9 from April's 54.8 reading. The more forward-looking new orders component climbed higher.
- The trade deficit widened in April to $47.6 billion from March's $45.3 billion deficit.
Economic Data Point Toward a Stronger Q2
Economic data this week continued to support the case for a stronger pace of GDP growth in the second quarter. Real consumer spending rose 0.2 percent in April as income gains continued. May was another decent month for job gains, with the labor market adding 138,000 jobs and the unemployment rate falling to 4.3 percent. The Institute for Supply Management's (ISM) manufacturing index remained roughly unchanged from its May reading but is up relative to the same time last year. A wider trade deficit to start Q2 indicated that trade is likely to subtract from Q2 GDP growth, after adding 0.1 percentage points in Q1.
May's nonfarm payroll report showed that 138,000 jobs were added for the month, while the unemployment rate remained low at 4.3 percent. Among the industries adding the most jobs for the month were, professional services, education & health and leisure & hospitality. The unemployment rate dipped to 4.3 percent as the labor force participation rate fell to 62.7 percent, nearly unchanged from the 62.6 percent reading one year ago. Average hourly earnings rose 0.2 percent, resulting in a 2.5 percent gain on a year-over-year basis. In our view, the continued gain in average hourly earnings supports our forecast for two more rate hikes this year (June and September) and the announcement of balance sheet normalization in December.
Other consumer sector indicators also continued to support the case for stronger consumer spending in the second quarter. Nominal personal income rose 0.4 percent, while nominal spending rose 0.4 percent in April. In assessing the purchasing power of consumers we tend to focus 0n real disposable income, which controls for inflation and taxes, and which rose 0.2 percent. Real consumer spending in April rose 0.2 percent, taking the three-month moving average to 1.1 percent compared to just 0.6 percent in March. Consumer confidence dipped slightly in May, but, on trend, continues to edge higher. The continued improvement in income, employment and to a lesser extent consumer confidence suggests that there is more momentum behind consumer spending in the second quarter.
On the manufacturing front, the ISM's manufacturing survey indicated that sentiment remained positive within the sector but with little change in the index in May. The new orders component and employment component were up on the month. We continue to expect the manufacturing sector to slowly improve this year as somewhat stronger global demand and an expected increase in domestic business investment should help to support greater manufacturing growth.
The trade deficit widened in April to $47.6 billion from March's $45.3 billion deficit. Exports fell 0.3 percent while imports rose 0.8 percent for the month. We expect the wider trade deficit to subtract from overall GDP growth in the second quarter as domestic demand will continue to boost import growth, while only modest global demand will slow the pace of export growth.
U.S. Outlook
ISM Non-Manufacturing • Monday
The ISM non-manufacturing index bounced back in April, mostly recouping March's 2.4-point decline. At a level of 57.5, the index indicates that economic activity outside of the manufacturing sector is expanding at a decent clip. Both production and new orders leaped higher in April, which reinforces our expectation for economic growth to rebound in the second quarter. Notably, the new orders index rose a solid 4.3 points to 63.2, marking a fresh cycle high. Input price pressures also showed renewed strength in April, rising 4.1 points to 57.6.
Employment was the only major component that did not improve in April, slipping 0.2 points to 51.4. The employment index still signals expansion, but at a slower pace. This is consistent with our forecast for a more modest pace of job growth in the second half of 2017 as the labor market continues to tighten.
Previous: 57.5 Wells Fargo: 56.7
Consensus: 57.0
Factory Orders • Monday
Reports from the factory sector have been mixed. Manufacturing payrolls reported a healthy gain in April, adding 11,000 jobs on the month, and the ISM manufacturing index continues to signal expansion. However, the advanced durable goods orders estimate showed a 0.7 percent decline in April. Shipments of nondefense capital goods orders, ex-aircraft, or core capital goods, slipped 0.1 percent in April and the initially reported gain for March was revised to a scant increase of just 0.2 percent. The March factory orders report showed a 0.5 percent increase in core capital goods orders, but the advanced durable goods report revised away that gain. Core capital goods orders have now flat-lined for two months in a row. This is somewhat disconcerting and may suggest that the long overdue rebound in the factory sector is delayed, yet again. Given the weaker durable goods report, we look for factory orders to decline a modest 0.1 percent in April.
Previous: 0.2% Wells Fargo: -0.1%
Consensus: -0.2% (Month-over-Month)
JOLTS • Tuesday
Job openings rose slightly in March, ending the month at 5.7 million openings. At the industry level, professional & business services openings saw a solid increase of 126,000, while mining & logging shed 8,000 following some recent gains. Involuntary separations continue to remain low as employers appear to be making a solid effort to hold onto their workers in an increasingly tight labor market.
The quit rate held steady at 2.1 percent in March, which is in line with its average over the past year. While this marks a meaningful pickup from earlier in the cycle, the pace of improvement in the quit rate has slowed. A rise in quits would bode well for an increase in wage growth later this year. Average hourly earnings have disappointingly failed to accelerate, despite the low level of unemployment and survey reports of labor shortages.
Previous: 5.7 million
Global Review
Strong Real GDP Growth in Canada and Brazil in Q1
- Real GDP in Canada grew at an annualized rate of 3.7 percent in the first quarter due to robust growth in domestic demand. Real GDP growth in Brazil turned positive for the first time in more than two years, leading to optimism that Latin America's largest economy may finally be exiting its deep downturn.
- The Japanese economy grew at a solid clip in the first quarter, and more recent data indicate that momentum is still positive thus far in Q2. However, inflation in Japan remains uncomfortably low.
Canadian Economy Grew Strongly in Q1
Data released this week showed that real GDP in Canada grew at an annualized rate of 3.7 percent in the first quarter (see chart on front page). Despite the impressive headline figure, the outturn was actually a bit weaker than the consensus forecast. That said, there was very little that was actually "weak" about the data. Real consumer spending jumped 4.3 percent, while investment spending jumped 10.0 percent. The overall rate of GDP growth was held back by the 13.7 percent surge in real imports.
At its policy meeting last week, the Bank of Canada (BoC) did not seem to be in any hurry to follow the Fed by hiking rates. The BoC noted that the adjustment of the Canadian economy to lower oil prices is "largely complete," a claim that seems to be validated by the recent acceleration in economic activity. However, policymakers also believe there is still excess capacity in the economy because wage growth is "still subdued" and measures of consumer price inflation are benign (top chart). Accordingly, we believe the BoC will refrain from hiking rates in 2017.
Is Brazil Finally Exiting Recession?
Brazil also posted a strong growth rate in the first quarter as real GDP grew 4.3 percent at an annualized rate relative to the previous quarter (middle chart). The outturn was notable because it was the first time that real GDP growth has been positive on a sequential basis in more than two years. Despite the positive results in the first quarter, the Brazilian economy remains very weak. Real GDP remains nearly 8 percent below its peak in early 2014, and growth in Q1 was driven entirely by exports. (Consumer, business and government spending all contracted in the first quarter.) That said, recoveries often start in the external sector, and the contractions in domestic spending are generally becoming less deep. In our view, real GDP in Brazil will continue to expand in coming quarters, although the recent political uncertainty that has been introduced by the scandal surrounding President Temer represents a downside risk to our near-term forecast. In general, a return to the supercharged economic growth rates in Brazil that went hand-in-hand with the era of elevated commodity prices, which have subsequently collapsed, is not in the cards anytime soon.
Japanese Economy Starts Q2 on a Strong Note
Data released last month showed that real GDP in Japan grew at an annualized rate of 2.2 percent on a sequential basis in the first quarter, and more recent data indicate that economic momentum remains positive thus far in the second quarter. For example, industrial production (IP) in Japan jumped 4.0 percent in April relative to the previous month, more than reversing the 1.9 percent contraction that occurred in March. Retail sales rose 1.4 percent in April to bring the year-over-year growth rate in retail spending to 3.2 percent, the strongest rate in nearly two years. However, inflationary pressures remain benign with the overall rate of CPI inflation clocking in at only 0.4 percent in April. Consequently, the Bank of Japan likely will maintain its Quantitative and Qualitative Easing (QQE) program for the foreseeable future.
Global Outlook
Australian GDP • Tuesday
On Tuesday of next week, Australia will release data for Q1 GDP. In Q4 2016, Australian GDP growth bounced back, expanding at an annualized pace of 4.4 percent. Both consumer and business spending contributed to the increase with a smaller boost from net exports. The consensus forecast looks for positive growth to continue in Q1, albeit at not quite the same pace.
After firming in the second half of 2016, the Reserve Bank of Australia's commodity index has turned down more recently falling 3.4 percent between February and April. We are, however, encouraged by the improvement in job prospects for Australia and after back-to-back monthly declines in retail sales earlier this year, the better jobs figures could provide a needed lift to consumer spending. Business spending has been a drag on growth nine out of the past 11 quarters in Australia, but as business confidence climbs, this trend may turn.
Previous: 1.1%
Consensus: 0.5% (Quarter-over-Quarter)
China Trade • Wednesday
China is set to release trade figures for the month of May this upcoming Wednesday. Both imports and exports have surged recently, rising 11.9 percent and 8.0 percent in April from a year-ago, respectively. The recent resurgence of trade values has reversed the slowing growth trend that has characterized Chinese trade since 2010. The recent revival in imports and exports is perhaps a signal that global demand is firming—a notion that is confirmed by global export figures as well.
Chinese GDP grew 6.9 percent in Q1 2017 with notable growth in the secondary industry, which includes mining/quarrying, manufacturing, construction and utilities production. Much of these sectors are integral to the export industry. China's manufacturing PMI remains in expansionary territory, another signal that Chinese exports may have room to run.
Previous: Imports: 11.9%; Exports: 8.0% (Year-over-Year)
Consensus: Imports: 9.0%; Exports: 7.0%
ECB Meeting • Thursday
The European Central Bank (ECB) holds a regularly scheduled policy meeting on Thursday, and it is unlikely that the Governing Council will change its three main policy rates.
In our view, the ECB will continue to buy €60 billion worth of bonds each month for the next few months. However, our expectation is that at some point this summer, the Governing Council could announce plans to "taper" its bond purchases further if the economic outlooks remains upbeat and/or inflation continues to trend higher. Against the backdrop of the Federal Reserve, which is expected to hike rates two more times this year, and the ECB, which is likely to remain on hold, our currency strategy team looks for the euro to depreciate modestly against the dollar in coming months.
Previous: 0.00% Wells Fargo: 0.00%
Consensus: 0.00% (Refi Rate)
Point of View
Interest Rate Watch
Politics, The Fed and Foreign Capital
No one factor drives Treasury yields, as has been amply demonstrated in recent months (top graph) by the influence of expectations for the economy, politics, the Fed and foreign investors.
Politics and the Fed
During Q4 2016, Treasury yields rose as expectations for expansionary economic policy increased, as did the anticipation of a FOMC increase in the funds rate in December. Yet, after the initial jump, rates have moved sideways, although they remain above the levels that existed before the election. The premium attached to economic policy appears to have drifted out of the Treasury market while expectations for further FOMC policy actions remain.
Foreign Interests
Meanwhile, the extent of foreign interest in U.S. fixed income and equity assets has shown some interesting patterns. Since the start of 2015, foreign private purchases of corporate and agency debt have risen and remain higher than their pace of purchases during the 2014 and early 2015 period.
In contrast, the strong interest in U.S. Treasury debt evidenced in early 2015 has diminished dramatically over the past year. One twist is the recovery and now net increase in equity purchases since early 2015. These gains, along with the drop in Treasury purchases, intimate that foreign investors have a little more confidence in U.S. economic growth as well as at least a small residual expectation for stimulative fiscal policy and deregulation.
Commercial Real Estate Recovery
As for real investment, the recovery since early 2015 in foreign interest in real tangible property is significant (bottom graph).
In addition, the distribution of the investments highlights the rising contributions from Canada and China. In both cases, the rise in real estate investment tracks the increase in trade of goods and services over the same period. In addition, the spike in investment at the end of 2015 and continued inflows in 2016 would be consistent with some level of expectations of better economic growth.
Credit Market Insights
Auto Credit Tight as Demand Wanes
Recently released data from the Federal Reserve provide insight into current trends in auto lending. The auto industry is likely coming down from a post-crisis high that peaked in 2016, and lenders are reacting accordingly. According to the Senior Loan Officer Opinion Survey (SLOOS) conducted by the Federal Reserve, more lenders were tightening auto lending standards in April than were easing. At the same time, fewer reported stronger demand for auto loans for the second consecutive quarter. Loan officers had been tightening standards since last July. From the perspective of loan officers, it appears both demand and credit for car loans are drying up.
The Federal Reserve Bank of New York's Quarterly Report on Household Debt and Credit for Q1 2017 shows a slowing trend in auto lending debt growth, but it remains the fastest-growing category. Much of the slowdown can be attributed to declining auto loan origination for consumers with a credit rating lower than 660. Using data provided by Equifax, NY Fed data show an accelerating trend in auto loan origination for consumers with better credit scores.
These data also detail existing auto loan performance. The 90+ day delinquency rate for auto loans has trended up slightly over the past year, increasing 0.3 points to 3.8 percent in Q1 2017. The trend has been very gradual, however, and the rate is quite low relative to student loans (11 percent) and credit cards (7.5 percent).
Topic of the Week
Cell Signal Clouds Inflation Outlook
Inflation has stumbled in recent months after making steady progress over the past year toward the Fed's 2 percent inflation target (top chart). What does this mean for the economic and interest rate outlook?
In some ways, the pause in inflation is due to transitory factors. Key among them was the sharp drop in wireless telephone service prices as a result of cutthroat competition among the major service providers (bottom chart). Prices for used autos have also slumped amid the slowdown in new auto sales that has occurred to start this year. Furthermore, the base effects from low energy prices have begun to wane, limiting the boost to headline inflation from the recovery in oil prices.
Beyond these factors, however, other sectors have also seen a deceleration in prices, suggesting a more broad-based moderation in core inflation. Medical care and shelter inflation, two big components of core inflation and key drivers of overall price increases, have both eased recently. In addition, market-based measures of inflation expectations have continued to slip from their post-election peak, while survey-based measures are languishing at historically low levels.
From a monetary policy perspective, the Fed still seems committed to raising the fed funds rate at its June meeting. The minutes from the May meeting signaled that participants believed the Q1 slowdown in economic growth "reflected transitory factors" while the risks to inflation were "roughly balanced."
In our view, faster economic growth and continued tightening in the labor market should spur a gradual increase in core inflation. This should be enough to support rate hikes in June and September and the beginning of balance sheet normalization come year-end. Still, in the wake of the election, some market participants thought the Fed might shed its slow approach to tightening policy. Thus far, it seems 2017 will be more of the same: two percent growth, gradually rising inflation and a cautious Fed.
The Weekly Bottom Line
HIGHLIGHTS OF THE WEEK
United States
- The U.S. job machine slowed in May (+138k jobs) as the unemployment fell to a sixteen year low of 4.3%. A pullback in the participation rate contributed to the fall in the unemployment rate.
- The Federal Reserve's preferred measure of price growth slowed in April to 1.7% (from 1.9%), while the core measure fell to 1.5% (from 1.6%).
- Weak inflation will probably not forestall a rate hike in June, but continued weakness could be enough to delay further rate hikes. Just as much as job growth, this is an important metric to watch for guidance on future Fed action.
Canada
- Canadian real GDP rose 3.7% annualized in Q1, while nominal GDP rose 8.3%, marking the best threequarter streak in almost seven years.
- The household sector has contributed most to growth, due in large part to a hot housing market. Still, exports appear to be gaining momentum heading into the second quarter of the year.
- Preliminary data showed policy-induced soft market conditions in the GTA and GVA extended into May, bringing the durability of Canada's growth prospects into question.
- Low interest rates will likely continue to support consumption amid a cool down in activity in Canada's largest housing markets, providing upside potential to our 2017 growth forecast. Higher interest rates in 2018 should bring about a cooling in consumption and real estate.
UNITED STATES - THE FED'S CONUNDRUM: LOW UNEMPLOYMENT, SLOW INFLATION
The Federal Reserve has a conundrum. Its dual mandate is for maximum employment and price stability. On the latter, inflation has remained stubbornly below its 2% target. In April, the Fed's preferred core inflation measure slowed to 1.5% from a recent peak of 1.8% in February.
On the former however, it's becoming harder and harder to argue that the American economy is not nearing full employment. In May, the unemployment rate ticked down to 4.3% – its lowest level in sixteen years. Broader measures of unemployment, such as the U6 (which adds marginally attached workers and involuntary part-timers to the tally) also fell to 8.4% - its lowest level in nearly a decade.
In theory, a tightening labor market should be putting upward pressure on inflation. But, as noted by Federal Reserve Governor Brainard in a speech this week, even while the unemployment rate has fallen over five percentage points since the end of the recession, inflation has moved little. Headline consumer price growth has ebbed and flowed with energy prices, but core price measures have maintained a modest rate of change, notably under 2%.
There are a few ways to square this circle. The first, as referenced by Brainard, is that well-anchored inflation expectations have reduced the impact of economic slack on inflation. In economics jargon, the slope of the Phillips curve, may still be negative (inflation rises as unemployment falls), but it has flattened.
A second explanation is that even as unemployment has fallen, so has the theoretical unemployment rate associated with full employment. On this front, the median projection for the long-term unemployment rate among FOMC members has moved consistently downward. Given the recent moves in unemployment and inflation, there is a good chance that it will do so again in June. There is a good argument that an aging population puts downward pressure on the natural rate of unemployment. One can see this dynamic in Japan where the measured unemployment rate is at an all-time low, yet the economy continues to be plagued by deflation.
A third explanation is that the unemployment rate is no longer an accurate measure of labor market slack. While the more inclusive measures have also been falling, the still-limited rebound in core-age participation rates suggests more slack may exist. Alongside a potentially lower natural unemployment rate, this larger "shadow" gap could be diluting the inflationary impact of the tightening labor market.
A fourth explanation is that even while the U.S. labor market is tightening, a consistent and possibly expanding level of global economic slack is keeping downward pressure on inflation. With the Federal Reserve more responsive to domestic than global conditions, rate hikes to-date have put upward pressure on the dollar and helped to import global disinflation into America.
Putting it all together, the improvement in the labor market may provide the impetus for the Federal Reserve to continue to raise interest rates, especially if productivity remains weak and it is satisfied that wage growth is moving higher. Still, it cannot ignore the inflation side of its mandate. Continued underperformance on the inflation front will strengthen the case for patience and likely lead the Federal Reserve to slow the pace of rate hikes.
CANADA - ALL ABOUT THE HOME PRICE
Low oil prices have led to a softening in Canadian economic growth, but they didn't hold it down. National accounts data for the first quarter was released this week, and what a quarter is was. Real GDP grew by 3.7% q/q annualized with the economy now on the best three-quarter growth streak since 2010. Canadian nominal GDP surged 8.3%, building off the strength in real activity and a 14% rise in oil prices, for its best quarterly performance since 2010.
Despite exports still struggling to gain momentum, the economy has benefitted from strength in the household sector, particularly real estate, to drive growth. The combination of real residential investment and spending on housing related items (utilities, furnishing and equipment) rose by almost 11% in the first quarter contributing to about threequarters of economic growth. Consumers have also been spending on just about everything at a healthy rate, supported by a positive wealth impact stemming from a $21,000 appreciation in average home prices over the quarter.
The strong dependence on the household sector throws into question the durability of Canada's economic performance, particularly in light of an ongoing policy-induced adjustment in housing activity in both BC and Ontario. Indeed, the pace of spending is likely to moderate going forward, but the consumer is expected to continue to carry the economy for just a little longer. For one, while the BC housing market adjusted during much of last year, provincial growth still notched up very strong growth of 3.7% last year. This offers some consolation that a cool down in housing won't derail Canada's economic prospects. Even as existing home sales adjust to more normal levels, housing starts are still elevated due to the lagged impact of double-digit home price growth, which is expected to continue to prop construction activity through the remainder of the year.
Meanwhile, low interest rates should continue to help support the consumer. While household debt (5.2% y/y in Q1) continues outpace personal income (+4.1% y/y in Q1) and households are arguably carrying too much debt, the cost of borrowing is still low. Households are paying down their principal at a faster rate than has historically been the case and the interest portion of monthly debt payments hit a new record low in the first quarter of the year, both in absolute terms and as a share of income.
There is some hope on the export front too. This week's export data indicated that real exports rose 0.8% in April atop an already strong 1.3% gain in March, telegraphing a strong start to second quarter net-trade. However, the momentum in exports over the last two months has mainly been an energy story, with more than two-thirds of the yearly Canadian export growth stemming from energy products.
Overall, even as Canada's largest housing markets come back to earth, the consumer will likely keep on chugging along, suggesting some upside to our economic forecast for this year. But, with the economy on a stronger footing, the Bank of Canada is expected to start raising rates as early as spring 2018, putting downward pressure on consumer spending and residential investment. The plan is that, by then, exports and business investment will have started to pick up.
Week Ahead Dollar Struggles After US Jobs Miss
US Jobs growth slows down to 138,000
The US dollar is lower across the board versus major currencies. The U.S. non farm payrolls (NFP) grew by 138,000 jobs in May short of the 180,000 forecasted and there were downward revisions to the two previous months. The employment trend continues to be strong as evidence by the fall in the unemployment rate to its lowest since 2001, 4.3 percent. The market is still pricing in a 91.2 percent of a rate hike in June with U.S. Federal Reserve raising interest rates by 25 basis points to the 100–125 basis points range. US economic data was softer than expected and if anything will put under question a third rate hike by the Fed later this year but the jobs miss is not considered to derail the June rate hike.
Political uncertainty will be higher this week as the UK elections offer an uncertain result. Opinion polls have been all over the place with some showing a resounding victory by UK PM Theresa May while other see a closer battle that could make calling the snap election the worst mistake under her watch. UK pollsters have not endeared themselves to markets by missing the victory of David Cameron in 2015 and the results of Brexit in 2016. Maybe they would have refined their methods in 2017? The UK election will take place all day on Thursday, June 8.
June will be a pivotal month for central banks and the first out of the gate will be the Reserve Bank of Australia (RBA) that will publish its rate stamens on Tuesday, June 6 at 9:30 pm EDT. Analysts expect the central bank to keep rates unchanged at 1.50 percent. The European Central Bank (ECB) will feature in a busy trading day on Thursday, June 8 and while not expected to change rates, there is anticipation of a change in the economic assessment with a long shot being a clear signal of QE tapering. Inflation dropped in May, but the economy should have enough momentum leaving some room for the ECB to change its guidance as Germany continues to pressure the central bank to reduce its monetary stimulus program.
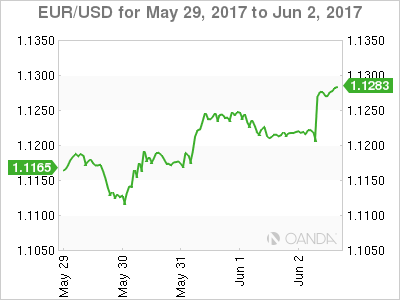
The EUR/USD gained 0.971 percent in the last five days. The single pair is trading at 1.1275 after the US employment report disappointed investors. The USD has not found its mojo after political turmoil in the White House has beat a constant drum that is going nowhere. The testimony of former FBI director James Comey on Thursday will add to an already chaotic day as investors will still be following the UK elections results.
The ECB could offer some words of encouragement to the euro by upgrading its assessment of the economy. The visit by Donald Trump might have had unintended consequences as Europe seems more united than usual with Emmanuel Macron and Angela Merkel building close ties. Macron still has to wait for the results of the June 11 parliamentary elections to know if he will get to govern on his terms, or cohabitate with one or more political parties.
There is more political events than economic releases no at the week of June 5 to 9 so investors should keep themselves informed of all the developments of the week and change their strategies accordingly.
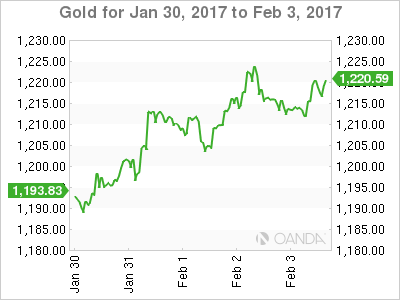
Gold rose 0.833 percent on a weekly basis. The yellow metal is trading at $1,276.68 after political turmoil and mixed economic data in the US made investors sell the dollar to seek refuge in gold. The surprising miss by the NFP put the USD further under pressure as the Trump administration has been under investigation for possible Russian connections. Political risk is on the rise, not only in the States, but with two upcoming elections in the next few days gold has been the destination of choice for investors. Risk appetite is subdued as the uncertain outcomes from the elections and the testimony of James Comey could have deep impacts on global markets.
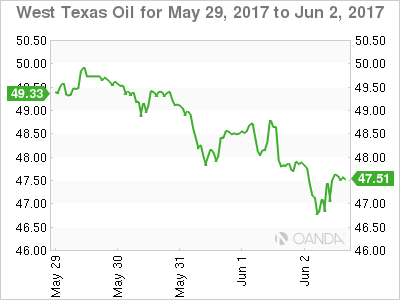
The price of oil fell 3.06 percent in the last five days. West Texas Intermediate is trading at $47.46 despite a huge drawdown in weekly oil inventories last week. Crude hit a three week on the back of the US abandoning the Paris Climate Accord. The increase in US production has kept the Organization of the Petroleum Exporting Countries (OPEC) production cut agreement from boosting oil prices, and the move by the Trump administration will support more shale drilling putting more supplies in an already saturated market.
Market events to watch this week:
Monday, Jun 5
- 4:30am GBP Services PMI
- 10:00am USD ISM Non-Manufacturing PMI
Tuesday, Jun 6
- 12:30am AUD Cash Rate
- 9:30pm AUD GDP q/q
Wednesday, Jun 7
- 10:30am USD Crude Oil Inventories
- 9:30pm AUD Trade Balance
- Tentative CNY Trade Balance
Thursday, Jun 8
- All Day GBP Parliamentary Elections
- 7:45am EUR Minimum Bid Rate
- 8:30am EUR ECB Press Conference
- 8:30am USD Unemployment Claims
Friday, Jun 9
- 4:30am GBP Manufacturing Production m/m
- 8:30am CAD Employment Change
- 8:30am CAD Unemployment Rate
*All times EDT
EURGBP: Retains Its Bullishness Short Term
EURGBP- The cross looks to strength further in the short term. Support lies at the 0.8700 level where a violation will turn focus to the 0.8650 level. A break will expose the 0.8600 level. Resistance resides at the 0.8800 level where a violation if seen will turn risk towards the 0.8850 level. Further up, resistance resides at 0.8900 level followed by the 0.8950 level. Its daily RSI is bullish and pointing higher suggesting further upside pressure. All in all, EURGBP remains biased to the upside in the short term.
UK General Election, ECB & RBA Policy Meetings, Comey’s Testimony, Key Data in Focus
Next week's market movers
- In the UK, all eyes will be on the General Election. A strong showing by the Conservatives is likely to raise speculation that PM May could negotiate a better Brexit deal with the increased domestic support she will gain.
- In Eurozone, the ECB policy gathering will be closely watched, considering the heightened speculation that policymakers could shift to a more optimistic bias.
- We expect the RBA to maintain a balanced tone. Even though domestic data are improving, signs that economic activity may be cooling in China could raise concerns for policymakers.
- In the US, former FBI Director Comey will testify before the Senate. Focus will be on the whether President Trump attempted to influence an FBI investigation. Any confirmation of that could unleash a political maelstrom.
- We also get key economic data from Australia, China, the UK, the US, and Canada.
On Monday, the UK services PMI for May is due out and the forecast is for a decline. Even though the manufacturing index for the month fell as well, the construction index rose notably, which does not paint a clear picture. As such, we expect investors to focus on the services figure to determine how the economy performed in May, bearing in mind that the service sector accounts for the vast majority of UK GDP. That being said, we think that with the General Election just around the corner, political developments are likely to overshadow economics and thus, incoming opinion polls could remain the main driver of sterling over the next few days.
From the US, we get the ISM non-manufacturing PMI for May and the consensus is for the index to have declined somewhat. However, such a decline would still leave the figure at a very elevated level, consistent with strong growth in the non-manufacturing sector. Therefore, we doubt that such a modest pullback will materially alter investors' expectations regarding the Fed's hiking plans from June onwards.
Markets will remain closed in Germany, France, Switzerland, Norway and Sweden in celebration of Whit Monday. New Zealand markets will stay closed as well for the Queen's Birthday holiday.
On Tuesday, during the Asian morning, the RBA policy decision will be in focus. The forecast is for the Bank to keep its policy unchanged. In the minutes of its latest gathering, the RBA reiterated its concerns about the labor market, indicating that it is "carefully monitoring" developments. Nonetheless, April's employment data that were released after that meeting were particularly strong, and we think that the Bank is likely to acknowledge this progress. That said, we expect policymakers to refrain from appearing too upbeat. Even though Australian data are improving on the whole, some forward-looking indicators of the Chinese economy suggest that economic activity there is cooling. Specifically, the Caixin manufacturing PMI entered the contractionary territory in May, which is likely to be worrisome news for the RBA, considering Australia's heavy trade exposure to China. What's more, the fact that iron ore prices have continued to slide since the latest RBA meeting enhances the argument for a balanced tone by policymakers
On Wednesday, the only event that could attract market attention is Australia's GDP for Q1. Without a forecast available, we see the case for the nation's economic growth to have slowed from an astonishing +1.1% qoq in Q4. Even though the labor market continued to tighten and iron ore prices remained elevated, retail sales missed their forecasts and barely rose throughout the quarter, suggesting that the robust +1.1% qoq is unlikely to be sustained, in our view.
On Thursday, we have an extremely busy day, with a UK General Election, an ECB policy meeting, and a testimony by the former Director of the FBI on the schedule.
Kicking off with the UK election, opinion polls suggest that the Conservative Party, led by Prime Minister Theresa May, is poised for a landslide victory. According to a rolling average of recent polls, even though the Conservatives have lost some of their lead recently, they are still expected to secure 44% of the total vote, with Labour tracking behind them at 35%. Considering that a Conservative victory is very widely anticipated, we think that market focus will be primarily on the percentage that the party manages to secure, as opposed to whether it will actually win. A strong showing by the Conservatives that gives them a clear majority in the House of Commons is likely to prove positive for sterling, on the grounds that PM May could manage to negotiate a better Brexit deal with the increased domestic support she will gain. That being said though, given sterling's sharp rally after Theresa May announced the snap election, most of the good news may already be priced into the currency. As such, even though there could be some further upside in GBP in case of a strong Conservative victory, we believe that any surge is unlikely to be major. This view is enhanced by the fact that the next political risk, the Brexit negotiations, are set to begin a few days later on the 19th of June.
Therefore, we think that the risk here for sterling is a weaker-than-expected showing by the Conservatives, which leaves them with a very small majority in Parliament, or even no majority at all. In the latter outcome, the Conservatives would need to form a coalition with another party, or govern with a minority. Thus, in both of these scenarios Theresa May would likely have less domestic support than previously anticipated and consequently, her hand in the Brexit negotiations may be weaker. Therefore, in case of an underwhelming showing by the Conservatives, we would expect the pound to tumble, perhaps significantly.
In Eurozone, all eyes will be on the highly-anticipated ECB policy gathering. With no expectations for any actual change in policy, market focus will probably be on whether the Bank will shift to a more optimistic bias. Recent media reports have suggested policymakers will likely acknowledge the recent improvement in the outlook for economic growth, by indicating that the risks surrounding that outlook are no longer tilted to the downside but are instead "broadly balanced". These reports also said the Governing Council will discuss whether it should drop its dovish forward guidance regarding a potential expansion of the QE program and the indication that rates could be reduced further if needed.

We share the view for an upgrade in the assessment of risks regarding GDP growth, but we think it is too early for the ECB to alter its dovish forward guidance, for a variety of factors. First and foremost, such a rapid change in language from policymakers could be over-interpreted by markets as a preliminary hint to tapering, which could result in a sharp appreciation of the euro as well as a spike higher in the bond yields of euro area economies. Additionally, it is not clear whether the recent upswing in the core inflation rate is self-sustaining and durable, as Draghi pointed out recently. Finally, the ECB President also noted that an extraordinary amount of monetary policy support is still needed, including through the use of the Bank's forward guidance. In our view, this implies that the Bank's language is unlikely to be changed so drastically so quickly.
Last but not least, in the US, former FBI Director James Comey will testify before the Senate Intelligence Committee. The testimony will likely center around whether President Trump attempted to influence an FBI investigation regarding ties between Trump's prior security advisor Michael Flynn and Russia. Even though financial markets usually do not focus on such events, we think that they will probably pay attention to this one, as it may hold implications for Trump's tax-reform agenda and his administration's ability to push it through Congress.
Should Comey confirm that Trump asked him to drop the investigation, as has been suggested by media reports, we could see renewed political turmoil in Washington D.C. Investors could begin to question whether Trump can be impeached over this, and consequently, whether he can manage to implement the reforms he has promised, amid so much political controversy. Something like that could prove negative for the dollar, not only due to the elevated uncertainty, but also due to a potential further unwinding of the "Trump trade". On the other hand, if Comey indicates that nothing like that ever occurred, we could see this cloud of political uncertainty being lifted, which could prove positive for the greenback, in our view.
As for the economic indicators, China's trade balance for May is due to be released during the Asian day, though no forecast is available for any figure yet. Our own view is that exports likely rose again, possibly at a similar pace as last month. We base that view on the nation's official and Caixin manufacturing PMIs for the month, both of which showed that new orders from abroad continued to rise, but at a relatively subdued pace. Meanwhile, we see the case for imports to have risen at a somewhat slower pace than the previous month, considering that the Imports sub-index of the official PMI declined to reach the 50 mark, indicating stagnant imports from companies.
On Friday, during the Asian morning, China's CPI and PPI for May are due to be released. Without any forecast available, we see the case for both the CPI and the PPI rates to have declined from previously. We base our view on the nation's Caixin manufacturing PMI for the month, which showed that as a result of lower raw material prices, firms reduced their final prices for the first time since February 2016. Even though further decline in the CPI rate could be somewhat worrisome for the PBoC, we doubt that policymakers will ease policy as a response, unless the situation deteriorates notably. In fact, the PBoC has been gradually tightening its policy recently, mainly as a response to financial stability risks, such as the rapidly rising house prices in major Chinese cities. Thus, we believe that for the time being, financial stability concerns are likely to overshadow any modest slowdown in inflationary pressures or economic growth.
In Canada, employment data for May will capture market attention, though no forecast is available yet. Our own view is that the nation's unemployment rate may have remained unchanged following a notable drop in April, and that the net change in employment may have risen from previously. We base this on the Markit manufacturing PMI for the month, which showed that manufacturers reported one of the strongest rates of job creation in five-and-a-half years. Something like that would likely be another piece of encouraging economic data for the BoC, and it could raise some speculation regarding an increasingly more optimistic tone by the Bank in the future.
Weekly Market Outlook: ECB’s Balancing Act
- ECB's Balancing Act - Peter Rosenstreich
- Weak Job Report Casts Shadow Over USD Outlook - Arnaud Masset
- Russia: More Room For More Easing - Yann Quelenn
- Swiss Smart Beta
Economics - ECB's Balancing Act
In our annual outlook we highlighted three core themes that would drive asset prices in 2017. Trump pro-growth hype, global growth improvement and convergence of Fed and ECB policy (both heading toward "normalization"). This week the ECB could possibly shift slightly but meaningfully towards Fed / ECB convergence. We still anticipate the major adjustment will occur at the September meeting. Where the ECB will indicated the prospect of reducing emergency measure such as tapering bond purchase. However, there are growing risks that at the June meeting the ECB will setup the economic rationale for a change, usurping our call. ECB's Draghi will attempt to keep all language dovish, in the hopes of keeping the Euro weak, but even the slightest signal will have Euro bulls changing.
At the April meeting ECB Council members agreed to reassess the monetary policy situation in June. Since that meeting, EU economic data has continued to show improvements (EU Composite PMI April rose to 56.4 from 56), supporting the central bank's view that risks to growth has declined and were more balanced. There is also a marginal probability that the ECB will increase Eurozone growth annual forecast. Although a move of this type would make presenting any convincing dovish forward guidance problematic.
Recent comments and indication from the April Council is that no change in the easing bias was due to the failure of the surprising solid economy to generate sustainable inflation pressure. At the time uncertain inflation trends (transitory factors) provided a bit of credible support. However given the incoming data markets have become skeptical of this defense. While core inflation in May fell 0.9% from 1.2% (headline declined to 1.4% from 1.9%), deflation risk have nearly disappeared. Even should the ECB lower inflation forecast the rationale for extreme emergence measures are difficult to justify.
We suspect that removal of easing bias will not come from the official statement language. In fact we wouldn't be surprised if there was a nod to additional expansionary measure possible. However, Draghi's language at the press conference is likely to hold subtle signals. Taken in its entirety we expect the headlines after will indicates a minor shift from the ECB easing bias. There is a low probability that dovish bias has been adjusted by removing the possibly of lower interest rates or expansion of bond purchases. EURUSD has marginally priced in this outcome however we should get a retest of year high 1.1283 resistance. In the long run we expect the September meeting to include signaling the end of bond purchases in early 2018… and that will have profound effect on asset prices across the board.
Economics - Weak Job Report Casts Shadow Over USD Outlook
The last job report from the US dampened rate hike expectations by the Federal Reserve. In fact the report was rather mixed than disastrous as the unemployment rate fell to 4.3% the lowest level since May 2001, while the underemployment rate dropped 8.4% from 8.6% a month. However, one has to notice that the size of the active population shrunk in May and dragged the participation rate down to 62.7% from 62.9% a month ago. Therefore the improvement in the unemployment rate have to be taken with a grain of salt as it doesn't reflect a strong job market.
Looking at the number of job created, the picture is not very bright either as the US economy added 138k nonfarm jobs, well below median forecast of 182k. In addition, April's reading was downwardly revised to 174k, compared to 211k first estimate. All in all, it suggests that the Fed was incorrect by stating that it had "evidence" the Q1 weakness was transitory.
Finally, and this is in our opinion the most important point, wage growth is still not picking-up! Average hourly earnings grew 2.5%y/y in May and missed expectations of 2.6% but stabilised compared to last month. It may well prove to be the last straw that breaks the camel's back and may force the Federal Reserve to slow down seriously its tightening pace as inflation is far from picking up.
In the FX market, the US dollar suffered a quick but limited sell-off as investors rushed into safe haven assets. The yellow metal rose 0.75% to $1,276 an ounce, the Japanese yen jumped 0.70% with USD/JPY sliding to 110.60, while the EUR/USD broke the 1.1268 (high from May 23rd) resistance to the upside and printed a new multi-month high at 1.1282. High yielding currencies were also in demand with the New Zealand dollar rising 1% to $0.7135, its highest level since March 2nd.
The limited market's reaction suggests that market participants don't know where to stand and are still reluctant to bet on further dollar weakness as many believe it is already oversold. It may be time to reconsider this statement as nothing supports a stronger dollar, neither from the fundamental side nor the political side as Trump's economic reforms are stuck in limbo.
Economics - Russia: More Room For More Easing
In an effort to stabilize the ruble, Russia is looking to expand its Foreign- Exchange reserves (including Gold). Russia had disclosed this amount for the period ending 26 of May and has overcome expectations by $1 billion at $406.1 billion. Russia's Central Bank has already made clear that one of its primary objectives is to increase those reserve holdings up to $500 billion as stated by Elvira Nabiullina, head of the central bank.
On top of that, Russian gold reserves could officially be above China gold reserves by year end.
Regarding the state of the Russian economy, concerns are still prevailing. Nabiullina said the economy has been resilient regarding international sanctions. As a result she hinted that interest rates may go even lower in the second half of this year. The key rate is currently standing at 9%.
Data-wise, inflation is collapsing, the last release printed at 4%. We recall that it was at an astonishing 16+% two years ago and the consumer prices growth is now standing at 4%.
The unemployment rate is also on its way down and is now reaching 5.2%. However, real disposable income should continue its decline in May after the strong decline in April of -7.6%.
Another matter of concern is the oil price as downside pressures are back and also despite the fact that OPEC has announced the extension of the cut for nine more months. The Russian economy minister said that the economy should resist to a barrel below $40. In our view the US shale gas industry is more and more competitive and we believe that oil prices should head back towards %.40.
For all those reasons, we reload our RUB short position against the dollar for some more time and we target 57 ruble for one dollar in the shortterm.
Themes Trading - Swiss Smart Beta
Swiss stocks have a reputation of being high quality and tend to provide stable returns during times of geopolitical uncertainty. With President Trump, Brexit, European elections and global protectionism, the world has become significantly more unpredictable. This portfolio sources highdividend Swiss stocks and provides an active quantitative overlay to optimize risk/reward potential. The Swiss Smart Beta theme consists exclusively of stocks from the Swiss Performance Index (SPI). The selection process identifies stocks with a high dividend yield and a market capitalization in excess of CHF 100 million. Illiquid stocks are screened for constant bid-ask spread and daily average dollar volume traded. To enhance risk diversification, the portfolio is weighted using an equally-weighted risk contribution approach. In summary, this means the allocation is calculated in such a way that each stock contributes on an equal basis to the total risk of the portfolio. This approach allows for low volatility and, in so doing, increases the risk/reward ratio.
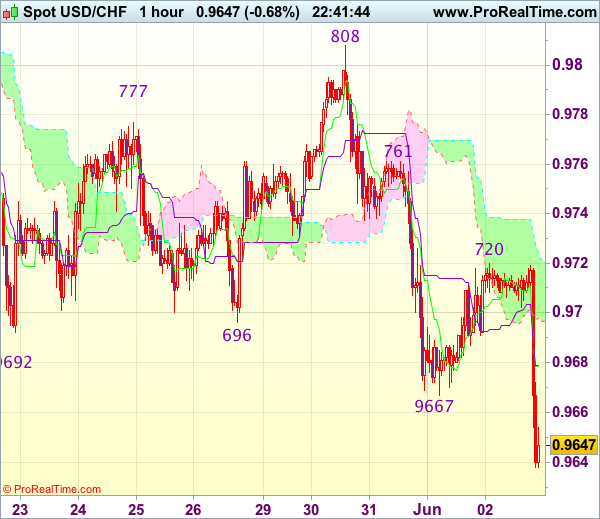
Trade Idea Wrap-up: USD/CHF – Sell at 0.9685
USD/CHF - 0.9650
Most recent candlesticks pattern : N/A
Trend : Near term down
Tenkan-Sen level : 0.9679
Kijun-Sen level : 0.9679
Ichimoku cloud top : 0.9724
Ichimoku cloud bottom : 0.9698
Original strategy :
Sell at 0.9685, Target: 0.9585, Stop: 0.9720
Position : -
Target : -
Stop : -
New strategy :
Sell at 0.9685, Target: 0.9585, Stop: 0.9720
Position : -
Target : -
Stop : -
Current selloff in US morning together with the breach of support at 0.9667 confirm recent decline has resumed and bearishness is seen for weakness to 0.9630, then towards 0.9600-05 (50% projection of 1.0100-0.9692 measuring from 0.9808), however, near term oversold condition should limit downside to 0.9570 and price should stay well above support at 0.9550, bring rebound later.
In view of this, we are looking to sell dollar on recovery as 0.9685-90 should limit upside. Only break of resistance at 0.9720 would abort and signal a temporary low is formed instead, bring a stronger rebound to 0.9750 and then 0.9770 but price should falter below resistance at 0.9808.
Trade Idea Wrap-up: GBP/USD – Stand aside
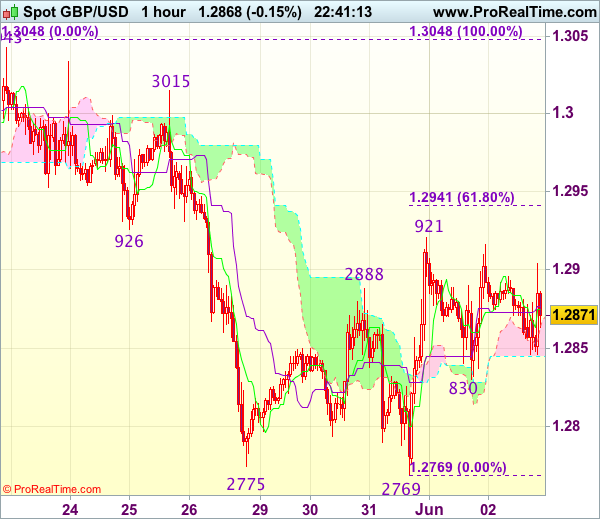
GBP/USD - 1.2875
Most recent candlesticks pattern : N/A
Trend : Near term down
Tenkan-Sen level : 1.2875
Kijun-Sen level : 1.2881
Ichimoku cloud top : 1.2868
Ichimoku cloud bottom : 1.2845
New strategy :
Stand aside
Position : -
Target : -
Stop : -
Despite rebounding to 1.2916 yesterday, as cable has retreated again after faltering below indicated resistance at 1.2921, retaining our view that further consolidation would be seen and weakness to 1.2830 support cannot be ruled out, however, only break there would signal the rebound from 1.2769 has ended, bring further fall to 1.2800 but said support at 1.2769 should remain intact.
On the upside, above 1.2905 would bring another test of 1.2921-26 (resistance and previous support), however, break there is needed to signal low has been formed at 1.2769, bring further gain to 1.2940-45 (61.8% Fibonacci retracement of 1.3048-1.2769) and later towards 1.2970 but overbought condition should cap upside below 1.3000. As near term outlook is mixed, would be prudent to stand aside for now.
Trade Idea Wrap-up: EUR/USD – Hold long entered at 1.1205
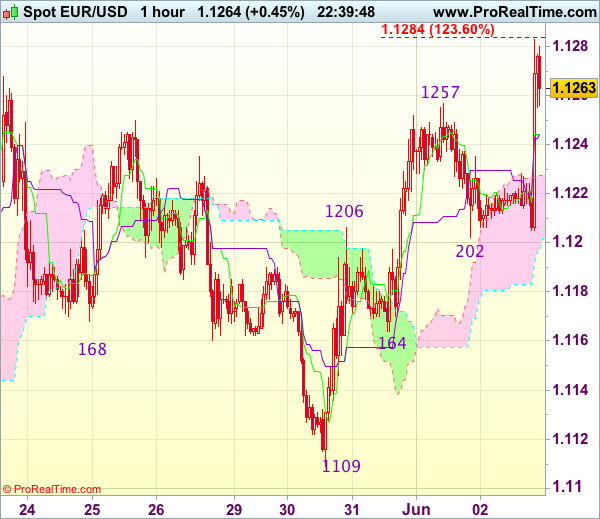
EUR/USD - 1.1272
Most recent candlesticks pattern : N/A
Trend : Up
Tenkan-Sen level : 1.1244
Kijun-Sen level : 1.1244
Ichimoku cloud top : 1.1228
Ichimoku cloud bottom : 1.1197
Original strategy :
Bought at 1.1205, Target: 1.1305, Stop: 1.1215
Position : - Long at 1.1205
Target : - 1.1305
Stop : - 1.1215
New strategy :
Hold long entered at 1.1205, Target: 1.1305, Stop: 1.1225
Position : - Long at 1.1205
Target : - 1.1305
Stop : - 1.1225
As euro has rallied on dollar’s broad-based weakness after soft NFP data and resistance at 1.1257-68 was breached, confirming our view that early upmove has resumed and test of another previous chart resistance at 1.1300 is underway, above there would encourage for headway to 1.1340-45, however, overbought condition should limit upside to chart point at 1.1366.
In view of this, we are holding on to our long position entered at 1.1205. Below support at 1.1202 would abort and signal top is formed instead, risk weakness towards indicated support at 1.1164, once this level is penetrated, this would signal recent upmove has ended, bring further fall to 1.1130-40 first.
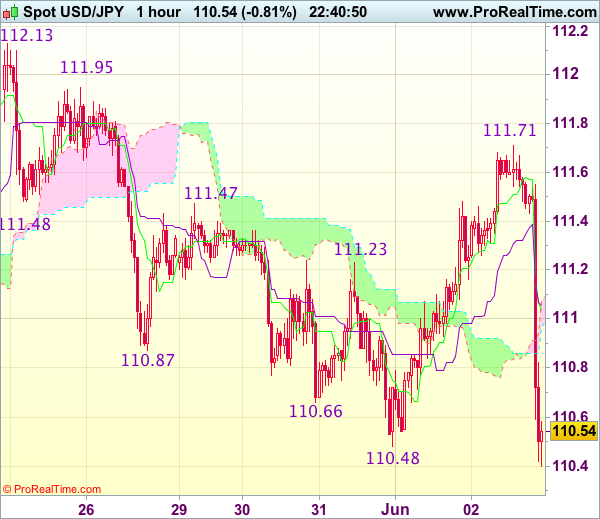
Trade Idea Wrap-up: USD/JPY – Stand aside
USD/JPY - 110.52
Most recent candlesticks pattern : N/A
Trend : Sideways
Tenkan-Sen level : 111.04
Kijun-Sen level : 111.06
Ichimoku cloud top : 111.07
Ichimoku cloud bottom : 110.97
New strategy :
Stand aside
Position : -
Target : -
Stop : -
The greenback has dropped quite sharply in US morning on back of weaker-than-expected NFP data, dampening our bullishness and suggesting the fall from 112.13 is still in progress, hence test of previous support at 110.24 would be seen, however, break there is needed to provide confirmation that early selloff from 114.37 top has resumed for weakness to 109.90-00 first.
In view of this, would not chase this fall here and would be prudent to stand aside for now. On the upside, expect recovery to be limited to 110.80-85 and price should falter below 111.40, bring another decline later. Only break of said resistance at 111.71 would revive bullishness and bring another rise to 111.95 and possibly towards resistance at 112.13.