Sample Category Title
Eco Data 6/2/17
[php_everywhere] [/php_everywhere]
Euro in Holding Pattern Ahead of US Nonfarm Payrolls
The euro has inched higher in the Friday session, as EUR/USD is currently trading at 1.1220. On the release front, the sole eurozone event is Spanish Unemployment Change, which posted a strong drop of 111.9 thousand, slightly better than expectations. In the US, the spotlight remains on employment data, highlighted by Nonfarm Payrolls. The markets are braced for a sharp drop in May, with a forecast of 181 thousand. We'll also get a look at wage growth, which is expected to dip to 0.2%, and the unemployment rate, which is forecast to remain unchanged at 4.4 percent.
As the eurozone's largest economy, a strong and reliable German economy has been instrumental in the eurozone's impressive improvement in the first quarter of 2017. However, retail sales, the primary gauge of consumer spending, has raised concerns with some soft numbers in recent months. In April, retail sales declined 0.2%, compared to a forecast of +0.4%. This marked the third decline in 2017, further contraction in the second quarter could unnerve investor confidence in the German economy and weigh on the euro. Although the German labor market remains strong, this has not translated into higher inflation, which declined 0.2% in May, after a flat reading of 0.0% in April.
With less than two weeks to go before the Federal Reserve's rate decision on June 14, the markets are ever-more confident that the Fed will press the rate trigger for the second time this year. The odds of a quarter-point rate hike continue to rise, and according to the CME Group, currently stand at 91 percent. The Fed remains concerned about low levels of inflation, which remain stubbornly low, despite a labor market that remains close to capacity. Janet Yellen & Co. are also scratching their heads over soft consumer spending, which has not kept pace with high levels of consumer confidence. As for additional rate hikes in the second half of 2017, the markets are much more skeptical, as the heady predictions that the Fed could raise rates up to four times this year have faded considerably.
Forex Technical Analysis: EUR/USD, USD/JPY, GBP/USD
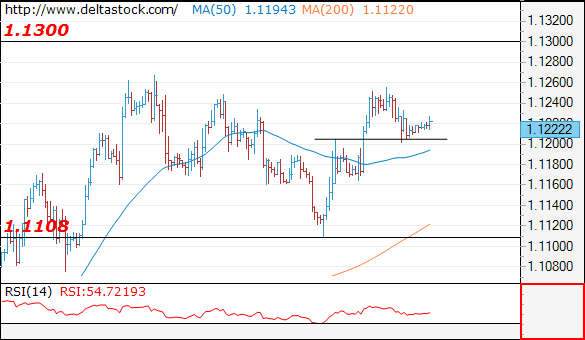
EUR/USD
Current level - 1.1222
The intraday bias is slightly bearish and a break through 1.1205 minor support will lead to a slide towards 1.1108 low.
| Resistance | Support | ||
| intraday | intraweek | intraday | intraweek |
| 1.1267 | 1.1360 | 1.1205 | 1.1022 |
| 1.1300 | 1.1610 | 1.1165 | 1.0838 |
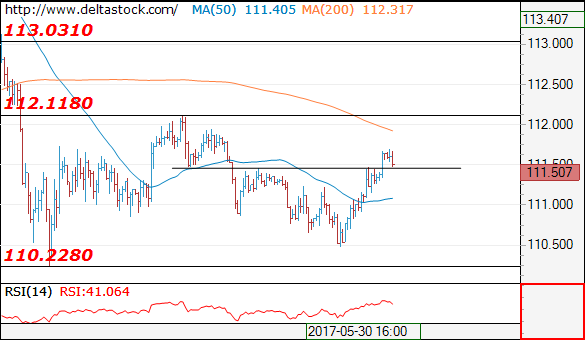
USD/JPY
Current level - 111.50
A reversal has been confirmed at 110.45 and the bias is positive, for a rise towards 112.10, en route to 113.00.
| Resistance | Support | ||
| intraday | intraweek | intraday | intraweek |
| 112.10 | 114.30 | 110.45 | 109.40 |
| 113.00 | 115.60 | 110.20 | 108.12 |
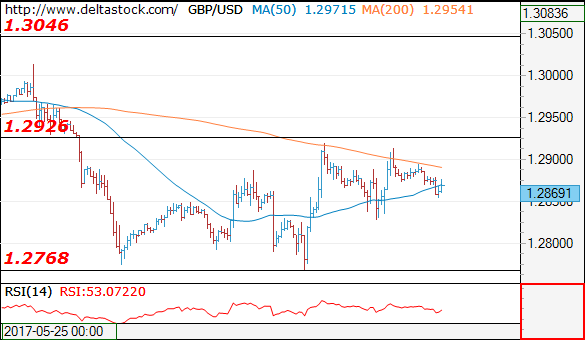
GBP/USD
Current level - 1.2869
The consecutive failures at 1.2930 resistance signal a bearish outlook, for a slide towards 1.2770 support zone.
| Resistance | Support | ||
| intraday | intraweek | intraday | intraweek |
| 1.2930 | 1.3120 | 1.2770 | 1.2770 |
| 1.3050 | 1.3500 | 1.2705 | 1.2610 |
Market Update – European Session: US Payrolls Eyed For ‘Green Light’ For Jun Rate Hike
Notes/Observations
Risk-on vibe seen through global markets
Focus on US payroll data with wage numbers being crucial for inflation and the rate outlook
UK Construction PMI hits a 17-month high
Overnight
Asia:
US, China likely to propose today UN security council blacklist more North Korean individuals, entities over missile launches
Europe:
France legislative election Harris poll (first round): Macron's En Marsche Party 31%, National Front 18%, Republicans 18%
Labour will try to form minority govt and rely on Scottish National Party (SNP) votes to implement its policies in event of hung parliament
Amber Rudd set to replace Phillip Hammond becoming 1st female Chancellor if Conservatives win landslide election
US Treasury announced new sanctions on nine companies and govt institutions. The list included two Russian companies and three Russian citizens over their support they provide for North Korean weapons development programs.
Russia Foreign Ministry preparing retaliatory measures in response to US imposing sanctions on Russia firms and businesses linked with North Korea
Americas:
President Trump: confirmed US to withdraw from Paris climate accord; confirmed would start negotiation for a new deal that is more "fair" to the US
Senate Intelligence Committee: Former FBI Dir Comey will testify before the committee on Thurs, June 8t
Economic Data
(JP) Japan May Consumer Confidence: 43.6 v 43.5e
(CZ) Czech Q1 Preliminary GDP (2nd reading) Q/Q: 1.3% v 1.3%e; Y/Y: 2.9% v 2.9%e
(ES) Spain May Net Unemployment M/M: -111.9K v -110.0Ke
(NO) Norway May Unemployment Rate: 2.6% v 2.6%e
(UK) May Construction PMI: 56.0 v 52.6e (9th month of expansion and highest reading since Dec 2015)
(EU) Euro Apr PPI M/M: 0.0% v 0.2%e; Y/Y: 4.3% v 4.5%e
(GR) Greece Q1 Final GDP Q/Q: +0.4% v -0.1%e; Y/Y: % v -0.3%e; GDP Seasonally adj Y/Y: % v -0.5% advance
Fixed Income Issuance:
(IN) India sold total INR150B vs. INR150B indicated in 2022, 2029, 2033 and 2051 bonds
SPEAKERS/FIXED INCOME/FX/COMMODITIES/ERRATUM
Equities
Indices [Stoxx50 +1.0% at 3604, FTSE +0.4% at 7541, DAX +1.2% at 12813, CAC-40 +0.9% at 5365, IBEX-35 +0.9% at 10979, FTSE MIB +0.9% at 21137, SMI +0.5% at 9068, S&P 500 Futures +0.2%]
Market Focal Points/Key Themes
European Indices trade broadly higher taking cue from another strong showing in the US overnight where indices traded another all time high after strong ADP figures for May.
On the corporate front, CGG outperforms this morning up over 25% after agreeing in principal a financial restructuring program. Plus 500 shares outperform after a positive update and share buyback, with Neopost down 2% after results. Looking ahead all focus will be on May Non Farm Payrolls, with positive expectations after the strong ADP reading.
Equities
Consumer discretionary [B&M [BME.UK] -2.7% (CD&R, SSA Sell 12.5% stake )]
Consumer Staples [Laurent Perrier [LPE.FR] +0.9% (Earnings)
Industrials [WYG [WYG.UK] +10% (Contract wins), NeoPost [NEO.FR]-2.9% (Earnings)]
Financials [Plus 500 [PLUS.UK] +9.4% (Q1 update, buyback)
Healthcare [Ipsen [IPN.FR] +8.5% (Proposes €1.67B buyback)]
Energy: [CGG [CGG.FR] +30.6% (Agreement in principle on financial restructuring)]
Speakers
Scottish First Min Sturgeon (SNP): PM May still on track to win UK election but with less of a majority than expected. Scenario where Scotland becomes center stage and potentially a bigger role to play
Currencies
FX markets saw the major pairs confined to tight ranges ahead of the US May Non-farm payroll data. Stronger than forecast ADP data Thursday has some adjusting up their call on the headline NFP release and possibly cementing a rise in Federal Reserve interest rates later this month
The USD/JPY was higher aided by the overall risk-on vibe exhibited through global markets. Pair near 2-week highs at 111.50 area
EUR/USD holding above the 1.12 level and within striking distance of fresh 7-month highs
GBP/USD softer with just under a week to go before national elections. Dealers noted that Sterling was faring better than one would have expected given that some polls suggest that the Tories could lose their majority in Parliament in next week's election
Fixed Income
Bund futurestrade at 162.39 up 13 ticks, near highs for the week. Resistance remains near the 162.81 level followed by 163.54. A break of the 161.65 support level could see lows target 159.96 followed by 157.50.
Gilt futurestrade at 128.73 higher by 21 ticks, off the lows for the week. Last week's rally tentatively took out both the 129.00 handle and the 129.14 April 18th high, but Wednesday's decline was unable to hold that key region. Price finds key support at the 128.48 support level. An acceleration lower could test the 127.43 region. Resistance remains the noted 129.00/129.14 region, then 129.75 followed by 130.28.
Friday's liquidity report showed Thursday's excess liquidity surged to €1.667T a rise of €44B from €1.623T prior. Use of the marginal lending facility rose to €327M from €177M prior.
Corporate issuance saw $17.2B come to market via 9 issues headlined by Cardinal Health $5.2B 7-part senior unsecured note offering and Arrow Electronics $500M 10-year senior unsecured notes. This week's issuance is at $27.15B, lower than the analysts' issuance target to come in around $35B. Forecast for June issuance is at $90B. For the week ending May 31st Lipper US fund flows reported IG funds net inflows $980.96M bringing YTD inflows to $57.96B, High yield funds reported outflows of $0.52B bringing YTD outflows to $5.49B.
Looking Ahead
(RO) Romania May International Reserves: No est v $39.8B prior
(RU) Russia May Sovereign Wealth Fund Balances: Reserve Fund: No est v $16.3B prior; Wellbeing Fund: No est v $73.6B prior
06:00 (UK) DMO to sell combined £2.0B in 1-month, 3-month and 6-month bills (£0.5B, £0.5B and £1.0B respectively)
06:45 (US) Daily Libor Fixing
07:30 (CL) Chile Central Bank (BCCh) May Minutes
08:00 (BR) Brazil Apr Industrial Production M/M: +0.1%e v -1.8% prior; Y/Y: -5.5%e v +1.1% prior
08:15 (UK) Baltic Dry Bulk Index
08:30 (US) May Change in Nonfarm Payrolls: +182Ke v +211K prior, Change in Private Payrolls: +175Ke v +194K prior, Change in Manufacturing Payrolls: +5Ke v +6K prior
08:30 (US) May Unemployment Rate: 4.4%e v 4.4% prior, Underemployment Rate: No est v 8.6% prior, Change in Household Employment (civilian labor force): No est v 160.2K prior, Civilian Labor Participation Rate: 62.9%e v 62.9% prior
08:30 (US) May Average Hourly Earnings M/M: 0.2%e v 0.3% prior; Y/Y: 2.6%e v 2.5% prior; Average Weekly Hours: 34.4e v 34.4 prior
08:30 (US) Apr Trade Balance: -$46.1Be v -$43.7B prior
08:30 (US) Weekly USDA Net Export Sales
08:30 (CA) Canada Q1 Labor Productivity Q/Q: 1.2%e v 0.4% prior
08:30 (CA) Canada Apr Int'l Merchandise Trade: C$0.0Be v –C$0.1B prior
09:00 (SG) Singapore May Purchasing Managers Index: 50.9e v 51.1 prior, Electronics Sector Index: No est v 51.6 prior
09:00 (MX) Mexico Apr Leading Indicators M/M: No est v 0.06 prior
09:00 (CL) Chile Apr Retail Sales Y/Y: 3.0%e v 4.9% prior
10:00 (DK) Denmark May Foreign Reserves (DKK): 464.1Be v 464.1B prior
11:00 (CO) Colombia Apr Exports: $2.9Be v $3.2B prior
11:00 (EU) Potential sovereign rating after European close
(IE) Ireland Sovereign Debt to be rated by S&P
(ZA) South Africa Sovereign Debt to be rated by S&P
(FI) Finland Sovereign Debt to be rated by Moody's
(UK) United Kingdom Sovereign Debt to be rated by Moody's
(CY) Cyprus Sovereign Debt to be rated by DBRS
12:00 (IS) Iceland Q1 Current Account (ISK): No est v 45B prior
12:45 (US) Fed's Harker (non-voter)
13:00 (US) Fed's Kaplan (voter)
13:00 (US) Weekly Baker Hughes Rig Count Data
US Employment Report: Will It Seal The Deal For A June Hike?
Today, all eyes will be on the US employment report for May. The forecast is for nonfarm payrolls to have risen by 185k, less than the 211k in April, but still a solid number that is consistent with further tightening in the labor market. We see the risks surrounding that forecast as tilted to the upside, considering that the ADP employment figure for the month came at 253k, notably above the consensus of 185k. The unemployment rate is expected to have remained unchanged, while average hourly earnings are anticipated to have slowed somewhat in monthly terms.
Despite some potential softness in earnings, we think that overall, this is likely to be seen as a solid report by FOMC officials, not least of which due to the unemployment rate that is expected to remain below the Fed's estimates of full employment. Even though a June rate hike is almost fully priced in at this stage, with the Fed funds futures indicating a 96% probability for such action, we believe that a strong report could bring forward market expectations regarding the timing of the next rate increase and thereby, support the dollar.
As for the Fed, we think that even a modest disappointment in these data is unlikely to derail policymakers' plans to hike in two weeks, since they may view any weakness as a blip along a solid employment trend. In addition, we have heard from a lot of FOMC members recently, and nobody gave any hints that they are uncomfortable with the elevated market pricing for a June hike, despite the recent streak of rather disappointing economic data.
EUR/USD declined somewhat yesterday after it hit resistance near the 1.1260 (R1) zone and during the early European morning Friday, the pair is trading a few pips above the 1.1200 (S1) support. Even though the price structure on the 4-hour chart still suggests a short-term uptrend, in case we get a strong employment report today, the latest pullback could continue. A break below 1.1200 (S1) could set the stage for further downside extensions and initially aim for the next support at 1.1160 (S2).
USD/JPY traded higher yesterday following the release of the encouraging ADP employment data, breaking above the resistance (now turned into support) barrier of 111.40 (S1). Strong US jobs data today could encourage the bulls to remain in control and push the price higher. A decisive break above the 112.10 (R1) resistance hurdle could pave the way for the 113.10 (R2) area.
As for the rest of today's highlights:
During the European day, the UK construction PMI for May will be released. The index is expected to have declined, but remain above the crucial threshold of 50. Such a decline could hurt sterling somewhat, but we maintain the view that over the next week, market focus is likely to remain primarily on incoming election polls.
In Eurozone, the PPI for April is due out.
We also get trade balance data for April from both the US and Canada.
We have only one speaker on the agenda: Philadelphia Fed President Patrick Harker.
EUR/USD
Support: 1.1200 (S1), 1.1160 (S2), 1.1100 (S3)
Resistance: 1.1260 (R1), 1.1300 (R2), 1.1350 (R3)
USD/JPY
Support: 110.40 (S1), 111.00 (S2), 110.50 (S3)
Resistance: 112.10 (R1), 113.10 (R2), 113.80 (R3)
World Stocks Green Ahead Of NFP
Global stocks sprinted to fresh record highs on Friday as solid economic data from the US and Europe bolstered risk sentiment. Asian shares rallied to their best levels in more than two years amid the growing appetite for risk, with the bullish momentum heavily supporting European equities. Wall Street concluded as a winner on Thursday and could follow a similar pattern this afternoon if the pending US jobs report for May exceeds expectations consequently boosting confidence towards the US economy.
Although equity bulls seem to be back in town at the start of June, questions should still be raised over the sustainability of the current rally. With uncertainty still a lingering theme and political tensions in both the US and Europe creating anxiety, the upside may face some headwinds down the road.
Sterling unfazed by strong construction data
The fact that Sterling was on the back foot on Friday despite May's solid construction PMI of 56.00 continues to highlight how political jitters in the UK and Brexit fears have become bone deep. It is becoming clear that Brexit developments may dictate where Sterling trades and uncertainty is likely to limit any concrete upside gains. With recent polls suggesting a potential situation where Theresa May fails to secure enough seats to form a government, investors have become jittery of a “hung parliament” scenario playing out. From a technical standpoint, the GBPUSD bears need to secure a daily close below 1.2775 to encourage a further depreciation towards 1.2600.
Dollar steady ahead of NFP
The Greenback staged a modest recovery during Thursday's trading session following the impressive ISM manufacturing and ADP employment data which boosted confidence towards the US economy. With data from the States displaying some signs of stability, speculation hasalready mounted over the Federal Reserve raising US rate beyond June's meeting. The main event risk for the Dollar this afternoon is the NFP report for May which investors expect to print at 185k. While a positive jobs report could inspire Dollar bullish investors, the upside could still face some headwinds from the political uncertainty in Washington.
Oil bears strike again
Oil markets were vulnerable to heavy losses on Thursday amid fears that Donald Trump's decision to ditch a global climate pact could inspire more crude drilling in the US, fuelling oversupply woes. The selling pressure intensified on Friday with WTI Crude tumbling towards $47 as the prospect of more supply, in an already heavily saturated market, haunted investors' attraction towards the commodity. I believe the story about oil revolves around oversupply concerns with OPEC's efforts to stabilize the markets repeatedly sabotaged by US Shale. Although OPEC and Non-OPEC members have agreed to extend the output cuts by another nine months, markets are clearly not impressed and the bearish price action on WTI Crude is a testament to this. From a technical standpoint, WTI Crude is under pressure and the breakdown below $48 should encourage a decline towards $46.
Commodity spotlight – Gold
Gold displayed early signs of weakness on Thursday following the robust ADP Employment Report for May which reinforced expectations of a US interest rate increase in June. Selling pressure intensified during early trading on Friday with the yellow metal tumbling to a fresh one-week low at $1258.85 as the Greenback stabilized. Although Gold remains at risk of depreciating further this afternoon if the pending May jobs report exceeds expectations, the downside should be limited by political tensions in the US and Europe. With uncertainty still a dominant theme across the markets, Gold could remain supported moving forward. From a technical standpoint, bulls need to maintain dominance above $1260 for prices to appreciate towards $1275. In an alternative scenario, repeated weakness under $1260 is likely to open a path to $1245.
GOLD Bullish Momentum Is Fading, SILVER Bearish Consolidation, CRUDE OIL Wide-Open For Further Decline.
GOLD Bullish momentum is fading.
Gold is pushing higher within uptrend channel. Hourly support is located at 1246 (18/05/2017 low). Stronger support is given at 1195 (10/03/2017 low). Expected to show further upside pressures.
In the long-term, the technical structure suggests that there is a growing upside momentum. A break of 1392 (17/03/2014) is necessary ton confirm it, A major support can be found at 1045 (05/02/2010 low).
SILVER Bearish consolidation.
Silver declines. Strong support is given at 15.63 (20/12/2017 low). Closest support is given at 16.20 (04/05/2017 low). Key resistance is given at a distance at 19.00 (09/11/2017 high). Expected to push back towards 61.8% Fibonacci retracement around 17.75.
In the long-term, the death cross indicates that further downsides are very likely. Resistance is located at 25.11 (28/08/2013 high). Strong support can be found at 11.75 (20/04/2009).
CRUDE OIL Wide-open for further decline.
Crude oil is still collapsed after the bounce following the short-squeeze move towards $52. Support is given at a distance 43.76 (05/05/2017 low). The technical structure suggests further strengthening towards $50.
In the long-term, crude oil has recovered after its sharp decline last year. However, we consider that further weakness are very likely. Strong support lies at 24.82 (13/11/2002) while resistance can now be found at 55.24 (03/01/2017 high).
EUR/JPY Strengthening, EUR/GBP Consolidating Above 0.8700, EUR/CHF Volatility Declines.
EUR/JPY Strengthening.
EUR/JPY is trading higher. Hourly support is given at 122.56 (18/05/2017 low). Hourly resistance can be found at 125.82 (16/05/2017 high). Major support is given at 114.90 (18/04/2017low). Expected to see the pair increasing towards 125.82.
In the longer term, the technical structure validates a medium-term succession of lower highs and lower lows. As a result, the resistance at 149.78 (08/12/2014 high) has likely marked the end of the rise that started in July 2012. Strong support at 94.12 (24/07/2012 low) looks nonetheless far away
EUR/GBP Consolidating above 0.8700.
EUR/GBP's bullish momentum is fading. The technical structure had turned positive since the pair has broken resistance at 0.8530 (25/04/2017 low). Strong support can be found at 0.8304 (05/12/2017 low). Expected to see a further bullish breakout towards resistance at 0.8787 (13/03/2017 high).
In the long-term, the pair has largely recovered from recent lows in 2015. The technical structure suggests a growing upside momentum. The pair is trading above from its 200 DMA. Strong resistance can be found at 0.9500 psychological level.
EUR/CHF Volatility declines.
EUR/CHF is trading mixed. Yet the pair is declining towards support given at 1.0866 (18/05/2017 low). We believe that the mediumterm pattern suggests us to see continued bearish pressures towards key support that can be found at 1.0623 (24/06/2016 low).
In the longer term, the technical structure is mixed. Resistance can be found at 1.1200 (04/02/2015 high). Yet,the ECB's QE programme is likely to cause persistent selling pressures on the euro, which should weigh on EUR/CHF. Supports can be found at 1.0184 (28/01/2015 low) and 1.0082 (27/01/2015 low).
USD/CHF Lack Of Follow-Through, USD/CAD Growing Short-Term Bullish Momentum, AUD/USD Weakening.
USD/CHF Lack of follow-through.
USD/CHF is back above former support given at 0.9692 (22/05/2017 low). Strong resistance is given at 1.0107 (10/04/2017 high). Expected to show continued weakness towards hourly support at 0.9550 (09/11/2017 low).
In the long-term, the pair is still trading in range since 2011 despite some turmoil when the SNB unpegged the CHF. Key support can be found 0.8986 (30/01/2015 low). The technical structure favours nonetheless a long term bullish bias since the unpeg in January 2015.
USD/CAD Growing short-term bullish momentum.
USD/CAD is trading above 1.3500. The pair has exited downtrend channel. Hourly support can be found at 1.3424 (28/05/2017 low) then 1.3388 (25/01/2017 high). Expected to show continued very short-term bullish pressures,
In the longer term, there is now a death cross with the 50 dma crossing below the 200 dma indicating further downside pressures. Strong resistance is given at 1.4690 (22/01/2016 high). Long-term support can be found at 1.2461 (16/03/2015 low).
AUD/USD Weakening.
AUD/USD is pushing lower towards hourly support is given at 0.7329 (09/05/2017 low). As long as prices remain below resistance at 0.7608 (17/04/2017 high), there are strong downside risks. Expected to remain below 0.7400.
In the long-term, we are waiting for further signs that the current downtrend is ending. Key supports stand at 0.6009 (31/10/2008 low) . A break of the key resistance at 0.8295 (15/01/2015 high) is needed to invalidate our long-term bearish view.
EUR/USD Consolidating, GBP/USD Sideways Price Action, USD/JPY Renewed Bullish Pressures.
EUR/USD Consolidating.
EUR/USD is consolidating below strong resistance given at 1.1300 (09/11/2017 high). Hourly support is given at 1.1110 (22/05/2017 low) has been broken. Stronger support lies at 1.0842 11/05/2017 low) and key support is given at 1.0494 (22/02/2017 low). Expected to show continued bullish pressures.
In the longer term, the death cross late October indicated a further bearish bias. The pair has broken key support given at 1.0458 (16/03/2015 low). Key resistance holds at 1.1714 (24/08/2015 high). Expected to head towards parity.
GBP/USD Sideways price action.
GBP/USD is bouncing from hourly support given at 1.2757 (21/04/2017 low). Hourly resistance lies at 1.3046 (18/05/2017 high). Expected to show renewed bearish pressures.
The long-term technical pattern is even more negative since the Brexit vote has paved the way for further decline. Long-term support given at 1.0520 (01/03/85) represents a decent target. Long-term resistance is given at 1.5018 (24/06/2015) and would indicate a long-term reversal in the negative trend. Yet, it is very unlikely at the moment.
USD/JPY Renewed bullish pressures.
USD/JPY is trading higher towards resistance given at 112.13 (24/05/2017 high). Hourly support is given at 110.24 (18/05/2017 low). Stronger support is located at 108.13 (17/04/2017 low). Other key supports lie at a distant 106.04 (11/11/2016 low).
We favor a long-term bearish bias. Support is now given at 96.57 (10/08/2013 low). A gradual rise towards the major resistance at 135.15 (01/02/2002 high) seems absolutely unlikely. Expected to decline further support at 93.79 (13/06/2013 low).