Sample Category Title
US Companies Create 253K New Jobs Last Month Vs 181K Forecast
'The current pace of job growth is nearly three times the rate necessary to absorb growth in the labor force. Increasingly, businesses' number one challenge will be a shortage of labor.' — Mark Zandi, Moody's Analytics
US private companies created more than expected jobs last month, official figures showed on Thursday. The ADP National Employment Report revealed that the US private sector added 253K new jobs to the economy in May, compared to the preceding month's downwardly revised gain of 174K positions. Meanwhile, analysts expected private firms to create 181K new jobs during the reported month. The Moody's Analytics Chief Economist Mark Zandi said that wage growth would likely accelerate 'through the year into 2018' amid the tightening labour market. Strong job creation is expected to comfy the Federal Reserve and force it to raise interest rates further in the upcoming months. The ADP data come ahead of the Labour Department's non-farm payrolls report, scheduled to be released on Friday. According to analysts, both US private and public sector created 181K new jobs last month, following April's gain of 211K new positions. Moreover, the jobless rate is set to come in at 4.4% for May, unchanged from the previous month. Economists suggest that the US labour market is close to or at full employment.
EUR/USD Analysis: Remains In Previous Range
'The euro retained its resilience and stayed close to an one-week high hit during the Asia session despite softer manufacturing data out of France and Italy.' – Vassilis Karamanis, Bloomberg
Pair's Outlook
On Friday morning the common European currency traded in the range of the previous trading session against the US Dollar. Namely, the currency exchange rate was located just above the support of the weekly PP, which is located at the 1.1204 level. Meanwhile, it faced the resistance, which kept the pair from surging on Thursday, in the form of the weekly R1 at the 1.1248 mark. From a technical perspective on the daily chart it looks like the pair will break out to the upside. The reason for such a hypothesis is the fact that the weekly PP is supported by the close by located 61.80% Fibonacci retracement level at the 1.1190 level.
Traders' Sentiment
SWFX traders remain bearish, as 60% of open positions are short. Meanwhile, 53% of pending orders are to buy the Euro.
USD/JPY Analysis: Edges Higher Ahead Of US NFP
'The near-term balance of risk appears to favor JPY strength.' – Scotiabank (based on FXStreet)
Pair's Outlook
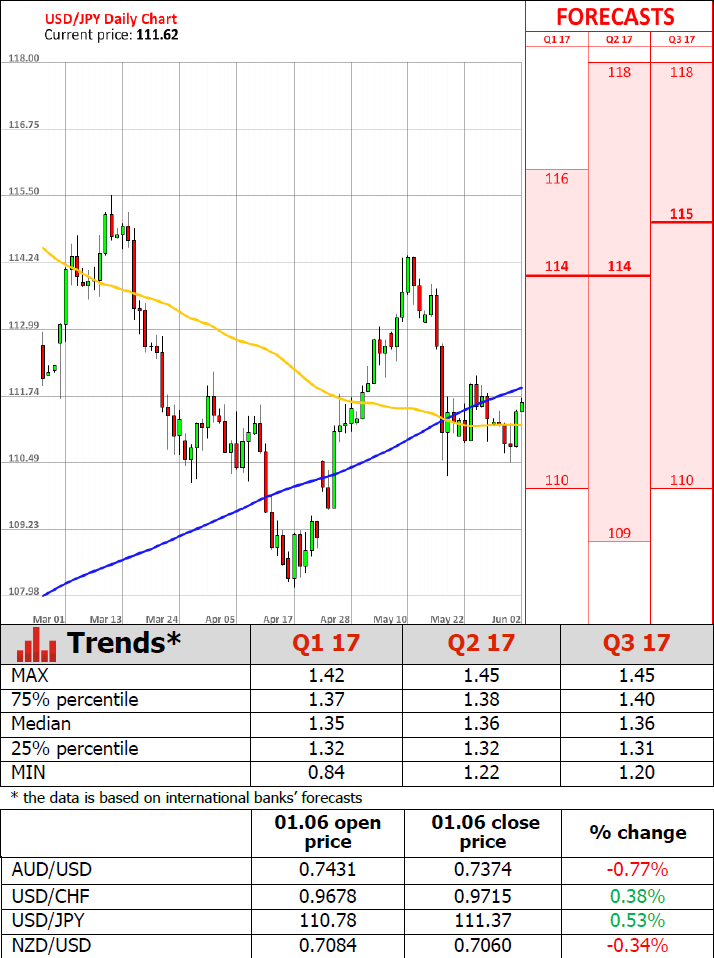
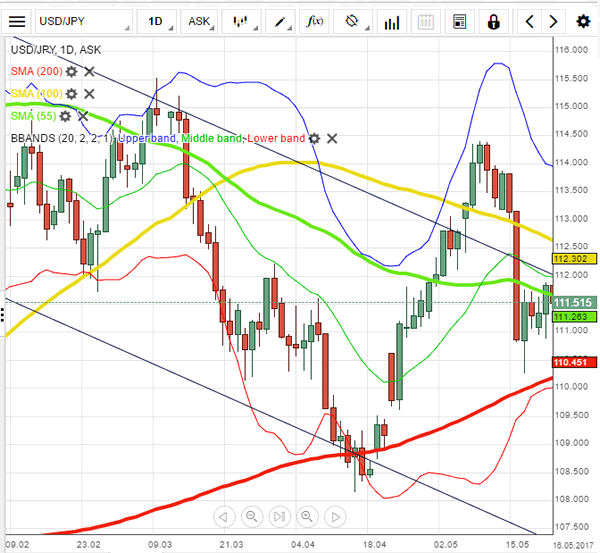
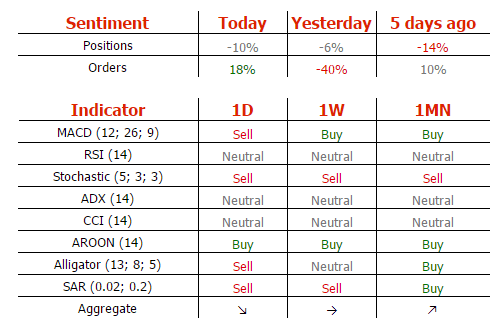
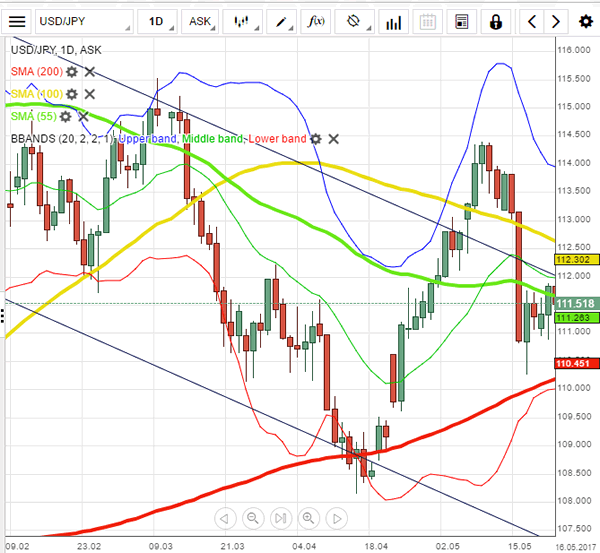
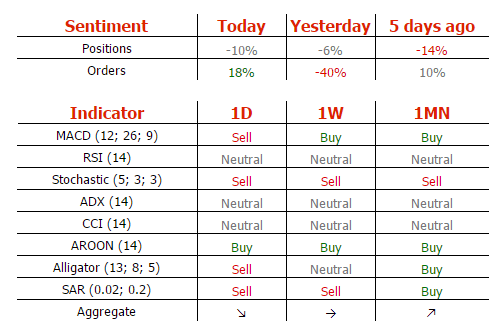
Even though the Greenback outperformed the Yen yesterday, it was still unable to close above the 111.40 mark, but still partially broke through the immediate resistance. Upbeat ADP data triggered the rally, with the NFP now anticipated to strengthen the US Dollar even further. The highest level is expected to be the 112.30 one, where the 100-day SMA rests, assuming other resistances on the path fail to contain the gains. Meanwhile, technical indicators keep giving bearish signals, insisting that the Buck is to edge lower and pierce the 110.75 psychological support area, leaving the 200-day SMA at 110.33 as the next target.
Traders' Sentiment
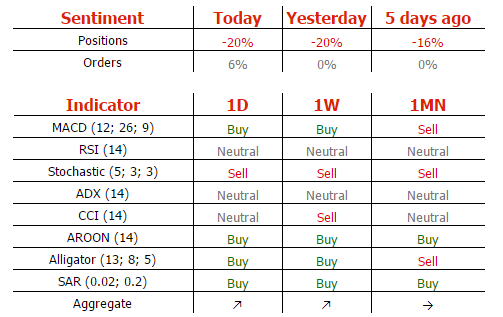
Traders' sentiment remains bearish, with 55% of all open positions now being short. The share of buy orders surged from 30 to 59%.
GBP/USD Analysis: Attempts To Break Out From Its Trading Range
'The narrowing in the polls has clearly dented sterling's performance and continues to weigh on the currency, and is probably likely to do so in the near term.' – Barclays (based on Business Recorder)
Pair's Outlook
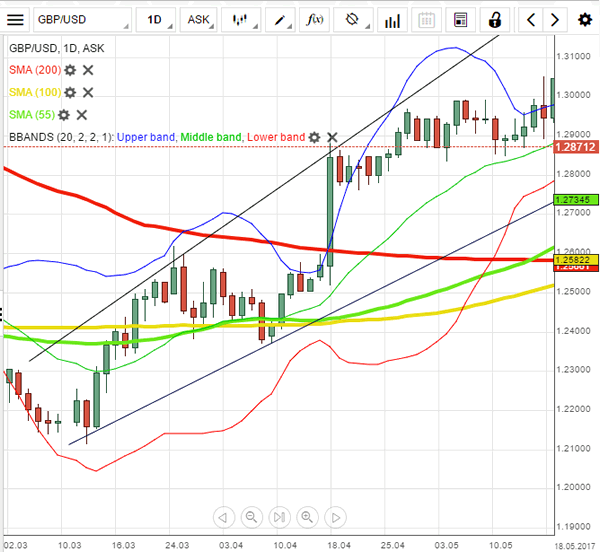
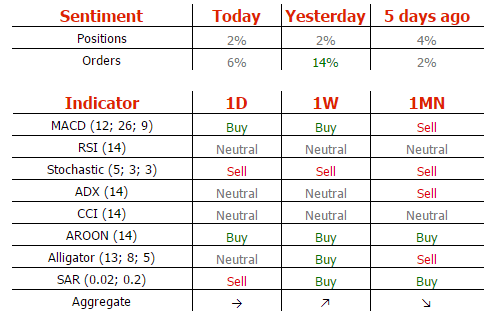
Thursday ended with the Cable remaining flat, despite downside volatility initially prevailing. The 1.29 major level has proven to be a might foe, as the Pound struggled to climb over it through all of the week. With today's US NFP data due, the GBP/USD pair could breach the broadening rising wedge's support line, leaving the 1.28 psychological demand level to limit the losses. However, technical studies are still unable to confirm this possibility, meaning there is a chance the pair could burst through the 1.29 mark, thus, prolonging the wedge pattern.
Traders' Sentiment
Market sentiment is still neutral, as 51% of all open positions are long. At the same time, the number of orders to acquire the Sterling dropped from 57 to 53%.
Gold Analysis: Falls Back Below 1,260 Mark
'A stronger dollar and firming U.S. equity markets, along with weaker oil are all headwinds that could hamper gold's advance over the short-term.' – Edward Meir, INTL FCStone (based on Reuters)
Pair's Outlook
The yellow metal suffered its biggest losses of the week on Friday morning. Once more the commodity price had retreated below the support of the weekly PP, which is located at the 1,261.80 level. Due to that fact it can be assumed that the metal once more faces the possibility of falling down to the levels near the 1,250 mark. Although, on Friday morning the closest support level after the weekly PP was the 55-day SMA at 1,255.90. However, during the week gold had retreated more than once below the weekly support and rebounded just near the 1,260 level, which might possibly occur once more.
Traders' Sentiment
SWFX traders have decreased their bullish sentiment, as 51% of open positions are long. In addition, 57% of set up orders are to buy the metal—a slight decrease from 58% on Thursday.
GBP/USD Elliott Wave Analysis
GBP/USD – 1.2865
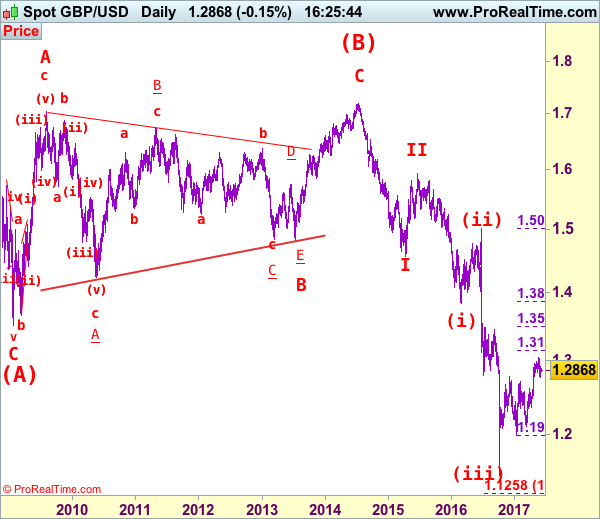
GBP/USD – Wave 4 is unfolding as an (A)-(B)-(C) and could have ended at 1.7192
The British pound only slipped to as low as 1.2769 (we recommended in our previous update to buy at 1.2760 and missed our long entry) before finding renewed buying interest there and has rebounded, however, reckon upside would be limited to 1.2960-70 and resistance at 1.3015 should hold, bring further consolidation below recent high at 1.3048 ahead of UK election. Only a daily close above 1.3015 would signal pullback from 1.3048 has ended, bring retest of this level, break there would extend recent upmove from 1.1986 low to 1.3140-50 (38.2% Fibonacci retracement of 1.5018-1.1986) and possibly 1.3200, however risk from there has increased for a retreat later.
Our preferred count on the daily chart is that cable's rebound from 1.3500 (wave (A) trough) is unfolding as a wave (B) with A ended at 1.7043, followed by triangle wave B and wave C as well as wave (B) has possibly ended at 1.7192, below support at 1.4232 would add credence to this count, then further fall to 1.4000 level would follow but reckon downside would be limited to 1.3655 support and price should stay above previous support at 1.3500.
On the downside, expect pullback to be limited to 1.2830 and bring another recovery. Below 1.2830 would bring test of 1.2757-69 support area, break there would signal a temporary top has been formed, bring retracement of recent rise to previous resistance at 1.2706 (now support), then towards 1.2650-60 but previous resistance at 1.2616 (tentatively wave i top) should remain intact.
Recommendation: Stand aside for this week.
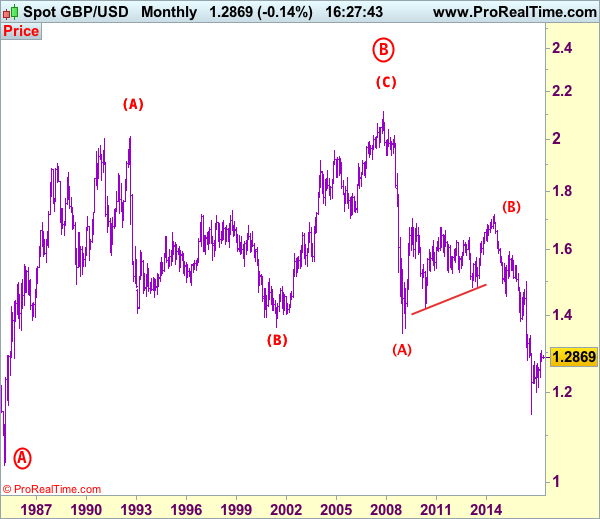
Longer term - Cable's rise from 1.0520 (Feb 1985) to 2.0100 (September 1992) is seen as [A], the decline to 1.3682 is labeled as (B) and (C) wave rally has ended at 2.1162 (9 Nov, 2007) which is also the top of larger degree wave B with circle. The selloff from there is a 5-waver with wave (A) ended at 1.3500 (23 Jan 2009), wave (B) itself is labeled as A: 1.6733, triangle wave B: 1.4813 and wave C as well as top of wave (B) ended at 1.7192 (2014), hence the selloff from there is an impulsive wave (C) with wave I : 1.4566, wave II 1.5930, an extended wave III is unfolding and already exceeded our downside target at 1.3500 and 1.3000, hence weakness to 1.2500 and possibly 1.2000 cannot be ruled out, however, price should stay well above psychological level at 1.0000.
GBP/JPY Elliott Wave Analysis
GBP/JPY – 143.55
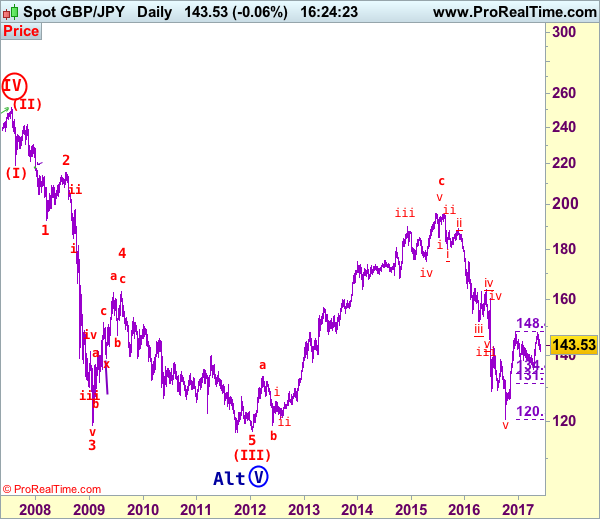
GBP/JPY – Wave 5 as well as wave (III) has possibly ended at 116.85
Although sterling’s retreat from 148.10 turned out to be stronger than expected which signals a temporary top has been formed there, as the British pound found support at 141.50 earlier this week and has rebounded, suggesting consolidation above this level would be seen and recovery to 144.00-10 and possibly 144.90-00 cannot be ruled out, however, key resistance at 145.45 would remain intact, bring further consolidation. Only a daily close above this level would suggest the fall from 148.10 has ended, bring further gain to 146.00, then towards 147.00-10 but a sustained breach above latter level is needed to retain bullishness and signal correction from 148.10 has ended, bring retest of this level first.
Our preferred count is that larger degree wave V with circle is unfolding from 251.12 with wave (I) 219.34, (II): 241.38 and wave (III) is subdivided into 1: 192.60, 2: 215.89 (23 Jul 2008) and wave 3 ended at 118.87 earlier in 2009. The correction from there to 162.60 is wave 4 which itself is a double three and is labeled as first a-b-c ended at 151.53, followed by wave x at 139.03, 2nd a ended at 162.60, 2nd b at 146.75 and 2nd c leg of wave 4 ended at 163.00. Therefore, the decline from 163.00 to 116.85 is now treated as wave 5 which also marked the end of larger degree wave (III), hence wave (IV) major correction has commenced for retracement of the wave (III) from 241.38 and upside target at 183.95-00 (50% Fibonacci retracement of the wave (II) from 241.38) had been met, a drop below 160.00 would suggest wave (IV) has ended at 195.85, bring decline in wave (V) for initial weakness to 130 (already met) and 120.
On the downside, expect pullback to be limited to 142.50-55 and bring another rebound. Below 142.00 would bring another test of said support at 141.50 but only break there would signal the fall from 148.10 top is still in progress, bring a stronger retracement of recent rise to 141.00 and possibly towards previous resistance at 140.35, however, reckon downside would be limited to psychological level at 140.00, bring rebound later.
Recommendation: Stand aside for this week.
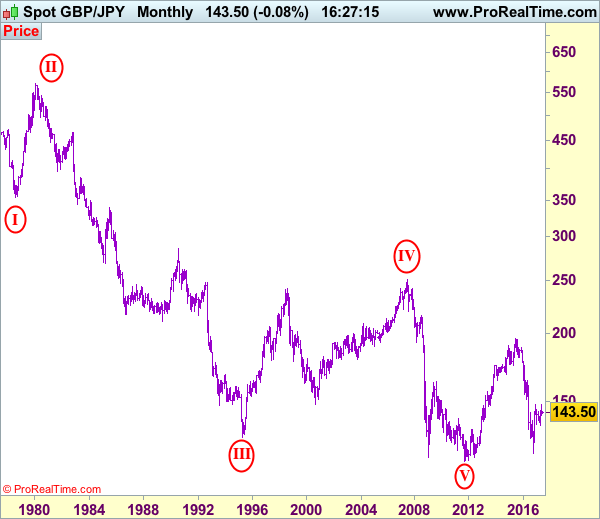
The long-term downtrend from 570.99 (29 Feb 1980) is labeled as an impulsive wave with III with circle ended at 129.77 (20 Apr 1995) and the corrective rebound to 251.12 (20 Jul 2007) is treated as wave IV with circle and the wave V with circle selloff from 251.12 has possibly ended at 116.80 (almost reached our indicated target at 116.00) and major correction has commenced from there and indicated upside target at 183.90-00 (50% Fibonacci retracement of 251.10-116.85) had been met, reckon upside would be limited to 199.80-90 (61.8% Fibonacci retracement) and bring wave (V) decline in later part of 2017.
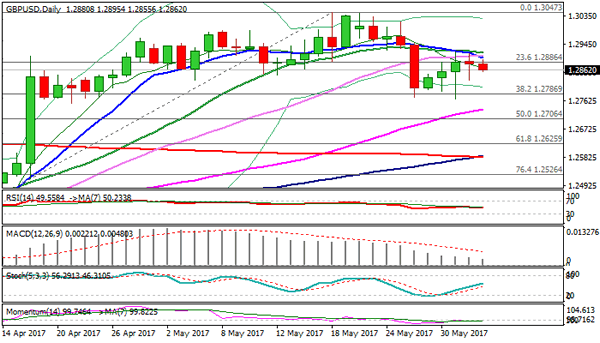
Technical Outlook: GBPUSD – Negative Signals On Repeated Upside Rejection Shift Near-Term Risk Lower
Cable eased below 1.2900 in early Friday's trading after upside attempts in past two days were repeatedly capped by 20SMA at 1.2920. Negative near-term signals are developing on formation of multiple bear-crosses (10/20 and 10/30 SMA's) as well as daily Tenkan-sen/Kijun-sen, which may trigger further weakness. Firm break below cracked initial support at 1.2862 (Fibo 38.2% of 1.2768/1.2920 recovery leg) would open way for further downside and expose next pivotal support at 1.2829 (Thursday's low/near Fibo 61.8%) and risk return to 1.2770 higher base. Alternative scenario requires sustained break above 1.2920 pivot to turn near-term bias higher. US Jobs data are in focus for firmer direction signals.
Res: 1.2900, 1.2920, 1.2941, 1.2981
Sup: 1.2855, 1.2829, 1.2800, 1.2768
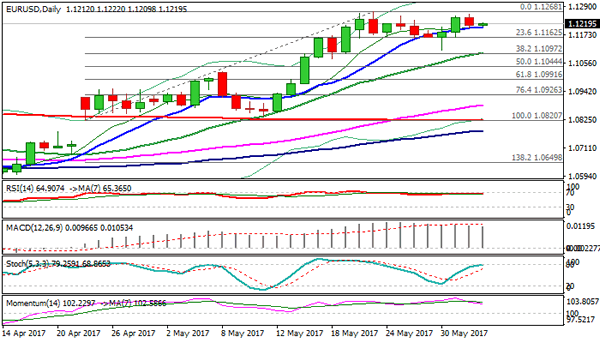
Technical Outlook: EURUSD – Tight Ranges Ahead Of US NFP Data
The Euro was flat in Asia on Friday and holding just above 1.1200 handle, awaiting key release of the day, US Non-Farm payrolls data.
Forecast for NFP shows that US economy created 185.000 new jobs in May, which is below last month’s 211.000, however, numbers are seen solid and release at/above forecasted level would further strengthen expectations of US rate hike in June.
The notion is supported by upbeat US private sector jobs report that was released on Thursday and showed 253.000 jobs added in private sector in May, compared to 185.000 forecasted.
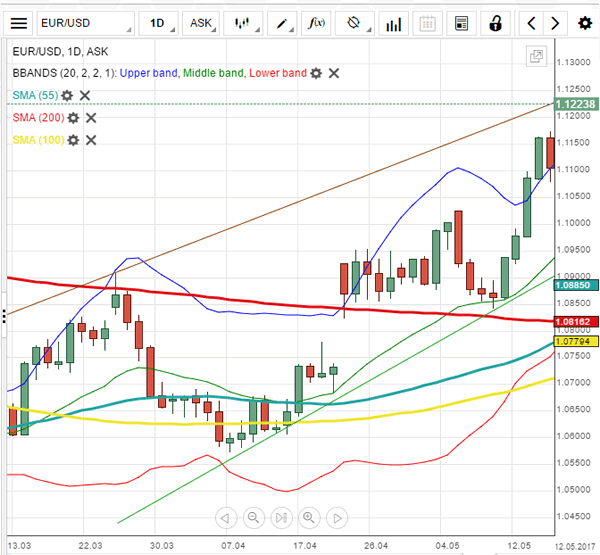
Overall bullish structure favors further upside and final break above 2017 high at 1.1268 for resumption of broader uptrend which was paused for 1.1268/1.1109 consolidation.
Near-term action remains supported by 10SMA (1.1204) which keeps immediate focus at the upside, with break above 1.1268 to open next targets at 1.1300/13.
However, extended daily studies keep in play the risk of fresh weakness on repeated rejection under 1.1286 pivot.
Such scenario requires firm break of 1.1200 support, to generate stronger bearish signal and expose key near-term support at 1.1100 (consolidation low / Fibo 38.2% of 1.0820/1.1268 upleg / rising 20SMA), loss of which would signal double-top and reversal.
Initial resistance lies at 1.1227 (hourly cloud top), ahead of 1.1256/68 pivots.
Res: 1.1227, 1.1256, 1.1268, 1.1300
Sup: 1.1204, 1.1188, 1.1160, 1.1100
Elliott Wave Analysis: A Reversal Is Underway On GBPUSD
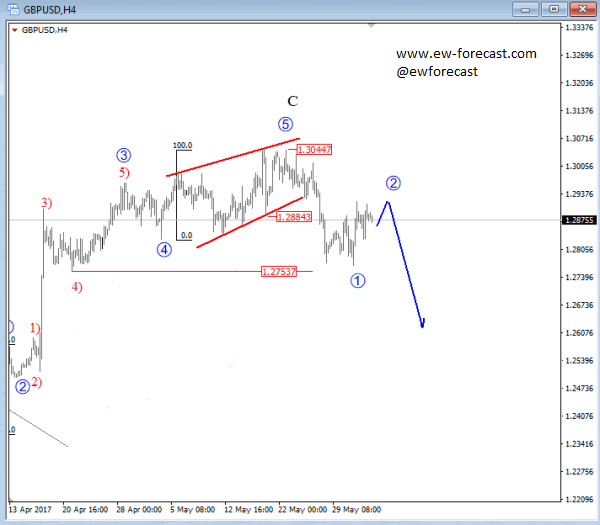
On the updated 4h chart of GBPUSD, we can see that prices came lower last week with some aggressive decline on Friday to 1.2750-1.2800 area. Move can be impulsive, so we are considering idea of a top in place, thus more weakness may extend to much lower levels this week, especially after a wave 2 bounce. That said, any stronger rise back above 1.3012 may put bullish trend back in play.
GBPUSD, 4H