

Sample Category Title
Trade Idea Wrap-up: GBP/USD – Stopped profit and stand aside
GBP/USD - 1.2900
Most recent candlesticks pattern : N/A
Trend : Near term down
Tenkan-Sen level : 1.2870
Kijun-Sen level : 1.2876
Ichimoku cloud top : 1.2829
Ichimoku cloud bottom : 1.2827
Original strategy :
Sold at 1.2910, stopped profit at 1.2900
Position : - Short at 1.2910
Target : -
Stop : - 1.2900
New strategy :
Stand aside
Position : -
Target : -
Stop : -
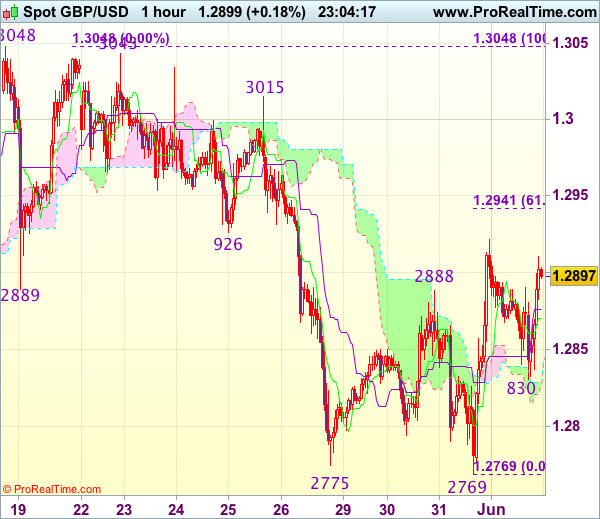
As cable found renewed buying interest at 1.2830 and has rebounded again, suggesting low has been formed at 1.2769 earlier this week, hence consolidation with upside bias is seen for test of 1.2921-26 (resistance and previous support), break there would add credence to this view, bring further gain to 1.2940-45 (61.8% Fibonacci retracement of 1.3048-1.2769) and later towards 1.2970 but near term overbought condition should cap upside below 1.3000.
On the downside, below 1.2865-70 would bring test of said support at 1.2830 but break there is needed to revive bearishness for weakness to 1.2800, then towards said this week’s low at 1.2769 which is likely to hold from here. As near term outlook is mixed, would be prudent to stand aside for now.
The Expansion in U.S. Manufacturing Activity Remains Stable in May
The Institute for Supply Management (ISM) manufacturing index registered a 0.1 point uptick in May to 54.9. This was better than the consensus forecast of a decline to 54.5 from April's reading of 54.8. May was the ninth consecutive month of expansion for the U.S. manufacturing sector.
Moves in the subcomponents of the index were split evenly, with half of the ten subcomponents rising and the other half falling in the month. Some of the biggest moves higher included customers' inventories (+4.0 to 49.5), new orders (+2.0 to 59.5), and employment (+1.5 to 53.5). The subcomponent that recorded the largest decline in the month was prices (-8 to 60.5), while other subcomponents (supplier deliveries, backlog of orders, new export orders, and imports) all registered declines of 2.0 points and remained firmly in expansion territory.
The greater uptick in new orders relative to inventories pushed the spread between the two - useful as a leading indicator of activity - up to 8 from 6.5 in April. This is consistent with the view that manufacturing activity should continue to expand at its current or slightly faster pace in upcoming months.
Of eighteen manufacturing industries, fifteen reported growth in May, two reported contractions, and one was unchanged. Nonmetallic mineral products, furniture and related products, and plastic and rubber product industries all registered the strongest rates of expansion in the month. The two industries that reported contraction in output in May are apparel, leather and allied products, and textile mills.
Key Implications
This morning's data confirms that the U.S. manufacturing sector continues to perform well in the second quarter of the year. Almost all subcomponents (with the exception of customers' inventories) remain firmly in expansionary territory, and the partial recovery in new orders and employment from large declines in April can be interpreted as a sign of a resilience. Comments by survey respondents remained broadly positive, and have moved to include concerns about finding qualified labour as well as citing rising prices and political environment as sectoral challenges.
Although the U.S. manufacturing sector is still expanding, it will continue to face a number of challenges. Elevated policy uncertainty both globally and domestically, particularly concerning any upcoming changes to U.S. trade agreements, could affect demand for U.S. manufactured goods. Short of this, exporters will continue to face competitiveness pressures from the elevated level of the U.S. dollar, which have eased recently, and foreign demand that may be on the wane.
Increasingly there are signs that global demand growth has peaked. After a strong expansion in the first four months of the year, a slowing Chinese economy appears to be affecting its East Asian trading partners. The overnight release of the Caixin Purchasing Managers' Index (PMI) for China revealed that the Chinese manufacturing sector pulled back in May - the first decline in 11 months. Furthermore, PMI's for Taiwan, Thailand, Vietnam, and Malaysia all recorded much softer manufacturing activity in May, suggesting that weakening Chinese demand is beginning to have knock on effects on some of China's neighbouring trade partners.
Still, there are some bright spots concerning second quarter global economic activity worth noting. This morning's May PMI's for advanced economies suggests that the Euro Area should continue to see broad growth near 2.0% (q/q annualized) in the second quarter - almost double trend pace - and Japanese manufacturing activity continues to expand at a rapid pace. Moreover, unlike the weak prints in East Asia, the news from Latin America was more positive. The Brazilian economy appears to have exited recession in the first quarter, and the May PMI data shows a modest expansion in the manufacturing sector in the second quarter. Nevertheless, volatility in trade data could see Brazil fall back to contraction in the second quarter, and political uncertainty could still act to derail its economic recovery.
Gold Edges Lower as ADP Nonfarm Payrolls Sparkles
Gold prices have dipped lower in the Thursday session. In North American trade, spot gold is trading at $1263.22 an ounce. It's a very busy day on the release front. US employment numbers were mixed, as the ADP Nonfarm Employment Changed jumped to 253 thousand, easily beating the estimate of 181 thousand. Unemployment claims was softer than expected, climbing to 248 thousand. The markets had forecast a reading of 239 thousand. On the manufacturing front, the ISM Manufacturing PMI was almost unchanged at 54.9, which was slightly above the estimate of 54.7 points. On Friday, employment data will again be in the spotlight, as the US releases three key events – the official Nonfarm Payrolls report, wage growth, and the unemployment rate. Traders should be prepared for some movement in gold prices in the North American session, following the release of the these indicators.
Although the US economy slowed down in the first quarter of 2017, the markets are confident that the Federal Reserve remains on track to raise interest rates at its policy meeting on June 14. with the odds of a 0.25% hike priced in at 89%. As for the second half of 2017, the likelihood of rate move is significantly lower. The odds for a September rate stand at just 26%, with the markets skeptical as to whether the Fed will make further moves this year if inflation remains below the Fed target. Low inflation levels have Janet Yellen and her colleagues scratching their heads, as a red-hot labor market, with an unemployment rate at just 4.4%, has failed to trigger higher inflation levels. With the next rate decision just less than two weeks away, the markets will be glued to any comments from Fed policy makers, and any clues from the Fed about its rate plans could have a significant impact on gold prices.
Trade Idea Wrap-up: EUR/USD – Hold long entered at 1.1205
EUR/USD - 1.1219
Most recent candlesticks pattern : N/A
Trend : Up
Tenkan-Sen level : 1.1224
Kijun-Sen level : 1.1230
Ichimoku cloud top : 1.1201
Ichimoku cloud bottom : 1.1176
Original strategy :
Bought at 1.1205, Target: 1.1305, Stop: 1.1170
Position : - Long at 1.1205
Target : - 1.1305
Stop : - 1.1170
New strategy :
Hold long entered at 1.1205, Target: 1.1305, Stop: 1.1170
Position : - Long at 1.1205
Target : - 1.1305
Stop : - 1.1170
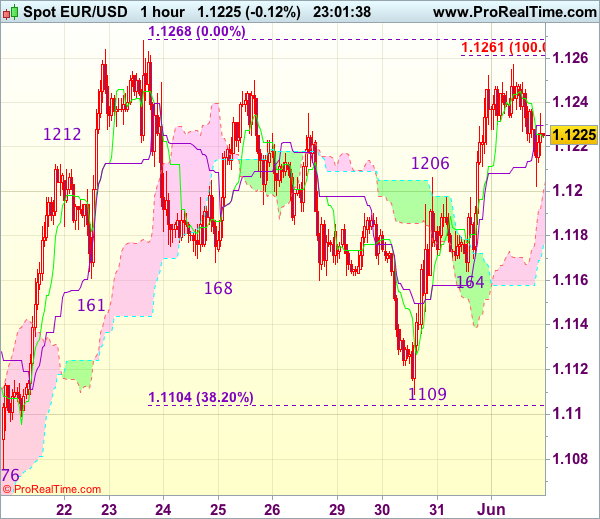
As the single currency has retreated after marginal rise to 1.1257 earlier today, suggesting consolidation below this level would be seen, however, reckon the upper Kumo (now at 1.1184) would limit downside and bring another rise later, above said resistance at 1.1257 would extend gain to previous resistance at 1.1268, break there would confirm early upmove has resumed and test of another previous chart resistance at 1.1300 would follow, above there would encourage for headway to 1.1340-45, however, overbought condition should limit upside to chart point at 1.1366.
In view of this, we are holding on to our long position entered at 1.1205. Only below support at 1.1164 (yesterday’s low) would abort and suggest a temporary top is formed instead, risk weakness to 1.1140 but said support at 1.1109 should remain intact, bring rebound later.
Trade Idea Wrap-up: USD/JPY – Buy at 110.85
USD/JPY - 111.25
Most recent candlesticks pattern : N/A
Trend : Near term down
Tenkan-Sen level : 111.21
Kijun-Sen level : 110.98
Ichimoku cloud top : 110.98
Ichimoku cloud bottom : 110.87
New strategy :
Buy at 110.85, Target: 111.85, Stop: 110.50
Position : -
Target : -
Stop : -
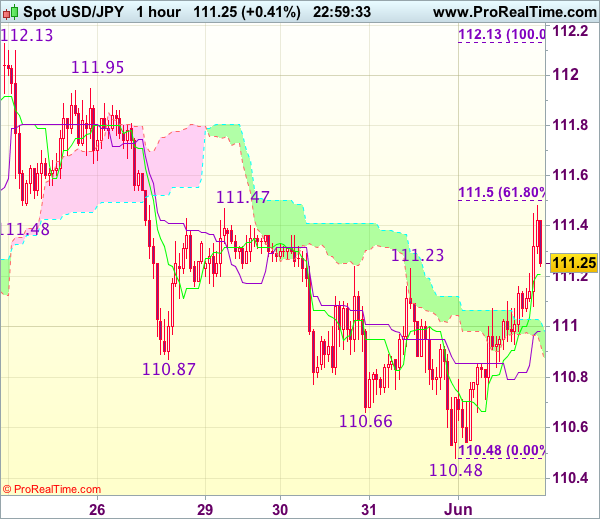
Current breach of indicated resistance at 111.23-24 signals low has indeed been formed at 110.48 and near term upside risk remains for a strong retracement of the fall from 112.13, hence gain to 111.50 (61.8% Fibonacci retracement of 112.13-110.48), then 111.70 is likely, however, as broad outlook remains consolidative, reckon upside would be limited to resistance at 111.95 and price should falter below another previous resistance at 112.13, bring retreat later.
In view of this, we are looking to buy dollar on pullback as 110.80-85 should limit downside. Only below support at 110.48 would extend recent decline to another previous support at 110.24, break there would bring subsequent selloff to 110.00 which is likely to hold on first testing.
Elliott Wave Analysis: NZDUSD Intraday View
NZDUSD is making a potential reversal from the top, with blue wave a in the making. If everything goes as expected, then a three wave move to the downside will unfold in sessions ahead. That said, the later blue wave c can reach region at 0.6988 where previous swing low of wave four could offer some resistance and slow weakness down.
NZDUSD, 1H

Trade Idea: EUR/GBP – Sell at 0.8735 or buy at 0.8600
EUR/GBP - 0.8700
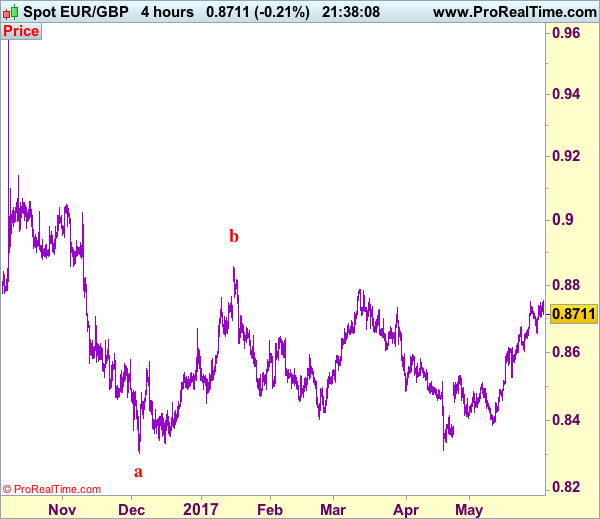
Recent wave: Major double three (A)-(B)-(C)-(X)-(A)-(B)-(C) is unfolding and 2nd (A) has possibly ended at 0.6936.
Trend: Near term up
Original strategy :
Buy at 0.8620, Target: 0.8750, Stop: 0.8580
Position : -
Target : -
Stop : -
New strategy :
Sell at 0.8735, Target: 0.8610, Stop: 0.8775
O.C.O.
Buy at 0.8600, Target: 0.8750, Stop: 0.8565
Position : -
Target : -
Stop : -
As the single currency has retreated after marginal rise to 0.8755, suggesting a temporary top is possibly formed and consolidation below this level is seen with mild downside bias for test of 0.8655 support, break there would add credence to this view, bring retracement of recent rise to 0.8620-25, then test of 0.8600-03 support where renewed buying interest should emerge, bring another rise later. Above said resistance at 0.8755 would extend recent rise from 0.8312 low to 0.8770, then test of resistance at 0.8788, however, reckon upside would be limited to 0.8800-10.
In view of this, whilst we are still looking to buy euro on dips, we would also sell euro on recovery as 0.8730-35 should limit upside. Below 0.8565-70 would abort and signal a temporary top is formed, bring correction to 0.8550 and possibly towards support at 0.8524 which is likely to hold from here.
Our preferred count is that, after forming a major top at 0.9805 (wave V), (A)-(B)-(C) correction is unfolding with (A) leg ended at 0.8400 (A: 0.8637, B: 0.9491 and 5-waver C ended at 0.8400. Wave (B) has ended at 0.9413 and impulsive wave (C) has either ended at 0.8067 or may extend one more fall to 0.8000 before prospect of another rally. Current breach of indicated resistance at 0.9043 confirms our view that the (C) leg has ended and bring stronger rebound towards 0.9150/54, then towards 0.9240/50.
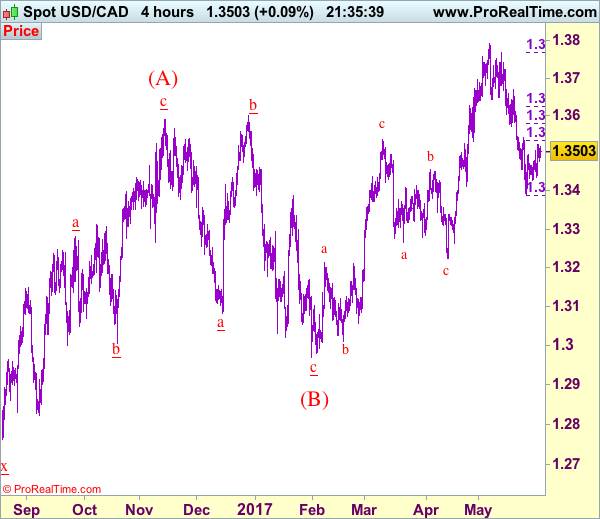
Trade Idea: USD/CAD – Sell at 1.3550
USD/CAD - 1.3492
Recent wave: Only wave v of c has ended at 0.9407 and wave C of major A-B-C correction is underway for headway to 1.4700
Trend: Near term up
Original strategy :
Sell at 1.3540, Target: 1.3340, Stop: 1.3600
Position: -
Target: -
Stop: -
New strategy :
Sell at 1.3550, Target: 1.3350, Stop: 1.3610
Position: -
Target: -
Stop:-
Although the rebound from 1.3387 (last week’s low) suggests consolidation above this level would be seen and corrective bounce to 1.3530-35 (38.2% Fibonacci retracement of 1.3770-1.3387) cannot be ruled out, however, reckon upside would be limited to resistance at 1.3540-50 and bring another decline, below said support at 1.3387 would extend the fall from 1.3794 top for further weakness to 1.3350, then towards 1.3300 but loss of near term downward momentum should prevent sharp fall below 1.3250-60, risk from there has increased for a rebound to take place later.
In view of this, would be prudent to sell on further recovery as 1.3540 resistance should limit upside, bring another decline. Above 1.3571-79 (previous support and 50% Fibonacci retracement of 1.3770-1.3387) would defer and suggest a temporary low is formed instead, risk a stronger rebound to 1.3600 but still reckon resistance at 1.3670 would remain intact.
To recap, wave B from 1.3066 is unfolding as an a-b-c and is sub-divided as a: 1.2192, b: 1.2716 and wave c is a 5-waver with i: 1.1983, ii: 1.2506, extended wave iii with minor iii at 1.0206, wave iv ended at 1.0781 and wave v as well as wave iii has ended at 0.9931, hence the subsequent choppy trading is the wave iv which is unfolding as (a)-(b)-(c) with (a) leg of iv ended at 1.0854, followed by (b) leg at 1.0108 and (c) leg as well as the wave iv ended at 1.0674. The wave v is sub-divided by minor wave (i): 0.9980, (ii): 1.0374, (iii): 0.9446, (iv): 0.9913 and (v) as well as v has possibly ended at 0.9407, therefore, consolidation with upside bias is seen for major correction, indicated target at 1.3700 and 1.4000 had been met and further gain to 1.4700 would be seen later.
Technical Outlook: Oil Price Remains at the Back Foot
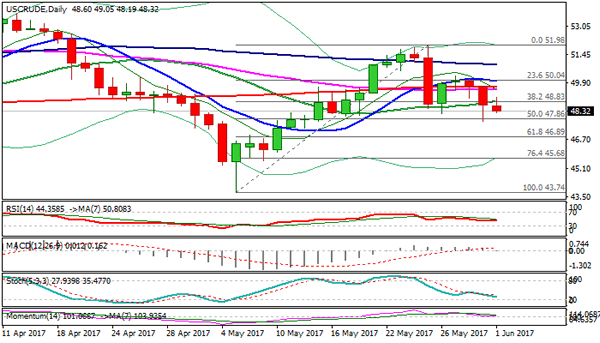
US oil price remains at the back foot on Thursday but holding above Wednesday's spike low at $47.72, where two day fall was contained by daily Kijun-sen line. Long tail of yesterday's candle signaled strong downside rejection that may trigger extended consolidation. Upside attempts stalled at $49.05, after false break above initial 20SMA barrier at $48.85, keeping daily MA's in bearish setup. Oil is awaiting release of US weekly Crude Stocks data for fresh signals. Forecast for 2.5 million barrels draw is well below previous week's 4.4 million barrels draw and may put oil price under increased pressure on release at/below consensus. Daily Kijun-sen marks pivotal support and close below it may trigger fresh bearish acceleration towards $46.89 (Fibo 61.8% of $43.74/$51.98 rally. Conversely, close above 20SMA would ease persisting downside pressure and expose a cluster of strong barriers between $49.50 and $50.00.
Res: 48.85; 49.05; 49.50; 50.00
Sup: 48.19; 47.86; 47.35; 46.89
USD Decline Halts Ahead of Key US Eco Data
- European equity markets gain up to 0.5% today amid a nearly completely empty EMU eco calendar. US stock markets opened marginally stronger as well after an upbeat ADP report.
- ADP employment growth beat expectations in May, rising by 253k (vs 180k expected). Weekly jobless claims unexpectedly ticked up from 235k to 248k, but remain near historically low levels. The US manufacturing ISM nearly stabilised as expected at 54.9, but the "prices paid" component unexpectedly declined from68.5 to 60.
- Inflation in the US is likely to rise further following its recent pause given strong spending numbers and the tightening labour market, Washington-based Fed Governor Powell said as he advocated continued monetary policy tightening. He said the risks to the Fed's outlook were as balanced as they have been in some time.
- UK manufacturing activity maintained its momentum in May and confidence rose as strong domestic demand buoyed orders. The PMI printed at 56.7 (vs. 56.5 consensus) in May after reaching 57.3 in April, which was the highest in 3 years. The final May EMU manufacturing PMI was confirmed at 57.0.
- Brussels and Italy have agreed on a rescue of the troubled Monte dei Paschi di Siena bank, outlining a draft plan that involves significant cost cuts, some investors taking a hit on bonds and top management accepting a cap on pay. The agreement is conditional on approval from the ECB.
Rates
US Treasuries lose ground after strong ADP report
Global core bond lost some ground today with US Treasuries underperforming following a strong ADP-report. Ahead of the release, bond trading was subdued and confined to tight ranges. Positive risk sentiment on European stock markets and lower oil price didn't impact trading. At the time of writing, US yields shift 2.4 bps to 3.2 bps higher, the belly of the curve underperforming the wings. Changes on the German yield curve range between +1 bp and +1.8 bps. On intra-EMU bond markets, 10-yr yield spread changes versus Germany are nearly unchanged with Italy/Greece underperforming (+4 bps) and Portugal outperforming (-5 bps).
ADP reported net job growth of 253k in May from 174k in April and against 180k consensus. It bodes well for tomorrow's payrolls. Weekly jobless claims unexpectedly ticked up, but remain below 250k en near historically low levels. The US manufacturing stabilised as expected at 54.9, but the prices paid component of the report disappointed. Washington-based Fed governor Powell, usually sparse with comments, sounded upbeat on the economy. He predicts a further rise in inflation after the current pause given strong spending and a tightening labour market. According to Powell, the Fed is as close to its assigned goals as it has been for many years. That warrants a continuation of the tightening cycle (in June?!) and the start of the balance sheet run-off later this year.
The French debt agency sold three OAT's for a combined €8.27B, near the upper end of the targeted €7.5-8.5B: €5.08B 1% May2027, €1.72B 5.75% Oct2032 and €1.47B 1.75% Jun2039. The auction bid cover was 1.8, which is rather low for French norms. Apparently some investors take a cautious approach ahead of the parliamentary elections. The Spanish Tesoro launched a new 3-yr Bono (€2.7B 0.05% Jan2021) and tapped the 50-yr Obligacion (€1.44B 3.45% Jul2066). The total amount sold (€4.14B) was in the upper bound of the eyed €3.5-4.5B. The auction bid cover was 1.72 with main interest to the Jan2021 Bono.
Currencies
USD decline halts ahead of key US eco data
The dollar started the session close to the recent lows against the euro and the dollar. The EMU data were OK, but not strong enough to push EUR/USD to a new short-term correction top. Interest rate differentials between the dollar and the euro didn't narrow anymore and the dollar profited slightly from strong ADP private job growth. EUR/USD dropped to the low 1.12 area. USD/JPY tries to make further headway north of 111, awaiting tomorrow's payrolls.
Overnight, country specific issues dominated trading in Asia. Positive capital spending data and corporate profits supported Japanese equities. The yen stayed strong despite positive risk sentiment. USD/JPY hovered in the 111 area. The moves in euro were limited, but EUR/USD maintained yesterday's gains and hovered within reach of the 1.1268 resistance.
European markets opened with a cautious risk-on bias as equities copied the late session rebound in the US yesterday. The May EMU manufacturing PMI was confirmed at 57.00. Italian growth was also revised higher from 0.2% Q/Q to 0.4% Q/Q. However, it wasn't enough to inspire further EUR/USD gains beyond the 1.1268 resistance. Moves on the bond markets were limited. If anything, interest rate differentials didn't narrow further in favour of the euro. EUR/USD gradually lost a few ticks during the morning session and settled in the mid 1.12 area. The dollar regained a few ticks against the yen and tried to recapture the 111 big figure.
Early in US dealings, the ADP labour market report printed at 253 000 additional jobs in the US private sector while 180 000 was expected. The dollar gained some further ground, but investors remain cautious to position for a protracted USD uptrend just hours before the US manufacturing ISM and ahead of tomorrow's key Payrolls report. The latter will probably decide whether there is room for a sustained USD rebound. EUR/USD is changings hands in the low 1.12 area going in the publication of the US ISM. USD/JPY rebounded to the 111.35/40 area. The US manufacturing ISM was very close to expectations. A soft prices paid sub-index might be marginally USD negative.
Sterling continues trading nervously on political jitters
The UK elections remain the key driver for sterling trading. The UK manufacturing PMI declined less than expected from 57.00 to 56.7, indicating ongoing good growth in the sector. However the impact on sterling trading was negligible. In technical trade, EUR/GBP even touched a minor short-term top in the 0.8755 area, but no clear break occurred. Most election polls still indicated a lead for PM May's conservative party, but the lead is declining. After the recent substantial sterling losses, some consolidation seems to kick in. EUR/GBP hovers in the lower half of the 0.87 big figure. Cable is changing hands in the mid 1.28 area as the countdown to June 08 continues.