Sample Category Title
USD/CHF Daily Outlook
Daily Pivots: (S1) 0.9707; (P) 0.9722; (R1) 0.9745; More.....
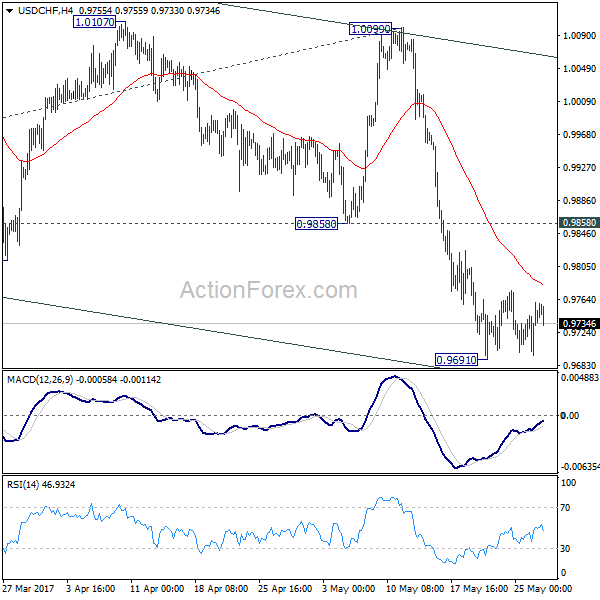
Intraday bias in USD/CHF remains neutral at this point. Consolidation from 0.9691 could extend and stronger recovery cannot be ruled out. But upside should be limited by 0.9858 support turned resistance and bring fall resumption. Whole decline from 1.0342 is still in progress and below 0.9691 will target 100% projection of 1.0342 to 0.9860 from 1.0099 at 0.9617. We'll start to look for reversal signal below there.
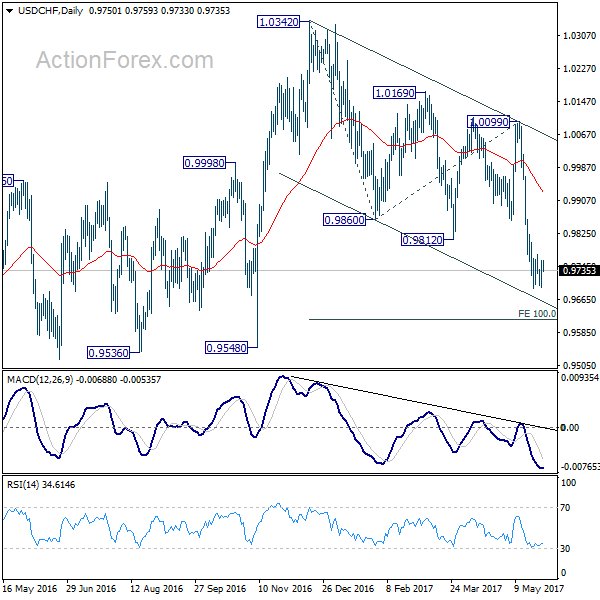
In the bigger picture, USD/CHF is bounded in medium term range of 0.9443/1.0342 for the moment. Consolidative trading would likely continue and medium term outlook remains neutral. Break of 1.0342 key resistance is needed to confirm underlying bullish momentum in the pair. Meanwhile, downside attempts should be contained by 0.9443 key support level.
Technical Outlook: EURUSD – Risk Of Extended Pullback On Break Below 10SMA
The Euro was in red in Asia on Monday, probing below rising 10SMA (1.1173) and pressuring Friday's low at 1.1160.
Near-term studies turned negative and keep the downside at risk as slow stochastic on daily chart is heading south and showing more room at the downside.
Also, red weekly candle with long upper shadow weighs on near-term action.
Firm break below Friday's low would risk extension towards next key support at 1.1100 (Fibo 38.2% of 1.0839/1.1268 upleg) where extended correction should be ideally contained.
The pair is currently ridding on the fourth (corrective) wave of five-wave cycle from 1.0820 (24 Apr low) which should ideally end at 1.1100 zone and support scenario of fresh upside attempts after correction as overall structure is bullish.
Upside targets remain at 1.1268 (23 May high) and 1.1299 (09 Nov 2016) post US election high).
Alternatively, firm break below 1.1100 pivot would risk deeper correction and expose Fibo supports at 1.1053 and 1.1000.
ECB President Mario Draghi is due to speak later today and may move the pair if he says something new and apart from his usual rhetoric.
Res: 1.1183, 1.1234, 1.1250, 1.1268
Sup: 1.1160, 1.1100, 1.1086, 1.1053
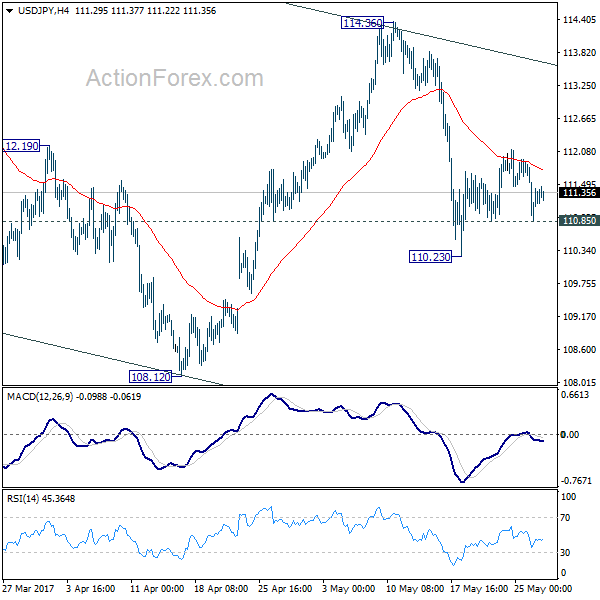
USD/JPY Daily Outlook
Daily Pivots: (S1) 110.84; (P) 111.34; (R1) 111.82; More...
Intraday bias in USD/JPY remains neutral at this point. Rise from 110.23 is seen as a correction and the larger fall is expected to resume later. On the downside, below 110.85 minor support will turn bias to the downside to extend the fall from 114.36 to 108.12 low. Break there will resume the whole decline from 118.65. In that case, we'll look for bottoming signal again at 61.8% retracement of 98.97 to 118.65 at 106.48.
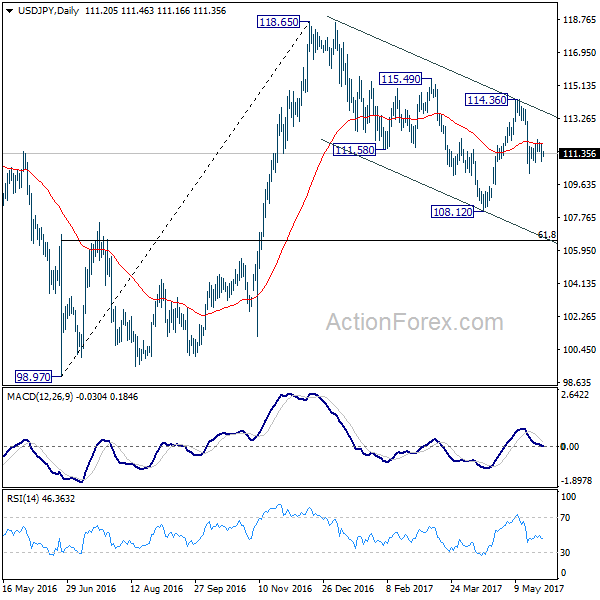
In the bigger picture, price actions from 125.85 high are seen as a corrective pattern. It's uncertain whether it's completed yet. But in case of another fall, downside should be contained by 61.8% retracement of 75.56 to 125.85 at 94.77 to bring rebound. Overall, rise from 75.56 is still expected to resume later after the correction from 125.85 completes.
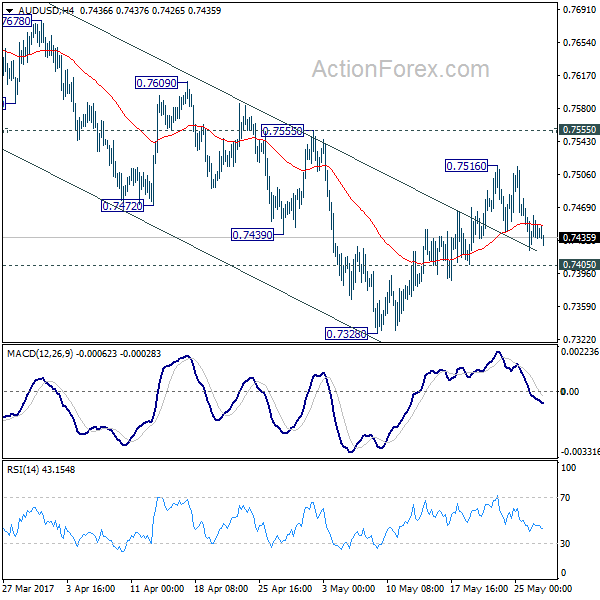
AUD/USD Daily Outlook
Daily Pivots: (S1) 0.7423; (P) 0.7441; (R1) 0.7462; More...
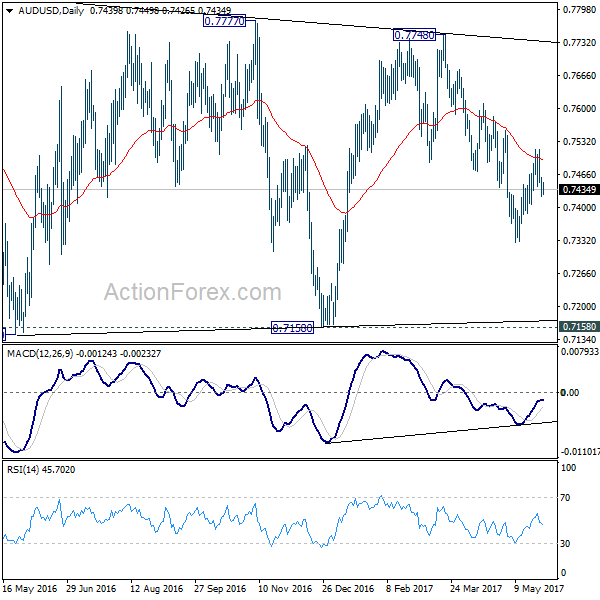
Intraday bias in AUD/USD remains neutral for the moment. Overall, as long as 0.7555 resistance holds, fall from 0.7748 is still expected to continue. Below 0.7405 minor support will turn bias to the downside for 0.7382. Break there will target 0.7144/7158 support zone. However, firm break of 0.7555 will argue that fall from 0.7748 is completed and turn bias back to the upside.
In the bigger picture, we're still treating price actions from 0.6826 low as a corrective pattern. And, as long as 38.2% retracement of 0.9504 to 0.6826 at 0.7849 holds, long term down trend from 1.1079 is expected to resume sooner or later. Break of 0.6826 low will target 0.6008 key support level. However, firm break of 0.7849 will indicate that rise from 0.6826 is developing into a medium term rebound, rather than a sideway pattern. In such case, stronger rise should be seen to 55 month EMA (now at 0.8115) and above.
USD/CAD Daily Outlook
Daily Pivots: (S1) 1.3420; (P) 1.3458; (R1) 1.3485; More....
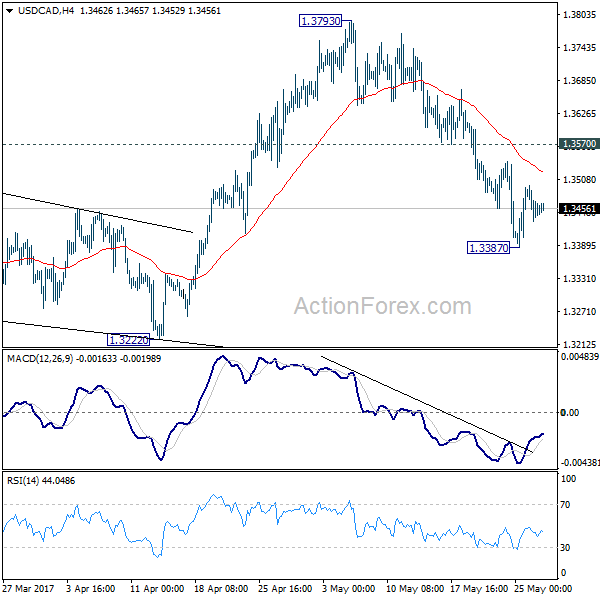
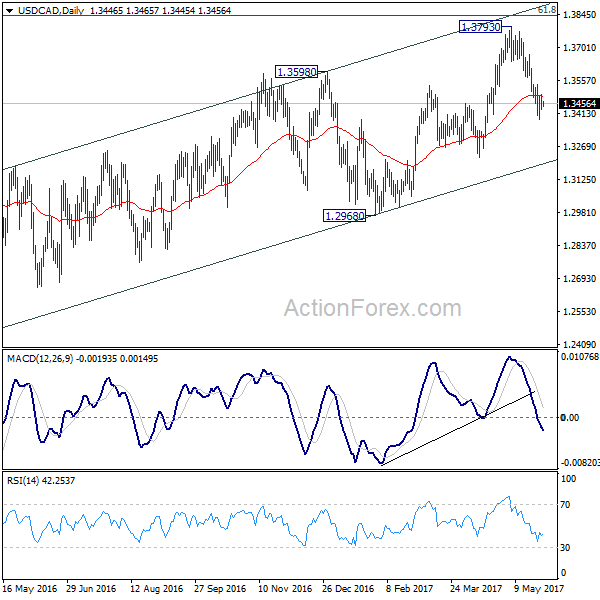
Intraday bias in USD/CAD remains neutral for the moment. Some consolidation would be seen above 1.3387 temporary low. But upside of recovery should be limited by 1.3570 resistance and bring fall resumption. At this point, we're still favoring the case that rise from 1.2968 has completed. And the larger rise from 1.2460 could have finished too. Below 1.3387 will target 1.3222 support first. Break of 1.3222 will affirm our bearish view and target 1.2968 key support level for confirmation. However, break of 1.3570 will turn focus back to 1.3793 high instead.
In the bigger picture, price actions from 1.4689 medium term top are seen as a correction pattern. The first leg has completed at 1.2460. Rise from 1.2460 is seen as the second leg and could have completed at 1.3793, ahead of 61.8% retracement of 1.4689 to 1.2460 at 1.3838. Break of 1.3222 should indicate the start of the third leg while further break of 1.2968 should confirm. Nonetheless, sustained trading above 1.3838 would pave the way to retest 1.4689 high.
EUR/AUD Daily Outlook
Daily Pivots: (S1) 1.4953; (P) 1.5032; (R1) 1.5083; More...
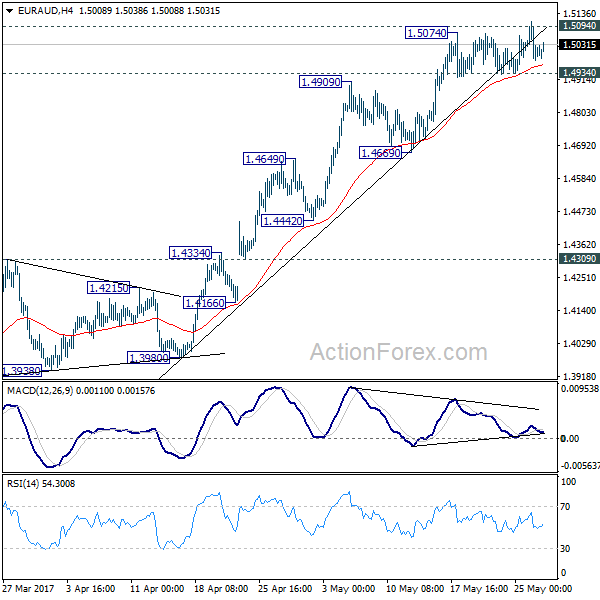
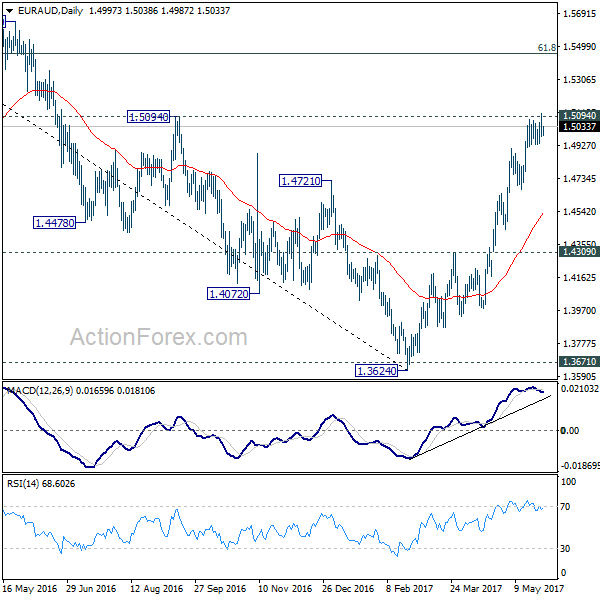
Intraday bias in EUR/AUD remains neutral for the moment. As long as 1.4934 minor support holds, further rise is still expected in the cross. Firm break of 1.5094 resistance will extend the rally from 1.3624 to next medium term fibonacci level at 1.5455. However, considering bearish divergence condition in 4 hour MACD, break of 1.4934 support will confirm short term topping and bring deeper pull back, possibly to 55 day EMA (now at 1.4540).
In the bigger picture, price actions from 1.6587 medium term top are viewed as a corrective pattern. Such correction should be completed at 1.3624 after defending 1.3671 key support. Rise from 1.3642 is now expected to target 61.8% retracement of 1.6587 to 1.3624 at 1.5455 and above. In any case, outlook will now stay cautiously bullish as long as 1.4309 resistance turned support holds.
EUR/GBP Daily Outlook
Daily Pivots: (S1) 0.8642; (P) 0.8655; (R1) 0.8673; More...
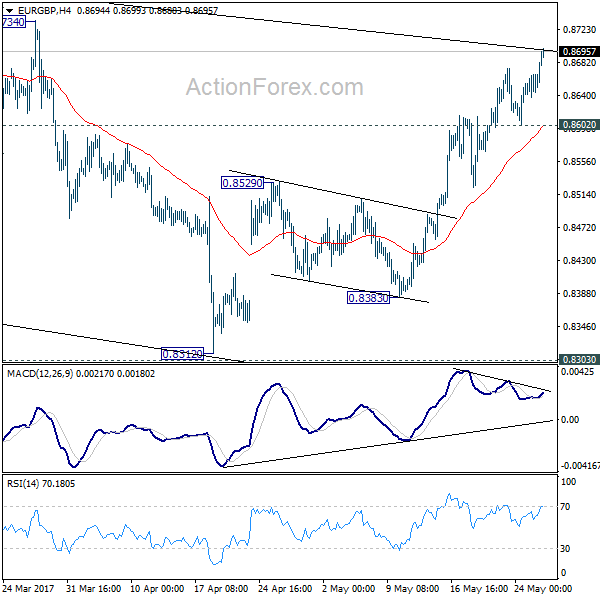
A temporary top is in place at 0.8750 and intraday bias in EUR/GBP is turned neutral for consolidations. Near term outlook stays mildly bullish as long as 0.8602 support holds and further rally would be seen. Above 0.8750 will target 0.8786 resistance first. Break of 0.8786 would pave the wave for retesting 0.9304 high. Break of 0.8602, however, will argue that the rebound from 0.9312 has completed and turn bias back to the downside for 0.8529 first.
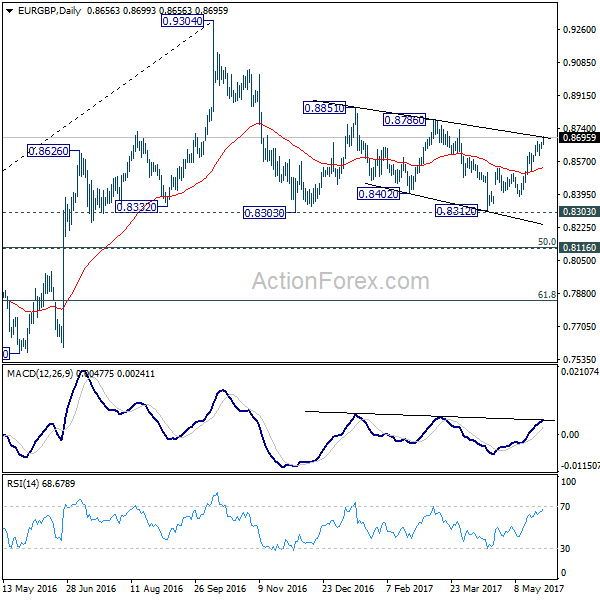
In the bigger picture, price actions from 0.9304 are viewed as a medium term corrective pattern. The leg from 0.9304 should have completed after taking 0.8332 structural support. But it's too early to say that larger rise from 0.6935 is resuming. Rejection from 0.9304 will extend the consolidation with another falling leg. Meanwhile, firm break of 0.9304 will target 0.9799 (2008 high). In case of another decline, we'd expect strong support from 0.8116 cluster support (50% retracement of 0.6935 to 0.9304 at 0.8120) to contain downside and bring rebound.
EUR/CHF Daily Outlook
Daily Pivots: (S1) 1.0876; (P) 1.0893; (R1) 1.0907; More...
Intraday bias in EUR/CHF remains neutral as consolidation from 1.0986 continues today. Deeper fall could be seen but downside should be contained by 1.0791/0872 support zone to bring rise resumption. As noted before, the consolidative pattern from 1.1198 should be completed. Firm break of 1.0999 resistance will pave the way for a retest on 1.1198 high.
In the bigger picture, the price actions from 1.1198 are seen as a corrective move. Current strong rebound is raising the chance that it's completed after defending 38.2% retracement of 0.9771 to 1.1198 at 1.0653. Decisive break of 1.0999 resistance will target a test on 1.1198 high. For now, this will be the preferred case as long as 1.0791 support holds.


GBP/JPY Daily Outlook
Daily Pivots: (S1) 141.48; (P) 143.10; (R1) 144.08; More....
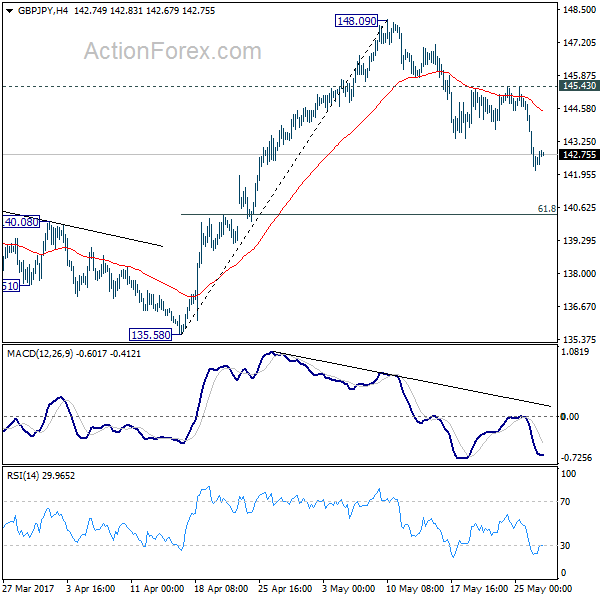
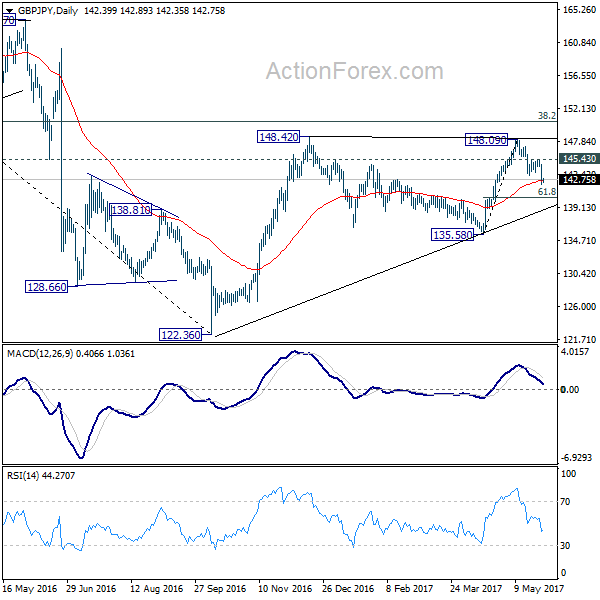
Intraday bias in GBP/JPY remains on the downside for 61.8% retracement of 135.58 to 148.09 at 140.35. At this point, we'd still expect rebound from 122.36 to resume later. Hence, we'd look for strong support below 140.35 to contain downside and bring rebound. On the upside, above 145.43 resistance will turn bias back to the upside for retesting 148.09 first.
In the bigger picture, rise from 122.36 medium term bottom is still expected to extend to of 195.86 to 122.36 at 150.42. And decisive break there could pave the way to 61.8% retracement at 167.78. However, as the cross is starting to lose upside momentum, rejection below 150.42 and break of 135.58 support will indicate reversal and bring deeper fall back to retest 122.36 instead.
EUR/JPY Daily Outlook
Daily Pivots: (S1) 123.92; (P) 124.66; (R1) 125.17; More...
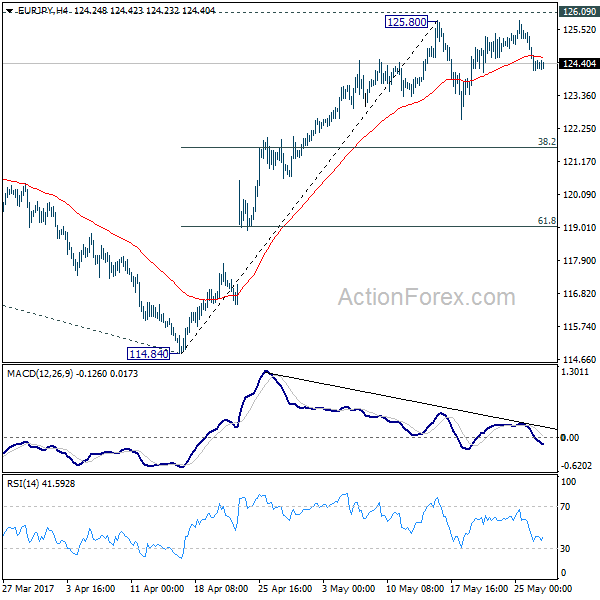
Intraday bias in EUR/JPY remains neutral for the moment as consolidation from 125.80 continues. Deeper fall cannot be ruled out. But downside should be contained by 38.2% retracement of 114.84 to 125.80 at 121.61 to bring rise resumption. We're staying mildly bullish in the cross. And, break of 126.09 key resistance will extend the whole rebound from 109.03 to 100% projection of 109.03 to 124.08 from 114.84 at 129.89.
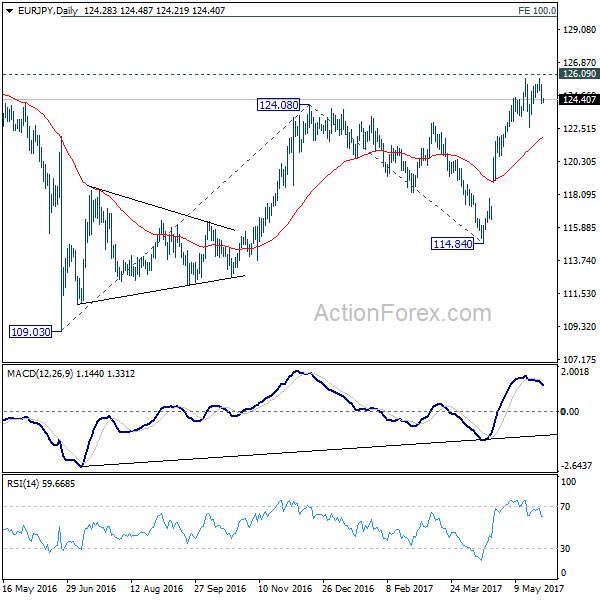
In the bigger picture, focus is back on 126.09 support turned resistance. Decisive break there will confirm completion of the down trend from 149.76. And in such case, rise from 109.20 is at the same degree and should target 141.04 resistance and above. Meanwhile, rejection from 126.09 and break of 114.84 will extend the fall from 149.76 through 109.20 low.