
Sample Category Title
Yen Flat Ahead of Japanese Consumer Spending Reports
USD/JPY is showing little movement in the Monday session, and with US markets closed for Memorial Day, that trend is likely to continue during the day. There are no US releases on the schedule. Japan will publish two consumer spending reports – household spending and retail sales. On Tuesday, the US releases CB Consumer Spending.
Japan's economy has looked solid early in 2017, as GDP in the first quarter expanded at an annualized rate of 2.2%. As stronger global economy has increased demand for Japanese products, which has been a boon for the Japanese manufacturing and export sectors. Still, the markets aren't expecting the Bank of Japan to tighten its ultra-accommodative monetary policy any time soon, despite a more robust economy. The reason? Inflation levels remains stubbornly low, well below the central bank's target of 2.0%. Consumer spending remains soft and wages actually contracted in the first quarter, compared to Q4 of 2016. Unless wages and consumer spending improves and raises inflation, the BoJ is likely to sit tight and hold course with its quantitative easing program and low interest rates. A stronger Japanese economy has rubbed off on the Japanese yen, as USD/JPY has slipped 4.9% since the start of the year.
The US economy slowed down considerably in the first quarter of 2017, but there was some good news on Friday, as GDP was revised upwards. The US economy expanded at an annual rate of 1.2%, considerably higher than the 0.7% gain which was reported in the first estimate in April. Still, this figure is the lowest in a year, and well below the 2.1% gain in Q4. Business spending remains weak, and although consumer confidence remains at high levels, consumer spending has not kept up, as retail sales was softer than expected in April. The manufacturing sector is showing signs of fatigue, with Core Durable Goods Orders posting a decline of 0.4% in April, its third decline in four months. After a shaky first quarter for the US economy, there are no indications as of yet that we will see a rebound in the second quarter. Is the Federal Reserve still on track for a rate hike in June? The markets remain confident that the Fed will act, as the odds of a rate increase in June have increased to 84%, according to the CME Group. At the same time, the likelihood of a rate hike in the second half of 2017 remain low. The odds for a September rate are just 26%, with the markets unclear on whether the Fed will make further moves this year if inflation remains below the Fed target. Even if soft first quarter data was a blip, the markets (and possibly Fed policymakers) are concerned that President Trump, who is facing several congressional investigations over his connections with the Russian government, may not be able to pass his agenda of cutting taxes and reigning in government spending.
Draghi Fails to Give Directional Guidance for the Euro
- European equities traded stable near opening levels in an uneventful session. US and UK markets were closed for Memorial Day and Spring Banking Holiday respectively. Italy underperformed as odds on a fall election increased and banking shares remained under pressure.
- "We remain firmly convinced that an extraordinary amount of monetary policy support, including through our forward guidance, is still necessary for the present level of underutilized resources to be re-absorbed and for inflation to return to and durably stabilize around levels close to 2% within a meaningful MT horizon," ECB Draghi said.
- Growth in bank loans to EMU companies set a fresh post-crisis high in April (2.4% Y/Y), even as a key money supply indicator(4.9% Y/Y), which often predicts future economic activity, dipped more than expected, ECB data showed. Lending to households meanwhile also grew by 2.4% Y/Y in April, the same level as a month earlier, when it hit its highest level since early 2009.
- Wage growth in the EMU will come, albeit with a lag, and generate more underlying inflation if the bloc's economic upswing continues, ECB Nowotny said. The ECB has repeatedly stressed that weak wage growth is keeping a lid on inflation and it should not remove stimulus until there is a convincing and durable upswing in underlying prices.
- Voting in fall around the same time as Germany would reduce market uncertainty about Italy, not increase it, former PM Renzi told Il Messaggero in an interview. Such rapid vote would be earlier than most market participants currently expect (early 2018).
- French President Macron's party is expected to emerge with the most seats in June's parliamentary election, a poll showed, with Macron also scoring well in terms of general popularity. His party would come top with 29% of the votes in the June election. The far-right National Front (FN) was seen in 2nd place with 17% of votes, with the conservatives Republicans party in 3rd with 15%. Far-left politician Melenchon's party was seen in 4th place with 14%.
Rates
Slightly dovish Draghi in uneventful, thin, trading
US (Memorial Day) and UK (Spring Bank Holiday) markets were closed today. Their absence resulted in a lacklustre, low-volume European trading session. The Bund hovered sideways in a narrow, 18-ticks, range ahead of Draghi's speech in European Parliament. EMU M3 money growth disappointed, but the ECB's lending survey showed both lending to companies and households at a post-crisis high. ECB president Draghi sounded fairly dovish, saying that the central bank remains convinced that the euro area still needs an extraordinary amount of support even if downside risks to growth are firmly diminishing. The Bund gained some ground after his comments. Technically, first resistance at 162.15/49 is near.
At the time of writing, changes on the German yield curve vary between -2.9 bps (5-yr) and -1.1 bp (30-yr). On EMU bond markets 10-yr yield spreads versus Germany widen up to 3 bps with Italy underperforming (+9 bps). Supply (tomorrow) and increasing odds of a fall election weigh on BTP's. Italy's anti-euro party voted this weekend in favour of changing the electoral system into a proportional election system with a 5% national threshold to get in parliament. That means that Italy's four most popular parties now signalled willingness to back this voting system which could finally put things in motion. Additionally, former PM Renzi argued in favour of holding Italian elections around the time of the German federal election (September 24). Renzi's centre-left PD and the five star movement are currently neck-and-neck in the polls at 30%. Italian parliamentary elections are officially scheduled for May 2018, but markets anticipate a vote early 2018. Recent developments suggest that it could even be sooner.
Currencies
Draghi fails to give directional guidance for the euro
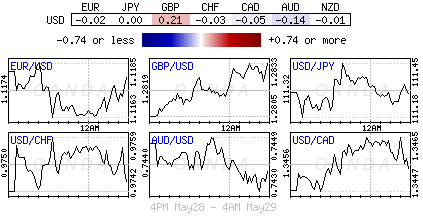
Trading in EUR/USD and USD/JPY was confined to tight ranges today with US and UK markets closed. ECB Draghi maintained a balanced approach in his appearance before the EU parliament and gave no hint on a U-turn in the ECB's assessment at next week's policy meeting. EUR/USD stabilizes in the 1.1175/80 area. USD/JPY is going nowhere in the 11.25/35 area.
Overnight, SF Fed Williams defended the case for three rate increases this year (including March), as he sees "the US economy is as close to the Fed's dual mandate goals as we' ve ever been". He also advocated a very gradual reduction of the balance sheet. The comments were marginally supportive for the dollar, but there was no clear trend.
With US and UK markets closed, trading in EUR/USD and USD/JPY was order driven and developed in thin market conditions. EUR/USD came close to Friday's low (1.1160 area) this morning, but there was no strong enough driver to force a break below. In technical trade, EUR/USD even reversed part of Friday's correction and settled in the high 1.11 area. Headlines on political event risk in Italy (elections in autumn?) weighed on Italian equities and bonds, but didn't hurt the euro. USD/JPY held a very tight range in the lower half of 111.
ECB president Draghi maintained a balanced tone in his testimony before parliament this afternoon. He acknowledged that the euro area upswing is becoming increasingly solid and that some of the tail risks have receded measurably. At the same time, he repeated that the euro area still needs very accommodative conditions. Draghi didn't give concrete hints on a significant change in the ECB's assessment next week. The euro loses a few ticks upon the first Draghi headlines. EUR/USD trades in the 1.1175/80 area. From tomorrow, the focus might return to the US eco data.
Sterling rebounds slightly. Opinion polls stay in focus
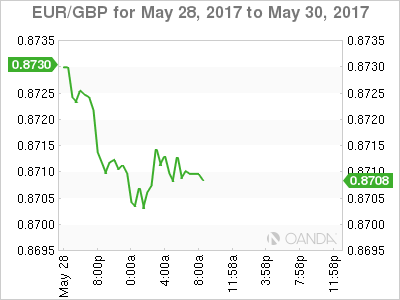
UK markets were closed for the May bank holiday. The key question on the political scene is whether PM May's conservative party can stop the erosion of its lead in the opinions polls as the June 08 Parliamentary elections are coming closer. Today, the uncertainty had no additional negative impact on sterling even as polls during the weekend confirmed the narrowing gap with Labour. However, investors will keep a close eye on the polls. EUR/GBP trades currently just north of 0.87, slightly off Friday's top at 0.8750. Sterling also recouped part of Friday's setback against the dollar The pair trades in the 1.2845 area (compared to Friday's around 1.2775/80). For now, the overall picture on sterling remains fragile.
Sterling Steady After Opinion Poll Pounding
Monday May 29: Five things the markets are talking about
Overnight, global stocks were mixed amid low trading volume while the dollar held to a narrow range as investors continue to weigh the latest comments from the Fed on interest rates and the U.S economy.
Note: Markets are closed in the U.S., the U.K. and China.
On the weekend, the G7 concluded it's meeting in Italy with a vague commitment to existing exchange rate arrangements, pledge to "fight protectionism" and reduce global imbalances to support growth.
However, climate change friction was among the more noteworthy developments, as leaders failed to bridge differences on the issue. The focus now turns to China-EU investment agreement taking place next weekend.
It's a busy week on the data front; final May manufacturing PMI's will be released globally.
In Asia, Japan posts key data for April industrial production, household spending, retail sales and unemployment.
North America, Canada releases its Q1 GDP and its trade balance numbers. Stateside, there is April personal spending and international trade data to shift through before Friday's May employment situation report.
1. Global equities mixed in thin holiday trade
In Japan, the Nikkei was flat overnight as investors wait for key U.S data this week to provide clues on how soon U.S interest rates might rise. The broader Topix index advanced less than +0.1%.
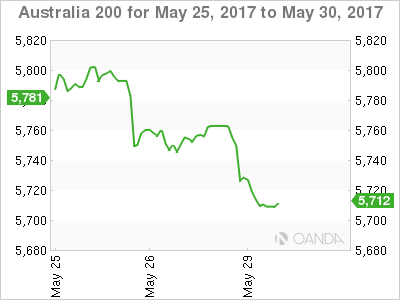
In Australia, the S&P/ASX 200 Index fell -0.8%, pressured by weakness in energy and mining sector.
In Hong Kong, the Hang Seng increased +0.3% and the Hang Seng China Enterprises Index rose +0.4%.
Note: China markets are closed for the Dragon boat festival.
In South Korea, the Kospi fell -0.1% after jumping +0.7% earlier in the session. The index closed last week at an all-time high. Overnight, North Korea conducted another ballistic missile test, despite being warned repeatedly by world leaders.
In Europe, regional bourses are broadly flat on low volumes due to holidays in the U.K and U.S. Energy stocks are somewhat depressed following lower crude prices.
Indices: Stoxx50 -0.2% at 3,576, FTSE closed, DAX flat at 12,602, CAC-40 -0.1% at 5,330, IBEX-35 -0.1% at 10,889, FTSE MIB -1.1% at 20,982, SMI -0.4% at 9,008
2. Oil dips as U.S drilling weakens drive to tighten markets
Oil prices are trading on the back foot, pressured by the rise in U.S drilling which continues to weaker OPEC led attempts to tighten global supplies.
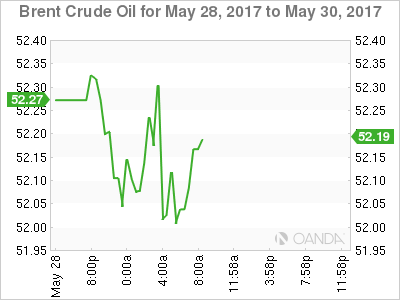
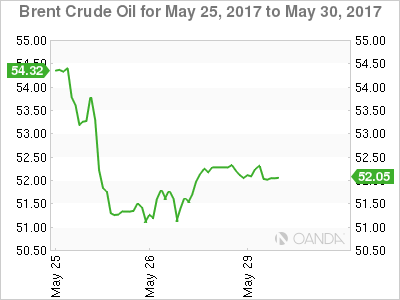
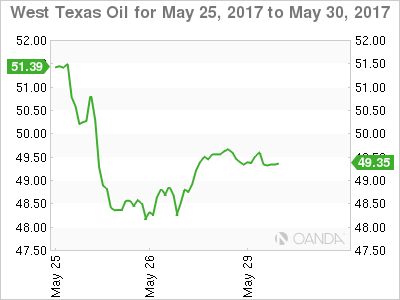
Brent crude futures are trading down -6c at +$52.09 per barrel, while U.S West Texas Intermediate (WTI) crude futures are down -8c at +$49.72 per barrel.
OPEC and some non-OPEC producers agreed last week to extend a pledge to cut production by around -1.8m bpd until the end of the Q1 2018.
However, the price action since the May 25 decision would suggest that the market was expecting much deeper cuts and a longer deal. Despite the ongoing cuts, oil prices have not been able to rally much beyond +$50 per barrel.
Much of OPEC's success will depend on output in the U.S, which is not participating in the cuts and where production has soared +10% in two-years to over +9.3m bpd.
Note: According to Baker Hughes's report, data on Friday showed that U.S drillers have now added rigs for 19 consecutive weeks, to 722, the highest amount in two-years.
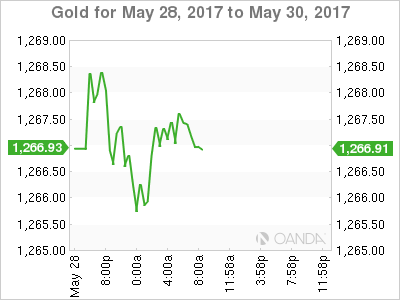
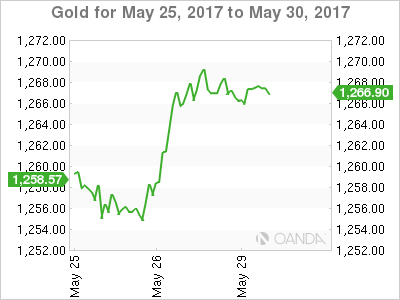
Gold is holding steady near its four-week highs after rising almost +1% in Friday's session, supported mostly by geopolitical tensions boosting its safe-haven appeal. Spot gold is almost flat at +$1,267.01 per ounce, after it climbed +0.9% to touch its strongest print since May 1 at +$1,269.50.
3. Global yields confined to tight ranges
U.S government bonds retraced early gains Friday, ending the day little changed amid signs that investors have grown comfortable with current prices. The yield on U.S 10's closed out the week at +2.25% after early climbing in the week as the market was flooded with new debt supply from both the Treasury and the private sector.
However, last week's Fed minutes which suggested U.S policy makers would continue to take a cautious approach to tightening monetary policy had the curve flatten again.
To date, the Fed has strongly signalled that it will raise interest rates next month, but officials have promised to keep a close watch on inflation, and their preferred gauge - personal-consumption expenditures price index or PCE - will be in the spotlight tomorrow.
4. Dollar temporarily contained
The USD is trading little changed in holiday thin trading. The greenback found some support from Fed Williams stating that the U.S medium-term trends "remains pretty favorable despite some recent soft consumer price data."
Sterling is a tad firmer by +0.2% at £1.2842 despite some weekend polls continuing to point that the upcoming Jun 8th U.K Parliamentary election race was tightening.
PM May's Conservative Party still holds a sizeable lead, but the initial "blowout scenario" has been deflated in recent sessions.
Note: Conservative Party's lead continues to erode (Opinium Poll: Con: +45% (-1); Labour +35% (+2); ComRes Poll: Con: +46% (-2); Labour +34% (+4); ORB/Telegraph Poll: Con: +44% (-2); Labour +38% (+4).
The EUR (€1.1182) continues to trade within touching distance of the psychological €1.1200 handle.
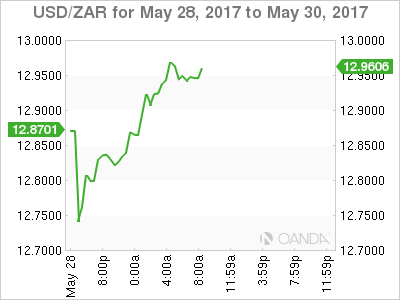
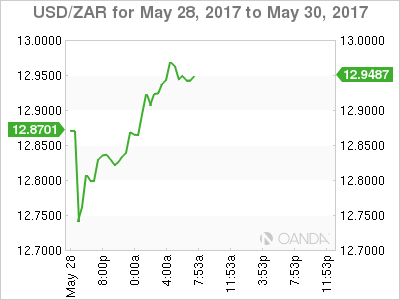
Elsewhere, the ZAR was weaker by -0.7% at $12.9500 after South Africa President Zuma survived a no-confidence motion. The President has faced mounting pressure from ANC members and opposition parties since he fired respected finance minister Gordhan in March, triggering a credit rating downgrade.
5. Data point to little SNB FX intervention
This morning's sight deposit data (a proxy for intervention) from the Swiss National Bank (SNB) suggests that have not been intervening much in markets to weaken the franc in recent weeks.
The latest SNB figures showed sight deposits were flat last week at +576B francs and were broadly stable for May as a whole. They had risen sharply in early 2017 as the SNB stepped up its efforts to fight the strong franc.
EUR/CHF at €1.0891 is marginally firmer compared with Friday's close.
CAC Steady in Quiet Holiday Trade
European markets are sluggish at the start of the week, and the CAC index is almost unchanged in the Monday session. Currently, the CEC is trading at 5,326.50 points. On the release front, there are no key eurozone indicators. Later in the day, Mario Draghi testifies about monetary policy before an EU parliamentary committee. It's likely to be remain a quiet day for the CAC, as US markets are closed for Memorial Day, and markets in China and the UK are also on holiday. On Tuesday, France releases Personal Spending and Preliminary GDP.
The French stock market has recorded strong gains in the first quarter of 2017, buoyed by improving growth in the euro-area. There were serious concerns about the eurozone economy at the start of the year, which was struggling with weak inflation, high unemployment and low growth. The jitters grew as relations soured between Britain and the EU, with gloomy predictions that Britain's departure spelled the end of a united Europe. As well, US President Trump's protectionist agenda raised speculation that Europe could find itself embroiled in trade wars with a protectionist US administration. Although Trump and Brexit still remain serious challenges for the EU, fears of a populist wave across the continent have receded, as nationalist parties in the Netherlands and France were handily defeated in recent elections. Economic indicators continue to point upwards, as unemployment has dropped and growth is higher. The EU Spring Forecast has forecast Eurozone GDP to rise 1.7% in 2017, and 1.8% in 2018. If inflation levels move higher, the ECB could consider tapering its asset-purchase scheme, which is scheduled to wind up in December.
The US economy slowed in the first quarter of 2017, but there was some good news on Friday, as GDP was revised upwards. The US economy expanded at an annual rate of 1.2%. This was considerably higher than the 0.7% gain which was reported in the first estimate in April. Still, this figure is the lowest in a year, and well of the 2.1% gain in Q4. Business spending remains weak, and although consumer confidence remains at high levels, consumer spending has not kept up, as retail sales was softer than expected in April. The manufacturing sector is showing signs of fatigue, with Core Durable Goods Orders posting a decline of 0.4% in April, its third decline in four months. After a shaky first quarter for the US economy, there are no indications as of yet that we will see a rebound in the second quarter. Is the Federal Reserve still on track for a rate hike in June? The markets remain confident that the Fed will act, as the odds of a rate increase in June have increased to 84%, according to the CME Group. At the same time, the likelihood of a rate hike in the second half of 2017 remain low. The odds for a September rate are just 26%, with the markets unclear on whether the Fed will make further moves this year if inflation remains below the Fed target. Even if soft first quarter data was a blip, the markets (and possibly Fed policymakers) are concerned that President Trump, who is facing several congressional investigations over his connections with the Russian government, may not be able to pass his agenda of cutting taxes and reigning in government spending.
Dragon Boats Becalm Asia
Dragon Boat festivals in China and a holiday heavy Monday globally saw muted trading in Asia, but a data-heavy week should see the pace increase towards Friday's Non-Farm Payrolls.
Monday's Asia session was unlikely to be a memorable one with China and Taiwan being joined by Hong Kong tomorrow for the Dragon Boat Festival holiday. This meant no CNY fixing this morning either to enliven proceedings. The day will likely continue in this vein as both the United Kingdom and the United States have holidays today as well. The calm is unlikely to last though, as the week turns very data heavy with plenty of Tier 1 data culminating in the Non-Farm Payrolls on Friday. (see calendar below)
Other highlights Include Thursday's Crude Inventory's being the first major energy data point post last week's OPEC meeting. This afternoon in Europe we have the ECB's, Draghi speaking and one Wednesday we have China's KManufacturing PMI. Any one of the above can rock the boat ahead of Friday.
During the Asian session, we saw an almost mandatory North Korean missile test which the markets completely ignored.
Equities
Asia equity markets traded sideways after an equally dull US close on Friday, with the region mixed holiday-thinned trade. The ASX 200 (-0.5%) as banks were sold, while the Nikkei 225 (+0.1%) and the Heng Seng (+0.1%) index delivered range-bound sessions.
FX
South African President Zuma survived an attempt by members of his ANC party order him to step down. This caused a brief flurry in the early hours of this morning with the ZAR rallying initially on the attempt news. But giving back most of its gains when the motion failed. If nothing else, demonstrating the market's thoughts on Mr Zuma's performance.
Oil
After the ructions of last Thursday and Friday, crude oil has had a quiet start to the week in Asia. Oil bounced some four percent on Friday, probably reflecting the short-term oversold nature of the market after Thursdays gigantic post-OPEC sell-off, rather than any structural shift.
Brent spot opened at 52.25 with support at 51.00 and resistance at 53.00.
WTI spot opens at 49.50 with support at 48.00 and resistance at 50.50.
Most likely, both contracts will struggle to make substantial progress to the upside in the early part of the week ahead of Thursday's crude inventories from the U.S.
Gold
Friday's 12 dollars safe-haven induced rally continued today with gold holding onto all of its gains in Asia. Movements in gold will likely be inversely correlated to the movements in oil and headlines coming out of Washington. Gold trades at 1267.00 with resistance at Friday's highs around 1270.00 initially with support at 1265.00 and then 1257.00.
This week's highlights.
Monday, May 29
13:00 EUR ECB President Draghi Speaks
Tuesday, May 30
12:30 USD Personal Consumption Expenditure Core (YoY) (APR)
14:00 USD CB Consumer Confidence
23:00 NZD RBNZ Financial Stability Report
Wednesday, May 31
01:00 China Manufacturing PMI
07:55 German Unemployment
09:00 Eurozone CPI
Thursday, Jun 1
01:30 AUD Private Capital Expenditure q/q
01:30 AUD Retail Sales m/m
08:30 GBP Manufacturing PMI
12:15 USD ADP Non-Farm Employment Change
12:30 USD Unemployment Claims
14:00 USD ISM Manufacturing PMI
15:00 USD Crude Oil Inventories
Friday, Jun 2
08:30 GBP Construction PMI
12:30 USD Non-Farm Employment Change
12:30 USD Unemployment Rate
DAX Unchanged, US And China Markets Closed
The DAX index is flat at the start of the week. Currently, the DAX is trading at 12,601.25 points. On the release front, there are no major eurozone events. The markets are focused on the ECB, as Mario Draghi testifies before the Economic and Monetary Affairs Committee in Brussels. US markets are closed for Memorial Day, and with China and the UK also closed, we're unlikely to see much movement from the DAX. On Tuesday, Germany releases Preliminary CPI, and an unexpected reading could shake up the listless DAX index.
Germany's economy continues to perform well, with low unemployment and GDP for 2017 expected at 1.6%. The German locomotive has boosted the eurozone economy, which enjoyed solid growth in the first quarter. There were plenty of concerns about the eurozone at the start of the year, with the election of Donald Trump in the US, who ran on a protectionist campaign of “America first”. As well, the Brexit vote hung over Europe like a dark cloud, with fears that Britain's departure spelled the end of a united Europe. Although Trump and Brexit still remain serious challenges for the EU, fears of a populist wave across the continent have receded, as nationalist parties in the Netherlands and France were handily defeated in recent elections. Economic indicators continue to point upwards, as unemployment has dropped and growth is higher. The EU Spring Forecast has forecast Eurozone GDP to rise 1.7% in 2017, and 1.8% in 2018, and European stock markets have posted strong gains in the first quarter, and the DAX has soared 10.3% since the start of the year and continues to record new highs.
With expectations high that the Fed will raise interest rates at the June meeting, all eyes were on the revised GDP report, which was released on Friday. The US economy expanded at an annual rate of 1.2%, according to second estimate for GDP. This was considerably higher than the 0.7% gain which was reported in the first estimate in April. Still, this figure is the lowest in a year, and well of the 2.1% gain in Q4. Business spending remains weak, and although consumer confidence remains at high levels, consumer spending has not kept up, as retail sales was softer than expected in April. The manufacturing sector has hit some turbulence, with Core Durable Goods Orders posting a decline of 0.4% in April, its third decline in four months. After a shaky first quarter for the US economy, there are no indications as of yet that we will see a rebound in the second quarter. As for a June hike, the odds of a rate hike have increased to 84%. At the same time, the likelihood of a rate hike in the second half of 2017 remain low. The odds for a September rate are just 26%, with the markets unclear on whether the Fed will make further moves this year if inflation remains below the Fed target. Even if soft first quarter data was a blip, the markets (and possibly Fed policymakers) are concerned that President Trump, who is facing several congressional investigations over his connections with the Russian government, may not be able to pass his agenda of cutting taxes and reigning in government spending.
Draghi To Address The European Parliament
Today, the economic calendar is almost empty, with no major economic indicators due to be released. The only event that could attract market attention is a speech by ECB President Mario Draghi, who will appear before the European Parliament. This will be Draghi's last appearance ahead of the ECB's June meeting and as such, we expect investors to scan his comments for any hints as to whether the Bank will shift to a more optimistic bias as early as at that gathering. Last week, he attempted to manage such expectations by indicating that there is no reason to deviate from the forward guidance in the Bank's official statements.
We don't expect Draghi to materially change his message today. We think he will likely reiterate that although Eurozone's economy is improving - evident by a declining unemployment rate and solid GDP growth – core inflation remains relatively subdued. In addition, we doubt that the ECB chief will risk triggering further surge in the euro by appearing too upbeat too early. As such, we think that the risks surrounding the euro's reaction from his comments may be tilted somewhat to the downside. If he maintains a cautious tone overall, investors looking for hawkish clues could be left disappointed. Finally, with markets staying closed in the US and the UK today, liquidity may be thinner-than-usual, which could amplify any potential market reaction.
EUR/USD traded lower on Friday after it hit resistance near the 1.1230 (R1) hurdle, before the decline was halted by the 1.1160 (S1) support level. Even though the price structure on the 4-hour chart still suggests a short-term uptrend, in case Draghi disappoints EUR bulls today, we could see the latest pullback continue. If sellers manage to overcome the 1.1160 (S1) zone, we could see further downside extensions towards the next support at 1.1100 (S2).
EUR/JPY also declined on Friday from near the 125.30 (R2) territory, to break below the 124.50 (R1) support (now turned into resistance) barrier. A cautious tone by the ECB President today could provide the bears with an excuse to push the battle lower, perhaps for an initial test of the 124.00 (S1) area. A clear break below that zone could set the stage for the 123.00 (S2) support.
Today's highlights:
The only noteworthy indicator we get today is Eurozone's M3 money supply for April, though this is usually not a major market mover.
Besides ECB President Mario Draghi, we have one more ECB speaker on the schedule: Executive Board member Peter Praet.
As for the rest of the week:
On Tuesday, we get Germany's preliminary CPI for May, as well as US personal income and spending data for April. Staying in the US, we also get the core PCE price index for April. On Wednesday, Eurozone's preliminary CPI figures for May will capture market attention. On Thursday, from the US, we get the ADP employment report as well as the ISM manufacturing PMI, both for May. From the UK, we get the manufacturing PMI for the same month. Finally on Friday, all eyes will be on the US employment report for May. The forecast is for nonfarm payrolls to have risen by 183k, for the unemployment rate to have ticked up and for average hourly earnings to have slowed somewhat in monthly terms, though that would leave the yearly rate unchanged. Despite some potential softness in the unemployment rate and earnings, we think that overall, this is likely to be seen as a decent report by FOMC officials, and it could seal the deal for a June rate hike.
EUR/USD
Support: 1.1160 (S1), 1.1100 (S2), 1.1070 (S3)
Resistance: 1.1230 (R1), 1.1270 (R2), 1.1300 (R3)
EUR/JPY
Support: 124.00 (S1), 123.00 (S2), 122.00 (S3)
Resistance: 124.50 (R1), 125.30 (R2), 125.80 (R3)
Technical Outlook: US Oil – Recovery Was So Far Capped By Daily Tenkan-Sen, Break Through Pivots At $49.48 Or...
Bounce from last Friday's low at $48.16 touched $50.00 barrier on Monday, in extension of last Friday's strong recovery rally, but gains were so far capped by daily Tenkan-sen line.
Mixed technical studies on daily chart show no clear direction for now, despite recovery's probe above 200SMA ($49.65).
Fresh pressure on oil price may come from increased US shale oil production which threatens to offset positive impact on OPEC's decision to extend production cut for additional nine months.
Near-term price action is supported by 55SMA at $49.48, but needs to clearly break above 200SMA and psychological $50.00 barrier to signal further recovery and expose next pivot at $50.97 (100SMA).
Otherwise, downside is expected to remain vulnerable while the latter barriers hold, with break below 55SMA to increase downside risk for retest of key supports between $48.55 and $47.86, consisting of 20SMA and daily Kijun-sen.
Res: 50.00, 50.55, 50.97, 51.20
Sup: 49.48, 48.83, 48.16, 47.86
Market Update – European Session: Confidence Data Continues To Improve In Europe
Notes/Observations
Finland May Consumer Confidence hits a record high
G7 leaders divided on climate change but edging closer on trade issues
Markets appear that take latest North Korea missile test in stride; little risk aversion seen in quiet session but Gold holds near 4-week highs
China; UK and US markets closed for holidays
Overnight/weekend
Official G7 communique
Reiterated to keep markets open and "fight protectionism" while standing firm against unfair trade practices
Committed to reducing global imbalances to support growth
Failed to bridge differences over climate change, with the United States unable to join other countries in committing to the Paris Agreement.
Ready to take further restrictive measures against Russia if developments in Ukraine demand it
North Korea was a grave threat to world peace, ready to strengthen measures to force North Korea to abandon nuclear program
Concerned about situation in South China Sea
Asia:
North Korea said to fire unidentified projectile from east coast. Launch followed two successful tests of medium to long range missiles in as many weeks by Pyongyang (**Note: 3rd test-launch since South Korea's President Moon Jae-in took office on May 10th)
Japan PM Abe: Will consider specific response to North Korea with US; to remain in close communication with South Korea
US to send a 3rd naval strike force to the Western Pacific regions to deter North Korea's ballistic missile and nuclear programs. USS Nimitz, one of the world's largest warships, will join two other supercarriers, the USS Carl Vinson and the USS Ronald Reagan, in the western Pacific
Europe:
UK Govt spokesperson: Threat level lowers from critical to severe. British intelligence experts no longer believe another attack is imminent after police made significant progress in their investigation into a suicide bomb attack on a pop concert in Manchester
Recent polls on upcoming UK elections (to be held Jun 8th); Conservative Party's lead continues to erode (Opinium Poll: Conservatives 45% (-1); Labour 35% (+2); ComRes Poll: Conservatives 46% (-2); Labour 34% (+4); ORB/Telegraph Poll: Conservatives 44% (-2); Labour 38% (+4)
Scottish First Min Sturgeon (SNP): If SNP wins most seats in Scotland, PM May's refusal to agree to 2nd Independent Referendum will be unsustainable
German Emnid Poll: Merkel's Conservative coalition extends lead ahead of Sept elections: CDU/CSU 38% (unchanged); SPD 25% (-1)
Spain govt said strike deal to pass 2017 budget; had support to obtain a majority of 176 votes
Americas:
President Trump: Have total confidence in Jared Kushner. Tweats "My opinion that many of the leaks coming out of the White House are fabricated lies made up by the #FakeNews media"; massive TAX CUTS/REFORM that I have submitted is moving along in the process very well"
Fed's Williams (moderate, non-voter): 3 rate hikes in 2017 makes sense. There's been soft inflation data over past couple of months, but medium term still favorable.
Energy:
Weekly Baker Hughes US Rig Count: 908 v 901 w/w (+0.8%) (19th straight weekly rise)
Economic Data
(NO) Norway Q1 Manufacturing Wage Index Q/Q: 0.7% v 0.1% prior
(FI) Finland May Consumer Confidence: 24.1 (record high) v 21.5 prior; Business Confidence: 8 v 4 prior
(ES) Spain Apr Adjusted Retail Sales Y/Y: 1.2%e v 0.9% prior; Retail Sales (unadj): No est v 2.6% prior
(SE) Sweden Apr Household Lending Y/Y: 7.1% v 7.3% prior
(SE) Sweden Apr Trade Balance (SEK): -2.6B v +0.3B prior
(EU) Euro Zone Apr M3 Money Supply Y/Y: 4.9% v 5.2%e
(IS) Iceland May CPI M/M: 0.2% v 0.5% prior; Y/Y: 1.7% v 1.9% prior
Fixed Income Issuance:
(IT) Italy Debt Agency (Tesoro) sold €6.0B vs. €6.0B indicated in 6-month Bills; Avg Yield: -0.358% v -0.326% prior; Bid-to-cover: 1.83x v 1.86x prior
SPEAKERS/FIXED INCOME/FX/COMMODITIES/ERRATUM
Equities
Indices [Stoxx50 -0.2% at 3,576, FTSE closed, DAX flat at 12,602, CAC-40 -0.1% at 5,330, IBEX-35 -0.1% at 10,889, FTSE MIB -1.1% at 20,982, SMI -0.4% at 9,008]
Market Focal Points/Key Themes European stocks opened broadly flat, and traded slightly down on low volumes due to holidays in China, the UK and US. Financials underperformed with UBI and Credit Suisse opening down. Energy stocks somewhat depressed following lower crude prices. International Consolidated Airlines traded lower in Spain even as British Airways delay issues over the weekend were largely resolved.
Equities
Consumer discretionary [International Consolidated Airlines IAG.ES -2.71% (IT problems over weekend)]
Financials [Intesa Sanpaolo ISP.IT -1.5% (new strategy plan)]
Materials [Lanxess LXS.DE +3.7% (discloses Buffet stake)]
Speakers
ECB's Nowotny (Austria): Recovery in the wake of the financial crisis has been modest by historical standards
ECB's Villeroy (France):Have made progress on banking union but need better coordination between national authorities
Brazil Fin Min Meirelles: 2017 GDP growth seen flat (0.0%) without pension bill
S&P Dir Kim Eng Tan: Likely to follow its regular ratings review schedule for China. Did not see any basis at this point for an out-of-schedule committee meeting as financial instability in China was not expected in near future
Thailand Central Bank: Ready to act on THB currency (Baht) appreciation
Currencies
The USD was basically steady in quiet trading on Monday. The greenback aided by commentary from Fed's Williams that the US medium-term trends remained pretty favorable despite some recent soft consumer price data. EUR/USD holding below the 1.12 handle ahead of the NY morning.
The GBP was slightly firmer by 0.2% despite weekend polls continuing to point that the upcoming Jun 8th Parliementary election race was tightening. PM May's Conservative Party still held a sizeable lead but the initial blow-out scenario has been deflated in recent sessions. GBP/USD trading at 1.2840 by mid-session.
ZAR currency Rand was weaker by 0.7% after South Africa President Zuma survived a no-confidence motion against him at a meeting of senior officials of the ruling African National Congress (ANC). Zuma has faced mounting pressure against him from ANC members, opposition parties and civil society since he fired respected finance minister Gordhan in March, triggering credit rating downgrades. USD/ZAR at 12.95
Looking Ahead
06:00 (IE) Ireland Apr Retail Sales Volume M/M: No est v -0.7% prior; Y/Y: No est v 3.2% prior
06:45 (US) Daily Libor Fixing - 07:00 (IN) India announces details of upcoming bond sale (held on Fridays)
07:00 (BR) Brazil May FGV Inflation IGPM M/M: -0.8%e v -1.1% prior; Y/Y: 1.7%e v 3.4% prior
07:25 (BR) Brazil Central Bank Weekly Economists Survey
07:30 (DE) German Chancellor Merkel at high school event
08:00 (ES) Spain Dent Agency (Tesoro) announces size of upcoming auctions; to sell 2021, 2030 and 2066 bonds
08:50 (FR) France Debt Agency (AFT) to sell combined €5.6-6.8B in 3-month, 6-month. 9-month and 12-month BTF Bills
09:00 (IL) Israel Central Bank (BOI) Interest Rate Decision: Expected to leave Base rate unchanged at 0.10%
09:15 (DE) German Chancellor Merkel at conference in Berlin
09:30 (EU) ECB announces Covered-Bond Purchases
09:35 (EU) ECB calls for bids in 7-Day Main Refinancing Tender
09:45 (EU) EU's Oettinger in Berlin
10:30 (EU) European Investment Biank (EIB) Hoyer at Harvard University
11:00 (EU) ECB's Draghi in EU Parliament
Moody’s Cuts China’s Ratings For The First Time In Three Decades
Ratings agency, Moody's cut China's sovereign credit rating from A1 to Aa3 last week, for the first time in nearly three decades. The ratings agency also lowered China's outlook from negative to stable.
The cut to sovereign ratings comes as China's financial strength continued to deteriorate amid rising debt concerns. The ratings cut is expected to rise the cost of borrowing from the government, institutions and state-owned enterprises.
China's government responded to the ratings downgrade calling it "inappropriate" with the Ministry of Finance calling the ratings downgrade overestimating the difficulties facing the economy.
Moody's commented on the ratings downgrade noting that it reflected the agency's expectations that the financial strength could begin to erode in the coming years.
Moody's: China's growing debt a concern
China's emphasis on sustaining growth via exports led to increased stimulus programs and borrowing by state-owned enterprises.
It is estimated that China's debt that includes debt owed by the government, household and non-financial companies grew 250% of the GDP.
The high debt levels were also a concern and led to the ratings downgrade, according to Moody's which said that while such high levels of debt were not uncommon, they were mostly stable if the high levels of debt came from stable economies that have strong financial markets and institutions.
The credit cut impact is likely to be felt by companies in China who have exposure to foreign-currency debt. By some estimates, airlines and shipping companies which use foreign-currency debt for financing were seen to be particularly vulnerable.
The ratings agency also cautioned that China’s economy could slow to 5% in the next few years as the economy matures and faces unique challenges.
Earlier this year, China’s authorities set a
Moody's downgrades Hong Kong credit ratings as well
Following the ratings cut on Wednesday, Moody's also downgraded Hong Kong's credit ratings to Aa1 from Aa2.
The ratings downgrade for Hong Kong was as a result of the rise in the credit trends from China which according to Moody's is expected to have a significant impact on Hong Kong's credit profile.
The outlook for Hong Kong was also changed to stable from negative.
Hong Kong authorities brushed aside the ratings downgrade noting that the city was equipped to deal with any challenges. In a sharp criticism to the downgrade, authorities in Hong Kong said that the ratings agency overlooked the economic fundamentals and its resilient banking sector.
Despite the surprise downgrades, the market showed a rather muted response with Bloomberg reporting that the yield premium on China's investment grade notes issued by Chinese firms rising just two basis points after the downgrade.
China's dollar bonds continued to remain a favorite among yield seeking investors with the ratings downgrading doing little to dent sentiment.
Among the emerging markets, besides China, both Brazil and South Africa remain on the ratings agency's watch list suggesting that credit quality continues to worsen in the emerging markets.
Other ratings firms, Fitch and Standard and Poors, have maintained their ratings on China at A+ with a stable outlook from Fitch while Standard and Poors has an AA- and a negative outlook for China. Fitch had last revised China's ratings in November of 2007, while Standard and Poors revised the ratings in March 2016.
China which had been in the forefront of the global economic recovery for a decade and more had started to show signs of the economy cooling off, with latest growth estimates forecasting China's GDP to grow around 6% - 7%.
China's growth slowed to 10.6% in 2010 to just under 7% by 2016.
The IMF forecasts, China's GDP to grow 6.5% but also warned that the nation must reign in the rising total debt levels which stood at 247% of GDP in 2015.
Officials are also targeting a growth rate of 6.5% for 2017, down from 6.7% growth seen the year before.