Sample Category Title
Daily Technical Outlook And Review: EUR/USD, GBP/USD, AUD/USD, USD/JPY, USD/CAD, USD/CHF, DOW 30, GOLD
A note on lower timeframe confirming price action...
Waiting for lower timeframe confirmation is our main tool to confirm strength within higher timeframe zones, and has really been the key to our trading success. It takes a little time to understand the subtle nuances, however, as each trade is never the same, but once you master the rhythm so to speak, you will be saved from countless unnecessary losing trades. The following is a list of what we look for:
- A break/retest of supply or demand dependent on which way you're trading.
- A trendline break/retest.
- Buying/selling tails ... essentially we look for a cluster of very obvious spikes off of lower timeframe support and resistance levels within the higher timeframe zone.
- Candlestick patterns. We tend to only stick with pin bars and engulfing bars as these have proven to be the most effective.
We typically search for lower-timeframe confirmation between the M15 and H1 timeframes, since most of our higher-timeframe areas begin with the H4. Stops are usually placed 1-3 pips beyond confirming structures.
EUR/USD
In recent hours, the single currency has come under pressure. Without citing sources, there's speculation around the Greek government preparing to possibly go without the next bailout payment if creditors cannot agree on debt relief. The move, as you can see, forced price beyond our H4 buy zone at 1.1142/1.1150 and has, at the time of writing, clocked a low of 1.1135. The reasons for selecting this area were as follows:
H4 mid-level support at 1.1150.
H4 AB=CD (see black arrows) 127.2% Fib ext. at 1.1140 taken from the high 1.1268.
Daily support at 1.1142.
From a technical perspective, the weekly candles indicate that further downside could be on the cards since price is seen trading nearby a formidable supply area coming in at 1.1533-1.1278. What's also interesting is the recently formed weekly selling wick, also known as a bearish pin bar. In the event that the bears continue to push lower this week, the next downside target can be seen at 1.0873: the 2016 yearly opening line. Down on the daily chart, however, the unit is seen crossing swords with support drawn from 1.1142. This forms part of our H4 buy zone mentioned above.
Our suggestions: Although price has surpassed the aforementioned H4 buy zone, there's still a possibility that it may hold firm and challenge the underside of the recently broken H4 demand at 1.1161-1.1189 as resistance. Personally, we're not fond of the recent move down, since a truckload of stops have likely been triggered beneath 1.1142 on the Greece rumors. With that being the case, our team will remain on the sidelines for the time being and reassess market structure going into tomorrow's open.
Data points to consider: US PCE price index at 1.30pm, US Consumer confidence at 3pm GMT+1
Levels to watch/live orders:
- Buys: Flat (stop loss: N/A).
- Sells: Flat (stop loss: N/A).
GBP/USD
Recent action shows that the GBP/USD extended Friday's bounce from 1.2775 up to the H4 mid-level resistance coming in at 1.2850, which happens to coincide nicely with a daily resistance line at 1.2843. With bids likely weakened around the 1.28 handle the next level on our radar, assuming that this market continues to selloff, is the H4 Quasimodo support at 1.2769.
The stops taken from 1.28 would likely provide enough liquidity for the big boys to begin buying this market at 1.2769. What's more, let's remember that we are also trading from a weekly support at 1.2789! Therefore, there is a good chance price will bounce from 1.2769 and at least reach 1.28.
Our suggestions: Based on the above points, our desk believes the aforementioned H4 Quasimodo support level is stable enough to consider a buy trade from, with a stop-loss order placed below the pattern's apex at 1.2748.
Data points to consider: US PCE price index at 1.30pm, US Consumer confidence at 3pm GMT+1.
Levels to watch/live orders:
- Buys: 1.2769 region ([possible pending order] stop loss: 1.2748).
- Sells: Flat (stop loss: N/A).
AUD/USD
While the commodity currency maintained its offered tone below the H4 mid-level resistance pegged at 0.7450 yesterday, price was relatively subdued due to US banks being closed in observance of Memorial Day. However, we did happen to short this pair yesterday at 0.7440. For those who read Monday's report you may recall our desk mentioning that we're waiting for a second retest of 0.7450 to be seen. The candle rejection from this line was enough to reassure us that the bears remain in control.
In addition to the above, we also knew that weekly price was trading from a resistance area planted at 0.7524-0.7446. This produced a reasonably strong-looking selling wick last week which could imply further downside may be on the cards. Neighboring support rests in the form of a nearby trendline support etched from the low 0.6827. Also of interest were the daily candles. We do not see much in the way of support on the daily timeframe until we reach the support zone marked at 0.7284-0.7326 (fuses nicely with the aforementioned weekly trendline support).
Our suggestions: Ultimately, we are targeting the 0.74 handle as our initial take-profit target. Granted, we do have a H4 demand lurking nearby marked with a green arrow around 0.7420, which may produce a minor reaction. The more appealing area, however, remains around the 0.74 level, since it merges with a H4 61.8% Fib support taken from the low 0.7328 and a H4 Quasimodo support at 0.7394.
Data points to consider: Australian Building approvals at 2.30am. US PCE price index at 1.30pm, US Consumer confidence at 3pm GMT+1.
Levels to watch/live orders:
- Buys: Flat (stop loss: N/A).
- Sells: 0.7440 ([live] stop loss: 0.7463).
USD/JPY
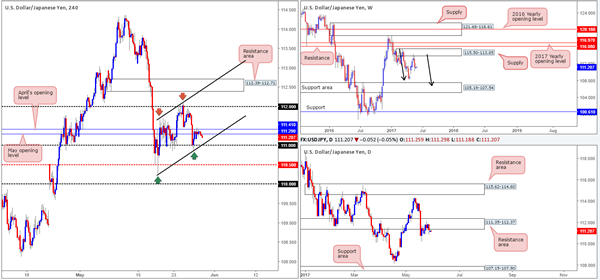
As can be seen from the H4 chart this morning, yesterday's trading volume was thin due to US banks being closed in observance of Memorial Day. Despite this, May/April's opening levels at 111.29/111.41 did a good job of holding back any fresh upside attempts. With little change seen to the structure of this market, much of the following report will echo similar thoughts put forward in Monday's analysis…
Weekly bears remain in a relatively strong position after pushing aggressively lower from supply registered at 115.50-113.85. We know there's a lot of ground to cover here, but this move could possibly result in further downside taking shape in the form of a weekly AB=CD correction (see black arrows) that terminates within a weekly support area marked at 105.19-107.54 (stretches all the way back to early 2014). In conjunction with weekly flow, daily price continues to defend the resistance area penciled in at 111.35-112.37. The next area on the hit list falls in at 107.15-107.90: a support zone that's glued to the top edge of the said weekly support area.
Our suggestions: Although price has bounced from a H4 channel support taken from the low 110.23 (ties in nicely with the 111 handle), we believe this will be short-lived move given what we've seen on the bigger picture.
With that being the case, our team is watching for a H4 close to form below 111 today. Not only would this imply bearish strength from the higher-timeframe structures, it would also clear the runway south down to at least the H4 mid-level support at 110.50. To take advantage of this potential move, one could either sell the breakout or conservatively wait for price to retest 111 as resistance and sell with lower-timeframe confirmation (see the top of this report). We prefer the latter.
Data points to consider: US PCE price index at 1.30pm, US Consumer confidence at 3pm GMT+1.
Levels to watch/live orders:
- Buys: Flat (stop loss: N/A).
- Sells: Watch for H4 price to engulf 111 and then look to trade any retest seen thereafter ([waiting for a lower-timeframe signal to form following the retest is advised] stop loss: dependent on where one confirms this level).
USD/CAD
Although yesterday's movement was somewhat muted given the US banks being closed in observance of Memorial Day, there's some nice-looking H4 price action forming at the moment.
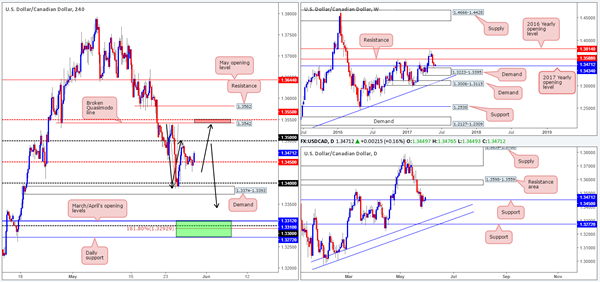
To the upside, we have a potential H4 AB=CD bearish pattern (taken from the low 1.3387) taking shape that terminates just ahead of a H4 broken Quasimodo line drawn from 1.3542/H4 mid-level resistance at 1.3550 and a daily resistance area at 1.3598-1.3559. This small (red) area marks a possible zone where price could bounce.
To the downside, we also see a potential H4 AB=CD 161.8% Fib ext. at 1.3292 taken from the high 1.3540. This number helps form a strong-looking (green) buy zone. 1.3272/1.3312: holds the following structures:
Daily support at 1.3272.
1.33 handle.
March/April's opening levels at 1.3310/1.3312.
Daily trendline support confluence (1.2968/1.3027).
Also of note is the H4 buy zone is seen lodged within the lower limits of the weekly demand at 1.3223-1.3395!
Our suggestions: As you can see, both zones hold a reasonable amount of confluence and have the potential to reverse price. To be on the safe side, however, we would recommend not entering blindly at these areas. Wait for additional confirming in the form a reasonably sized H4 rotation candle, preferably a full-bodied candle, before pulling the trigger.
Data points to consider: US PCE price index at 1.30pm, US Consumer confidence at 3pm GMT+1.
Levels to watch/live orders:
- Buys: 1.3272/1.3312 ([waiting for a reasonably sized H4 bull candle to form – preferably a full-bodied candle – is advised] stop loss: ideally beyond the candle's tail).
- Sells: 1.3550/1.3542 ([waiting for a reasonably sized H4 bear candle to form – preferably a full-bodied candle – is advised] stop loss: ideally beyond the candle's wick).
USD/CHF
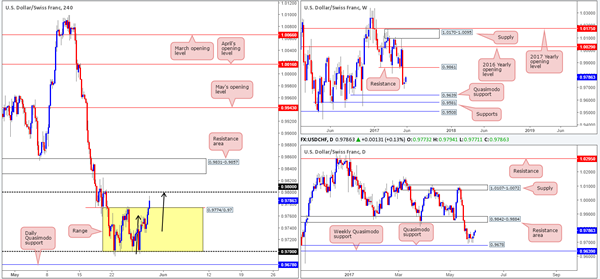
Going into the early hours of yesterday's US session, the Swissy took off north and has managed to breach the top edge of a H4 range fixed between 0.9774/0.97. As you can see, H4 price is nearing the 0.98 handle, which happens to collaborate with an AB=CD bearish completion point (see black arrows). While selling from 0.98 may be tempting, there's a chance that this psychological hurdle could be demolished. We say this simply because over on the higher timeframes both the weekly and daily charts show room to advance beyond this number, with the closest resistance area not seen until we reach 0.9842-0.9884: a resistance zone that houses a weekly resistance level pegged at 0.9861.
Our suggestions: Personally, we have absolutely no interest in shorting from 0.98 today, despite it having the ability to bounce price. We just would not feel comfortable selling against potential weekly/daily flow! Therefore, for now at least, our desk will remain on the sidelines.
Data points to consider: US PCE price index at 1.30pm, US Consumer confidence at 3pm GMT+1.
Levels to watch/live orders:
- Buys: Flat (stop loss: N/A).
- Sells: Flat (stop loss: N/A).
DOW 30
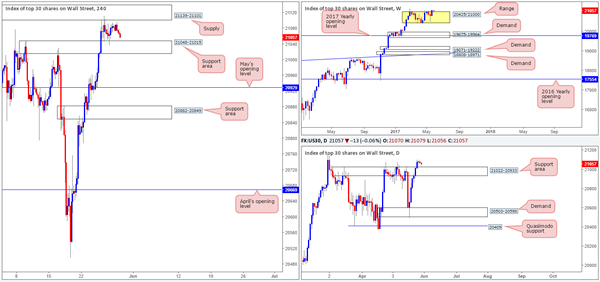
As expected, trading volume was thin in the US equity market yesterday due to US banks being closed in observance of Memorial Day. This has left the H4 candles confined between a supply zone marked at 21139-21101 and a support area drawn from 21048-21015. Technically speaking, this is the last remaining supply standing in the way of this instrument achieving fresh highs. Why we believe this is due to weekly price recently breaching the top edge of a range fixed around record highs of 21170 between 20425/21000, and because of the unit recently driving through the resistance area at 21022-20933, which should effectively now act as a support area. With this area consumed, we do not see any structure on this timeframe stopping the index from achieving fresh record highs.
Our suggestions: Although the bulls look incredibly determined at this time, entering long expecting price to reach new highs would still be a risk, in our opinion. Waiting for the H4 supply mentioned above at 21139-21101 to be taken out is likely the safer route, before considering hunting for longs. Therefore, until we see a decisive close above this area, our desk will remain patiently waiting on the sidelines.
Data points to consider: US PCE price index at 1.30pm, US Consumer confidence at 3pm GMT+1.
Levels to watch/live orders:
- Buys: Watching for H4 price to close above H4 supply at 21139-21101 before looking to long this market.
- Sells: Flat (stop loss: N/A).
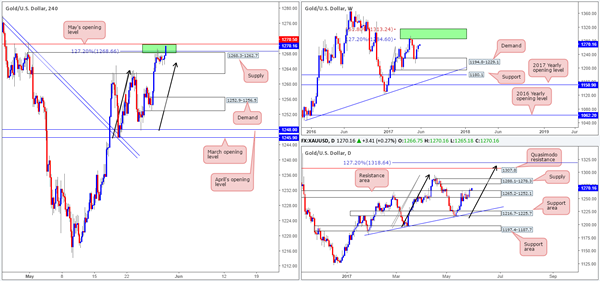
GOLD
While yesterday's sessions were relatively quiet given both the UK and US banks being closed, the bulls are currently showing some grit as we write. Between the top edge of a H4 supply zone at 1268.3, the H4 AB=CD 127.2% Fib ext. at 1268.6 (taken from the low 1245.9) and May's opening level at 1270.5, this small green area is under pressure.
Should this area be consumed, it's highly likely that the yellow metal will head to daily supply seen at 1288.1-1278.3, and possibly higher since there's a potential daily AB=CD bearish pattern that terminates a tad beyond a daily Quasimodo resistance at 1307.8. Also of interest is the two weekly Fibonacci extensions 161.8/127.2% at 1313.7/1285.2 taken from the low 1188.1 (green zone – next upside target on the weekly timeframe), which hold the said daily Quasimodo within.
Our suggestions: Despite this current H4 sell zone, our team is reluctant to pull the trigger here when both the weekly and daily charts show room to advance. With that being the case, we will humbly take a step back today, and look to reassess going into tomorrow's open.
Levels to watch/live orders:
- Buys: Flat (stop loss: N/A).
- Sells: Flat (stop loss: N/A).
Australia’s Building Approvals Sharply Rebounded In April
For the 24 hours to 23:00 GMT, the AUD declined 0.08% against the USD and closed at 0.7438.
LME Copper prices rose 0.1% or $6.0/MT to $5671.0/MT. Aluminium prices declined 0.2% or $4.0/MT to $1950.0/MT.
In the Asian session, at GMT0300, the pair is trading at 0.7427, with the AUD trading 0.15% lower against the USD from yesterday's close.
Early morning data indicated that Australia's seasonally adjusted building approvals rebounded 4.4% on a monthly basis in April, more than market expectations for an advance of 3.0%. In the preceding month, building approvals had fallen 10.3% in the prior month.
The pair is expected to find support at 0.7412, and a fall through could take it to the next support level of 0.7397. The pair is expected to find its first resistance at 0.7446, and a rise through could take it to the next resistance level of 0.7465.
Looking ahead, investors will focus on Australia's private sector credit data for April, slated to release tomorrow.
The currency pair is trading below its 20 Hr and 50 Hr moving averages.

Euro-Zone Still Needs Substantial Monetary Policy Support: ECB’s Draghi
For the 24 hours to 23:00 GMT, the EUR declined 0.26% against the USD and closed at 1.1136, on dovish comments from the European Central Bank (ECB) Chief, Mario Draghi.
The ECB President, in his testimony to the European Parliament, reaffirmed his view that the Euro-zone's economy still needs support of the central bank's expansive monetary stimulus to durably stabilise inflation around 2.0%, even though the common currency region is showing strong resurgence in the economic growth. Further, Draghi added that the ECB will be in a better position at its June meeting to reassess the outlook for growth and inflation.
On Friday, data indicated that Italy's consumer confidence index dropped more-than-anticipated to a level of 105.4 in May, compared to a revised reading of 107.4 in the prior month, while markets were expecting the index to ease to a level of 107.3.
On Friday, the second estimate of US annualised gross domestic product (GDP) was revised up sharply to 1.2% on a quarterly basis in the first quarter of 2017, compared to an advance of 0.7% registered in the preliminary print, suggesting that weakness in the nation's economic performance is likely to be transitory. However, it was the weakest performance since the first quarter of 2016. The GDP had risen 2.1% in the previous quarter, while investors had envisaged the nation to expand 0.9%.
In other economic news, flash durable goods orders in the US eased less-than-expected by 0.7% on a monthly basis in April, dropping for the first time in five months and compared to market expectations for a fall of 1.5%. In the prior month, durable goods orders had gained by a revised 2.3%. Meanwhile, the nation's final Reuters/Michigan consumer sentiment index rose less-than-expected to a level of 97.1 in May, compared to a reading of 97.0 in the previous month, while the preliminary print had indicated an increase to a level of 97.7.
Separately, on Friday, the Federal Reserve (Fed) Bank of San Francisco President, John Williams, reiterated his view that the Fed is likely to raise interest rates a total of three times this year.
In the Asian session, at GMT0300, the pair is trading at 1.1128, with the EUR trading 0.07% lower against the USD from yesterday's close.
The pair is expected to find support at 1.1103, and a fall through could take it to the next support level of 1.1079. The pair is expected to find its first resistance at 1.1171, and a rise through could take it to the next resistance level of 1.1215.
Moving ahead, investors will look forward to Germany's flash inflation figures and the Euro-zone's final consumer confidence data, both for May, slated to release in a few hours. Moreover, in the US, consumer confidence, personal income and personal spending data, all for May, set to be released later today, will be on investors' radar.
The currency pair is trading below its 20 Hr and 50 Hr moving averages.

Pound Trading A Tad Lower In The Asian Session
For the 24 hours to 23:00 GMT, the GBP slightly rose against the USD and closed at 1.2820.
In the Asian session, at GMT0300, the pair is trading at 1.2817, with the GBP trading marginally lower against the USD from yesterday’s close.
The pair is expected to find support at 1.2791, and a fall through could take it to the next support level of 1.2766. The pair is expected to find its first resistance at 1.2846, and a rise through could take it to the next resistance level of 1.2876.
Going ahead, market participants await the release of UK’s consumer confidence data for May, scheduled to release overnight.
The currency pair is trading below its 20 Hr and 50 Hr moving averages.

Japan’s Unemployment Rate Remained Unchanged In April
For the 24 hours to 23:00 GMT, the USD declined 0.1% against the JPY and closed at 111.26.
In the Asian session, at GMT0300, the pair is trading at 110.84, with the USD trading 0.38% lower against the JPY from yesterday's close.
Overnight data showed that Japan's jobless rate remained unchanged at 2.8% in April, meeting market expectations. Meanwhile, the nation's seasonally adjusted retail trade advanced more-than-expected by 1.4% MoM in April, compared to a gain of 0.2% in the previous month. Market expectation was for retail trade to climb 0.1%. Also, the nation's large retailers' sales rebounded 1.1% in April, following a drop of 0.8% in the previous month.
The pair is expected to find support at 110.61, and a fall through could take it to the next support level of 110.39. The pair is expected to find its first resistance at 111.23, and a rise through could take it to the next resistance level of 111.63.
The currency pair is trading below its 20 Hr and 50 Hr moving averages.

Swiss Franc Trading Slightly Higher, Ahead Of Switzerland’s KOF Leading Indicator Data For May
For the 24 hours to 23:00 GMT, the USD rose 0.35% against the CHF and closed at 0.9788.
On the macro front, Switzerland's total sight deposits inched up to a level of CHF576.0 billion in the week ended 26 May, from CHF575.5 billion reported in the previous week.
In the Asian session, at GMT0300, the pair is trading at 0.9787, with the USD trading marginally lower against the CHF from yesterday's close.
The pair is expected to find support at 0.9748, and a fall through could take it to the next support level of 0.9709. The pair is expected to find its first resistance at 0.9810, and a rise through could take it to the next resistance level of 0.9833.
Moving ahead, traders await the release of Switzerland's KOF leading indicator data for May, due in a few hours.
The currency pair is trading above its 20 Hr and 50 Hr moving averages.

Loonie Trading Marginally Lower In The Asian Session
For the 24 hours to 23:00 GMT, the USD rose 0.07% against the CAD and closed at 1.3472.
In the Asian session, at GMT0300, the pair is trading at 1.3474, with the USD trading a tad higher against the CAD from yesterday’s close.
The pair is expected to find support at 1.3442, and a fall through could take it to the next support level of 1.3411. The pair is expected to find its first resistance at 1.3491, and a rise through could take it to the next resistance level of 1.3509.
The currency pair is trading above its 20 Hr and 50 Hr moving averages.

ECB Will Deliver A Relatively Dovish Message Next Week
Market movers today
Focus today will be on inflation in the US and Germany, which will provide an important gauge of the underlying inflation pressures after a couple of months with volatile readings due to the timing of Easter.
In the US, the PCE inflation data for April is released. After the weak CPI report earlier in May, we estimate that PCE core rose 0.1% m/m, implying a core inflation rate of just 1.4% y/y (a decline from 1.6% in March).
As a prelude to the highly important CPI release for the whole euro area economy tomorrow, German inflation figures are released today. In line with our expectation, markets expect them to fall back in May versus April.
In Sweden, the main event this week is undoubtedly 2017 Q1 GDP data released today. We expect growth to come in at around 2.5% y/y (calendar adjusted) which is well in line with our exanteforecast . In Norway we have retail sales (for more details see page 2).
Selected market news
Yesterday, the market kept a close eye on the Draghi hearing for monetary policy clues ahead of the 8 June ECB meeting. But Draghi stuck to the party line saying that " Despite a firmer recovery, and looking through the volatile readings in HICP inflation over recent months, underlying inflation pressures have remained subdued. Domestic cost pressures, notably from wages, are still insufficient to support a durable and self-sustaining convergence of inflation toward our medium-term objective. For domestic price pressures to strengthen, we still need very accommodative financing conditions, which are themselves dependent on a fairly substantial amount of monet ary accommodation". Draghi added: "We remain firmly convinced that an extraordinary amount of monetary policy support , including through our forward guidance, is still necessary for the present level of under-utilized resources to be re-absorbed and for inflation to return to and durably stabilize around levels close to 2 percent within a meaningful medium-term horizon".
Hence, there was no sign that the ECB is about to make a U-turn despite the better economic data from the euro zone. We continue to hold the view that the ECB will deliver a relatively dovish message next week and importantly keep the commitment to low or " lower" rates.
Following the French election and the strong support for Merkel's CDU in t he German ländern elect ions, we have seen less focus on European politics and instead the focus has moved back to the Trump administration. However, yesterday Italy came into the spot light once again. 10Y Italian government bonds lost 12bp to Germany after former prime minister Mat teo Renzi suggested on Sunday that Italy's next election should be held in September around the same time as Germany's, saying that this would reduce market uncertainty about Italy, not increase it. The fixed income market obviously did not agree. Given that the media also reported that an agreement on the Italicum (electoral reform) is getting closer, a snap election in the autumn has become more likely. Most political analysts until recently had looked for elections to take place early in 2018. The Italian bond market could potentially be in for a volatile summer.
European Open Briefing: The Commodity Currencies Were Quiet Overnight
Global Markets:
- Asian stock markets: Nikkei down 0.45 %, ASX 200 gained 0.05 %, Shanghai Composite and Hang Seng closed for holiday
- Commodities: Gold at $1270 (+0.15 %), Silver at $17.45 (+0.70 %), WTI Oil at $49.75 (-0.15 %), Brent Oil at $52.40 (-0.50 %)
- Rates: US 10-year yield at 2.24, UK 10-year yield at 1.02, German 10-year yield at 0.30
News & Data
- Japan Retail Sales y/y 3.2 % vs 2.3 % expected
- Japan Unemployment Rate 2.8 % vs 2.8 % expected
- Japan Household Spending m/m 0.5 % vs 1.1 % expected
- Japan Household Spending y/y -1.4 % vs -0.7 % expected
- Australia Building Approvals 4.4 % vs 3.0 % expected
- New Zealand Building Consents m/m -7.6 % vs -1.2 % previous
- Greece, Italy tensions hit euro, Asian stocks, lift yen, gold – RTRS
- Oil inches up in quiet holiday trade, focus on crude glut – RTRS
- Dollar firms against sterling, euro amid political uncertainties – RTRS
- Draghi says ECB stimulus still needed despite better growth – RTRS
Markets Update:
The Euro came under pressure following comments from ECB President Draghi and news that there might be an early election in Italy in September. Draghi stated that there is still need for a substantial stimulus as inflation remains subdued. Meanwhile, former Prime Minister Renzi, who is looking for a political comeback, said that he supports an election as early as September. Domestic stock markets reacted negatively, and Italian government bonds also declined.
EUR/USD fell from 1.12 to a low of 1.1120 in Asia. Immediate support is seen at 1.111, but the next important level is 1.1050.
GBP/USD is also suffering from political developments. British Prime Minister Theresa May's lead over the opposition Labour Party dropped to 6 percentage points as the latest poll showed. Following the break below 1.2820 support, a test of 1.27 seems likely in the near-term.
The commodity currencies were quiet overnight. AUD/USD consolidated in a 0.7420-40 range, while NZD/USD traded between 0.7035 and 0.7055.
Upcoming Events:
- 07:45 BST – French GDP
- 10:00 BST – Euro Zone Consumer Confidence
- 10:00 BST – Euro Zone Business Climate
- 13:00 BST – German CPI
- 13:30 BST – US Personal Spending
- 13:30 BST – US Personal Income
- 13:30 BST – Canadian Current Account
- 15:00 BST – US CB Consumer Confidence
Daily Technical Analysis: EUR/USD Bearish Breakout Starts Wave 3 Momentum
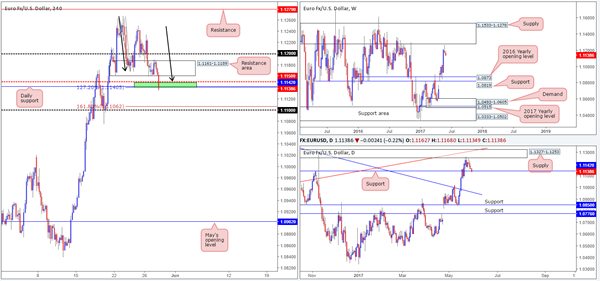
Currency pair EUR/USD
The EUR/USD has broken below the support trend line (dotted blue) which could kick start momentum within wave 3 (blue) towards the Fibonacci targets. A break above the resistance (red/orange) invalidates the wave 3 formation.
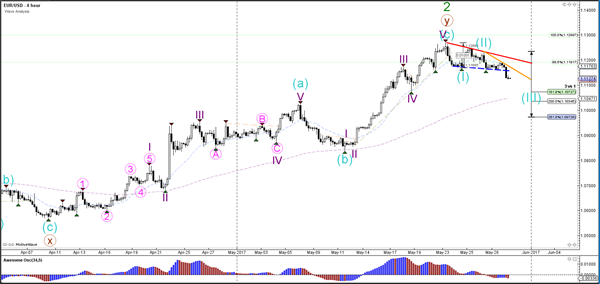
The EUR/USD seems to be building a 5 wave extension (purple) within the 3rd wave (blue).
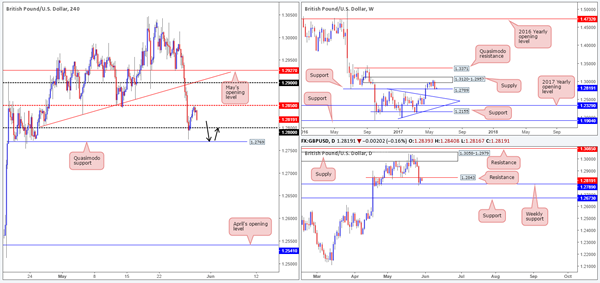
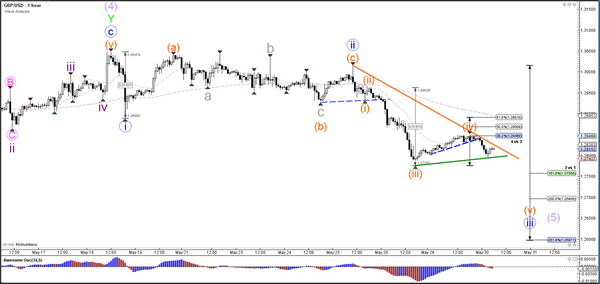
Currency pair GBP/USD
The GBP/USD is building a small correction but a break below support (green) could see wave 3 (blue) continue.
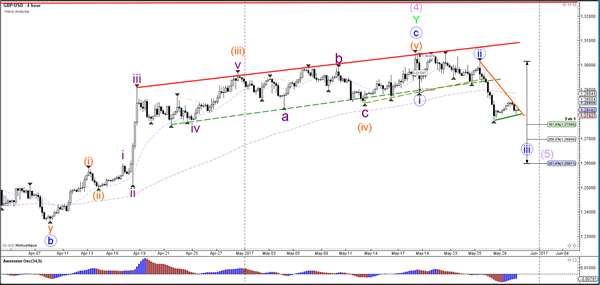
The GBP/USD stopped and reversed at the 38.2% Fibonacci level of wave 4 (orange) as expected in yesterday's analysis. A break above the trend line (orange) could see price challenge higher Fibs but a break above the 61.8% Fib makes a wave 4 unlikely.
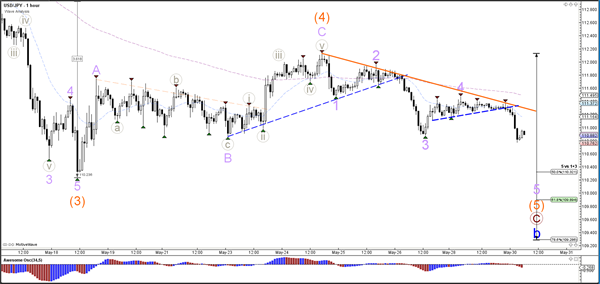
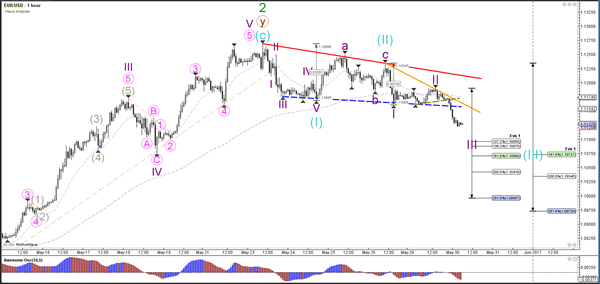
Currency pair USD/JPY
The USD/JPY is in a descending wedge pattern with support (green) and resistance (orange) nearby. A bearish break could see price fall towards the Fibonacci retracement levels of wave B (blue).
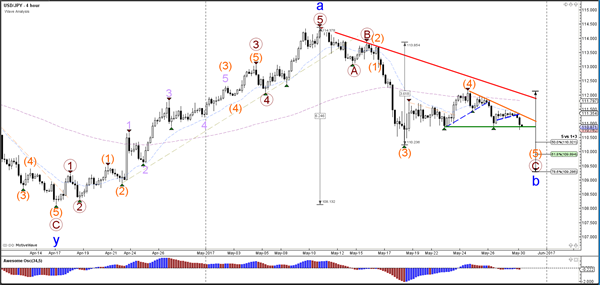
The USD/JPY broke below support (dotted blue) and completed a wave 4 (blue). Price remains in a 5th wave as long as it remains below resistance (orange).