Sample Category Title
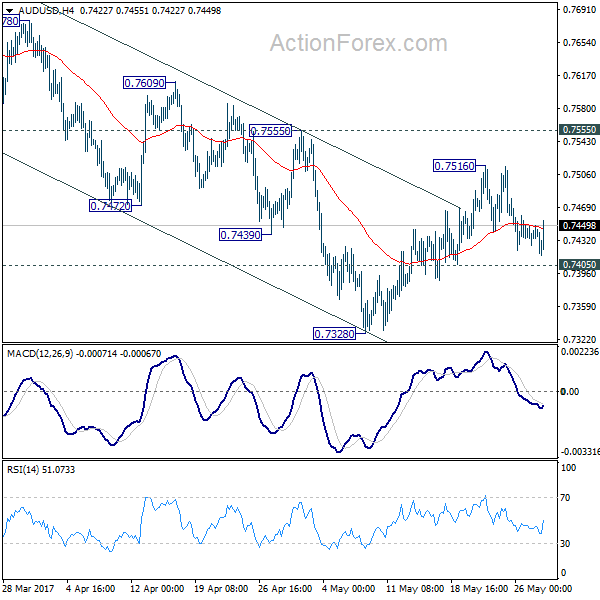
AUD/USD Daily Outlook
Daily Pivots: (S1) 0.7427; (P) 0.7438; (R1) 0.7450; More...
Intraday bias in AUD/USD remains neutral for the moment. Overall, as long as 0.7555 resistance holds, fall from 0.7748 is still expected to continue. Below 0.7405 minor support will turn bias to the downside for 0.7382. Break there will target 0.7144/7158 support zone. However, firm break of 0.7555 will argue that fall from 0.7748 is completed and turn bias back to the upside.
In the bigger picture, we're still treating price actions from 0.6826 low as a corrective pattern. And, as long as 38.2% retracement of 0.9504 to 0.6826 at 0.7849 holds, long term down trend from 1.1079 is expected to resume sooner or later. Break of 0.6826 low will target 0.6008 key support level. However, firm break of 0.7849 will indicate that rise from 0.6826 is developing into a medium term rebound, rather than a sideway pattern. In such case, stronger rise should be seen to 55 month EMA (now at 0.8115) and above.

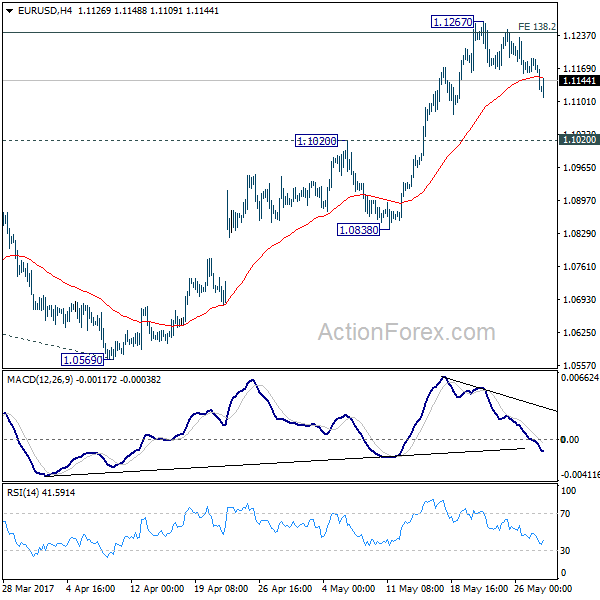
EUR/USD Daily Outlook
Daily Pivots: (S1) 1.1152; (P) 1.1170 (R1) 1.1180; More....
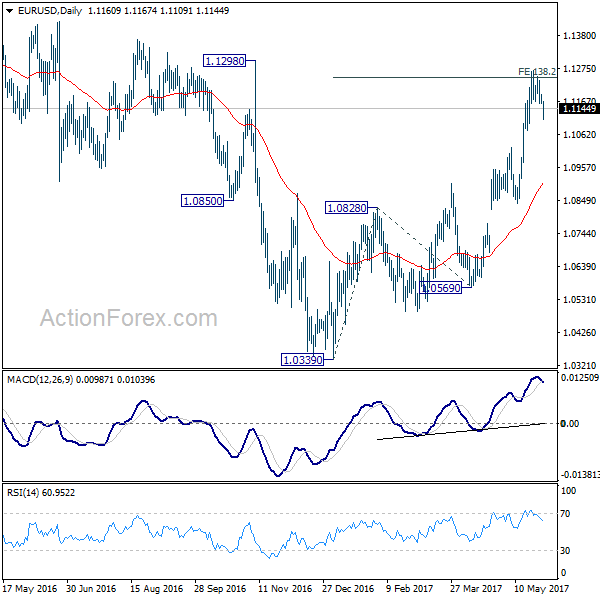
EUR/USD's pull back from 1.1267 extends lower today. But it's kept well above 1.1020 resistance turned support so far. Intraday bias remains neutral first. At this point, we remain cautious on strong resistance from 1.1245/98 (138.2% projection of 1.0339 to 1.0828 from 1.0569 at 1.1245) to limit upside and bring reversal. Break of 1.1020 resistance turned support will indicate rejection from 1.1245/98 and turn bias to the downside for 1.0838 support. Nonetheless, decisive break of 1.1298 will carry larger bullish implication and target 1.1615 resistance next.
In the bigger picture, the case for medium term reversal continues to build up with EUR/USD staying far above 55 week EMA (now at 1.0888). Also, bullish convergence condition is seen in weekly MACD. Focus will now be on 1.1298 key resistance. Rejection from there will maintain medium term bearishness and would extend the whole down trend from 1.6039 (2008 high). However, firm break of 1.1298 will indicate reversal. In such case, further rally would be seen back to 1.2042 support turned resistance next.
GBP/USD Daily Outlook
Daily Pivots: (S1) 1.2804; (P) 1.2827; (R1) 1.2859; More...
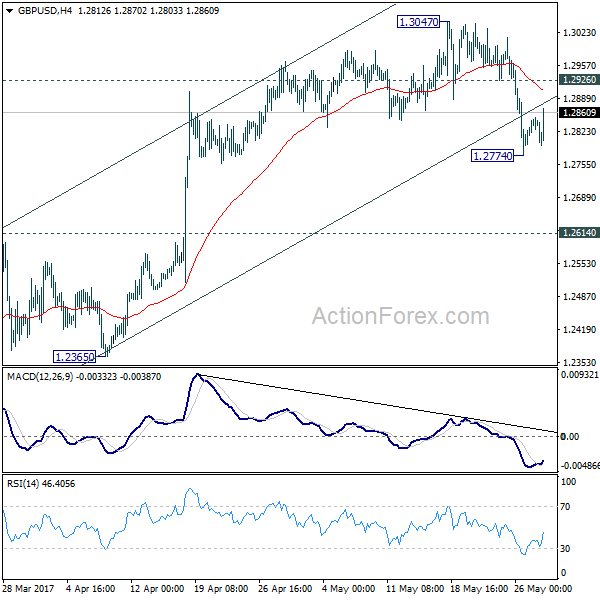
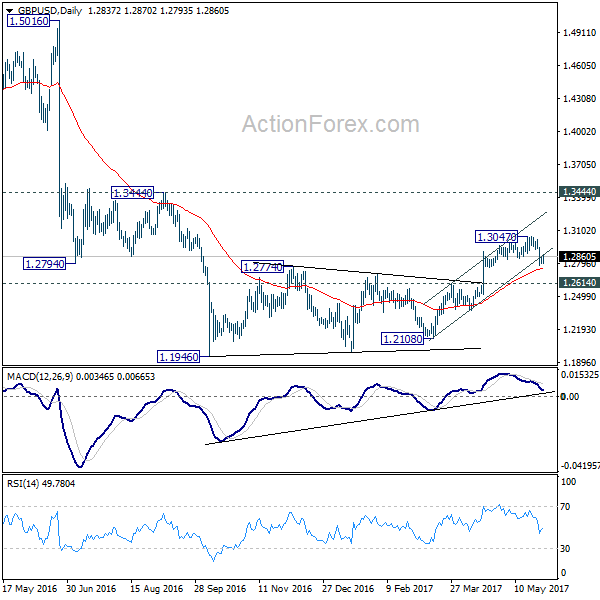
A temporary low is in place at 1.2774 in GBP/USD and intraday bias is turned neutral first. We're holing on to view that rise from 1.2108 is completed. Hence, upside of current recovery should b limited by 1.2926 minor resistance and bring another decline. below 1.2774 will target 1.2614 resistance turned support next. Break there should also indicate completion of whole consolidation pattern from 1.1946 and target a retest on this low. Meanwhile, above 1.2926 minor resistance will turn focus back to 1.3047 high instead.
In the bigger picture, fall from 1.7190 is seen as part of the down trend from 2.1161. The rejection from 55 week EMA is maintaining bearishness in the pair. Also, at this point, as long as 1.3444 resistance holds, fall from 1.7190 is still expected to continue. Break of above mentioned 1.2614 support will affirm this bearish case.
China Adds Adjustment Factor To Renminibi Fixing, Diverging From Free-Float?
The Chinese government has accelerated its step to guide the renminbi higher and the immediate effect is a selloff of USDCNY to the lowest level since January, 2017. Last week, the China Foreign Exchange Trade System (CFETS) confirmed that China's central bank has added a counter cyclical adjustment factor (CCAF) to the calculation of the USDCNY daily fixing rate. The government indicated that the adjustment factor would help guide market expectations and let the fix reflect more accurately China's macroeconomic fundamentals. It is appropriate for the move to be introduced in this period of time when the US dollar is weak, as, in our view, the aim of which is to stabilize renminbi, i.e. to prevent it from weakening too much. Given the lack of the details of this adjustment factor, the movement of renminbi is getting more non-transparent, as well as government-driven, rather than market- driven.
In the second half of 2015, China's the fixing mechanism for renminbi included three main elements, namely, the previous day's close, overnight movement of the USD against a basket of currencies and “market supply-demand conditions”. The third element, of which the nature was never disclosed, was removed in May 2016 before a counter cyclical adjustment factor (CCAF) was added last week. There lacks details over what the CCAF is other then it would be “dynamically adjusted" to reflect China's macroeconomic fundamentals and set in a way that helps the fix to better reflect fundamentals. We believe the CCAF is included as the government finds ways to fix its currency higher. Indeed, the CFETS had indicated that the renminbi fixing rate based on the previous formula depreciated although the USD index (DXY) had weakened while China's economic indicators had improved recently. CFETS suggested that the FX market might have been distorted by herd behavior and irrational expectations.
With timing of introducing this CCAF is also strategic. First, it is when the US dollar has weakened with the DXY index falling to a level not seen since November last year. Lowering USDCNY amidst weakness in US dollar creates a buffer when the greenback strengthens. Domestically, slowdown in capital outflows should help lift expectations on renminbi appreciation. Moreover, the government would prefer to see a stable currency, as well as economic developments, ahead of and during the 19th Party Congress and the subsequent National Peoples' Congress in March 2018.
A currency subject to more government intervention means it would be less market driven. Furthermore, the government has not disclosed any information about the mechanism of, and criteria in, the adjustment factor. The lack of transparency, together with fact that the government changes its currency basket from time to time, has made estimation of the renminbi movement even more difficult. We believe the move is a setback for the currency's internationalization progress.
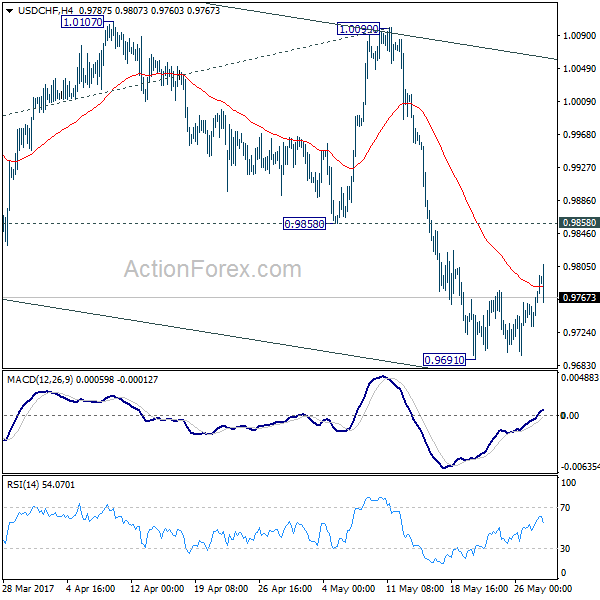
USD/CHF Daily Outlook
Daily Pivots: (S1) 0.9743; (P) 0.9759; (R1) 0.9786; More.....
USD/CHF recovers further today but after all it's staying in consolidation from 0.9691. Intraday bias remains neutral for the moment. We'd continue to expect upside to be limited by 0.9858 support turned resistance and bring fall resumption. Whole decline from 1.0342 is still in progress and below 0.9691 will target 100% projection of 1.0342 to 0.9860 from 1.0099 at 0.9617. We'll start to look for reversal signal below there.
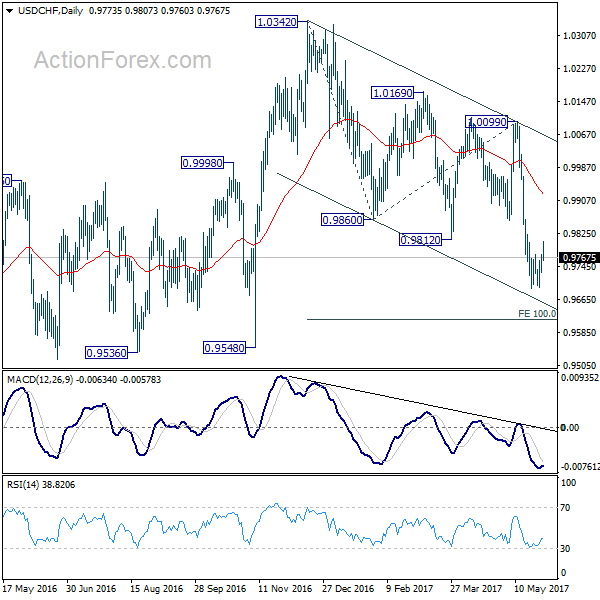
In the bigger picture, USD/CHF is bounded in medium term range of 0.9443/1.0342 for the moment. Consolidative trading would likely continue and medium term outlook remains neutral. Break of 1.0342 key resistance is needed to confirm underlying bullish momentum in the pair. Meanwhile, downside attempts should be contained by 0.9443 key support level.
USD/JPY Daily Outlook
Daily Pivots: (S1) 111.10; (P) 111.28; (R1) 111.44; More...
Breach of 110.85 minor support argues that USD/JPY's recovery from 110.23 is finished at 112.12, after failing to sustain above 4 hour 55 EMA and 55 day EMA. Intraday bias is turned back to the downside to 110.23 first. Break will extend the fall from 114.36 to 108.12 low and below. Note again that decline from 118.65 is seen as a correction. In that bearish case, we'll look for bottoming signal again at 61.8% retracement of 98.97 to 118.65 at 106.48. On the upside, above 111.46 minor resistance will turn intraday bias neutral again first.
In the bigger picture, price actions from 125.85 high are seen as a corrective pattern. It's uncertain whether it's completed yet. But in case of another fall, downside should be contained by 61.8% retracement of 75.56 to 125.85 at 94.77 to bring rebound. Overall, rise from 75.56 is still expected to resume later after the correction from 125.85 completes.


Politics To Continue Influencing The Pound’s Direction
After suffering its heaviest week of losses so far in 2017, the British Pound is attempting to consolidate around 1.28 against the US Dollar. I personally think that politics will continue to influence the direction of the British Pound, and I believe that there is further momentum for the currency to fall with the UK General Election being a little over a week away. In general, the markets do not like uncertainty and this is the recurring theme for the UK at present with another election around the corner and ongoing Brexit uncertainty continuing to dominate news headlines.
My view is that even following the dip lower from the 2017 highs above 1.30 is that the financial markets are still underpricing the risk of an unexpected outcome to the election next week. Investors in general stacked their cards heavily in favour of Theresa May being declared the winner following the unexpected calling of a snap election, but opinion polls are currently showing that the race to winning the election is going to be close. I can't help but think that recent history could be repeating itself with the markets currently underpricing the risk of an outcome that could differ to what the markets expect, which is a Conservative victory on 8 June.
USDJPY – a game of politics vs economics
The British Pound is not alone in being underpinned to political risk, with politics vs. economics being the name of the game when it comes to trading the USDJPY. I believe that politics will continue to dictate the direction of this pair as we head into the second half of 2017, and I am actually favouring towards the Japanese Yen covering further ground against its counterparts on the back of safe-haven buying.
A lack of optimism around the likelihood that President Trump will be able to push forward with his legislative reforms will put the spotlight firmly on Washington, and I think that this will result in further pressure on the USD. Any further market uncertainty in the United States will eventually lead to investors being lured back into the safe-haven appeal of the Yen.
EURUSD – facing near-term selling pressure
The likelihood that the ECB will repeat its dovish rhetoric during its Central Bank meeting in June is encouraging traders to enter selling positions on the Eurodollar after the pair reached new 2017 milestone highs above 1.12 last week. Despite economic data around Europe continuing to improve confidence that the economy has turned a corner, the market is swaying towards the belief that the ECB will repeat in June that the economy still requires ECB stimulus and this could result in the Eurodollar slipping further towards 1.10.
Oil markets remain pessimistic on OPEC outcome
Investors remain unimpressed with the outcome of the OPEC meeting late last week, with the commodity once again encountering selling pressure around $50. The general view is that the OPEC meeting outcome was very predictable with investors pricing in a nine-month extension to the production cut some time ago, and confirmation of what was already expected beforehand just led to a “sell-on news” opportunity for traders. I maintain the viewpoint that the mindset of investors will remain tilted towards sell-on rally opportunities and I think traders are likely to continue entering selling positions around $50 as they have done for a number of months.
The negative expectations on the oil markets are not due to a lack of effort from the side of OPEC; it is more linked to the belief that US Shale producers will turn the volume up on increased production. The ongoing threat to investor sentiment when it comes to the oil markets is that no matter what OPEC try to do to rebalance the ongoing oversupply in the markets, US Shale producers will be able to offset the efforts by increasing inventories from their side.
Can Gold keep its feet above $1260?
Gold managed to conclude trading last week above $1260, and the outlook is that there is room for further appreciation towards $1275 as long as the precious metal is able to keep its feet above $1260. There are a couple of factors that can encourage a supportive view towards a stronger valuation in Gold over the coming weeks, including the probable US interest rate increase in June already being priced into the financial markets and any market uncertainty over the impending UK General Election encouraging a rally for safe-haven assets.
EUR/GBP Daily Outlook
Daily Pivots: (S1) 0.8680; (P) 0.8703; (R1) 0.8716; More...
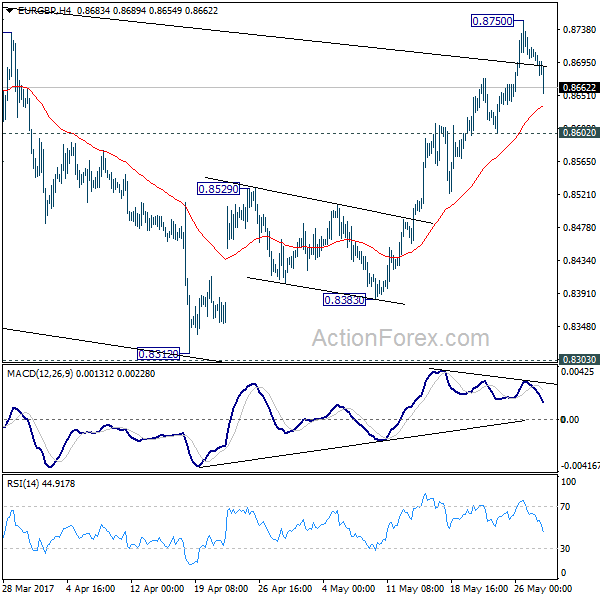
The pull back from 0.8705 extends lower and intraday bias stays neutral first. While more consolidations is expected, near term outlook will remain mildly bullish as long as 0.8602 support holds and further rally would be seen. Above 0.8750 will target 0.8786 resistance first. Break of 0.8786 would pave the wave for retesting 0.9304 high. Break of 0.8602, however, will argue that the rebound from 0.9312 has completed and turn bias back to the downside for 0.8529 first.
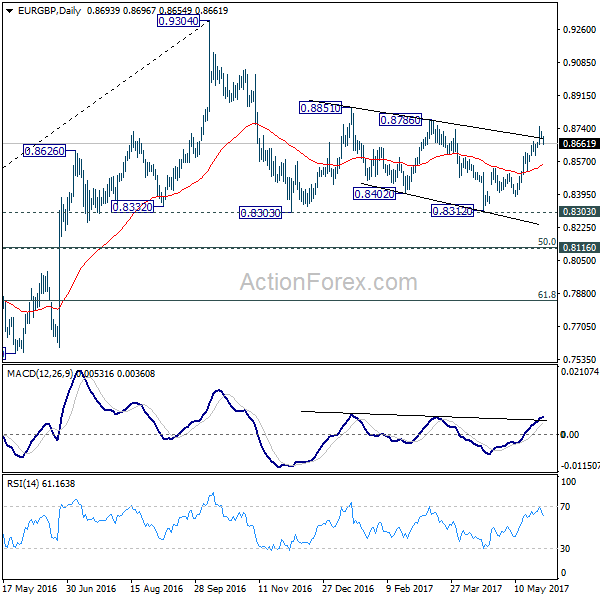
In the bigger picture, price actions from 0.9304 are viewed as a medium term corrective pattern. The leg from 0.9304 should have completed after taking 0.8332 structural support. But it's too early to say that larger rise from 0.6935 is resuming. Rejection from 0.9304 will extend the consolidation with another falling leg. Meanwhile, firm break of 0.9304 will target 0.9799 (2008 high). In case of another decline, we'd expect strong support from 0.8116 cluster support (50% retracement of 0.6935 to 0.9304 at 0.8120) to contain downside and bring rebound.
Technical Outlook: GBPUSD Trades In Extended Consolidation, Near-Term Bias Remains With Bears
Cable is trading within narrow consolidation above one-month low at 1.2775 for the second day with mixed signals from technical studies seeing no clear direction in the near-term.
The latest polls showed narrowing lead of Conservative party over Labour party that may pressure sterling further in the days ahead of election.
Near-term structure is bearish and recovery attempts being so far capped by thick hourly cloud, keeping initial resistance at 1.2850 (Monday's high) intact for now.
Friday's long bearish candle continues to weigh, with bears requiring clear break below 1.2786 (Fibo 38.2% of 1.2365/1.3047 upleg) to signal fresh extension of pullback from 1.3047 peak towards next support at 1.2706 (55SMA).
Rising and thickening daily cloud is underpinning broader rally (cloud top lies at 1.2662) and should contain extended dips.
Meantime, bullish signal is developing on reversal of daily slow stochastic from oversold zone that may pause bears for extended consolidative/corrective action.
Converged daily Tenkan-sen / Kijun-sen lines (1.2911) are expected to cap upticks.
Res: 1.2850, 1.2866, 1.2895, 1.2911
Sup: 1.2786, 1.2775, 1.2755, 1.2706
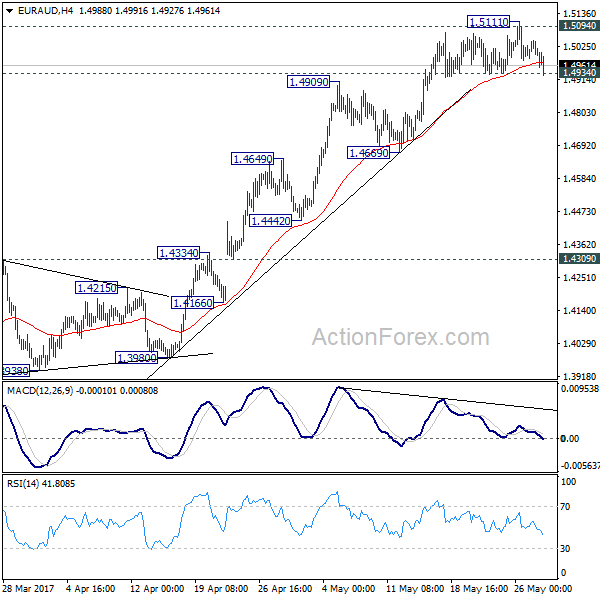
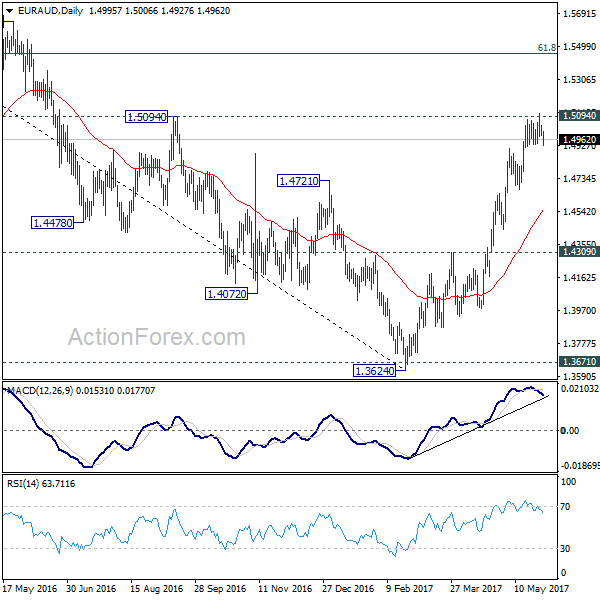
EUR/AUD Daily Outlook
Daily Pivots: (S1) 1.4975; (P) 1.5010; (R1) 1.5033; More...
Intraday bias in EUR/AUD stays neutral first. Firm break of 1.4934 support will confirm short term topping, on bearish divergence condition in 4 hour MACD, after hitting 1.5094 key resistance. In that case, deeper pull back would be seen to 55 day EMA (now at 1.4540). Meanwhile, sustained break of 1.5094 resistance will extend the rally from 1.3624 to next medium term fibonacci level at 1.5455.
In the bigger picture, price actions from 1.6587 medium term top are viewed as a corrective pattern. Such correction should be completed at 1.3624 after defending 1.3671 key support. Rise from 1.3642 is now expected to target 61.8% retracement of 1.6587 to 1.3624 at 1.5455 and above. In any case, outlook will now stay cautiously bullish as long as 1.4309 resistance turned support holds.