
Sample Category Title
EUR/AUD Daily Outlook
Daily Pivots: (S1) 1.4975; (P) 1.5010; (R1) 1.5033; More...
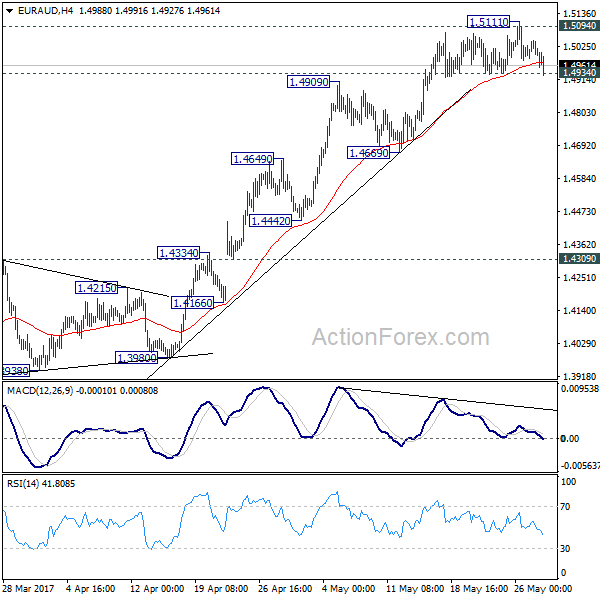
Intraday bias in EUR/AUD stays neutral first. Firm break of 1.4934 support will confirm short term topping, on bearish divergence condition in 4 hour MACD, after hitting 1.5094 key resistance. In that case, deeper pull back would be seen to 55 day EMA (now at 1.4540). Meanwhile, sustained break of 1.5094 resistance will extend the rally from 1.3624 to next medium term fibonacci level at 1.5455.
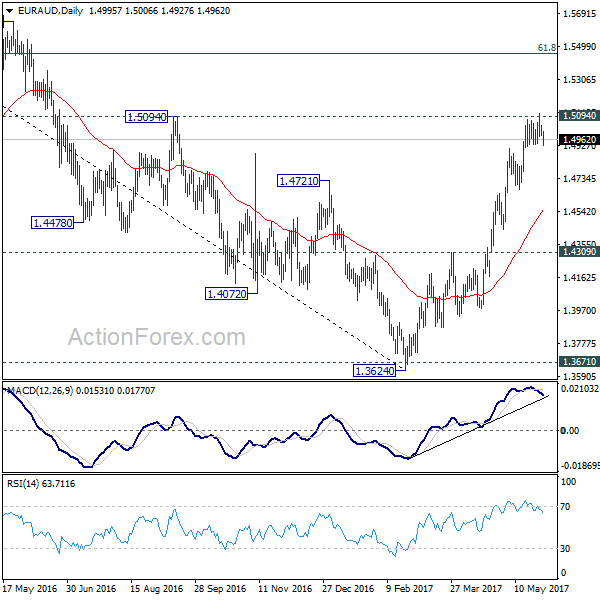
In the bigger picture, price actions from 1.6587 medium term top are viewed as a corrective pattern. Such correction should be completed at 1.3624 after defending 1.3671 key support. Rise from 1.3642 is now expected to target 61.8% retracement of 1.6587 to 1.3624 at 1.5455 and above. In any case, outlook will now stay cautiously bullish as long as 1.4309 resistance turned support holds.
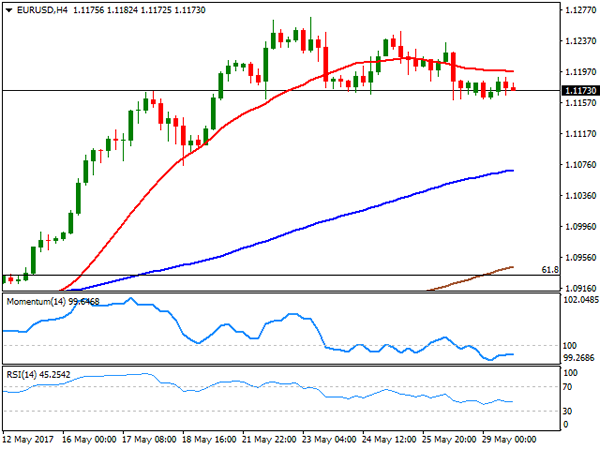
Technical Outlook: EURUSD Extends Weakness Near 1.1100 Pivot On Fresh Negative Sentiment
The Euro fell further in Asia, coming under fresh pressure after ECB chief Draghi signaled in his speech on Monday that stimulus program is likely to extend. Also, fresh risk aversion in the markets that sent EURJPY cross significantly lower dragged the EURUSD pair.
Concerns about Greek bailout are adding on developing negative sentiment around the Euro.
The pair is trading in red for the fourth consecutive day and hit session low just ahead of 1.1100 support (Fibo 38.2% of 1.0839/1.1268 upleg), which marks the trigger for further weakness.
Break below 1.1100 handle could accelerate through 1.1060 (base of thick 4-hr cloud, reinforced by rising 20SMA ) and may extend towards psychological 1.1000 support (also Fibo 61.8% of 1.0839/1.1268).
Daily RSI reversed from overbought territory and shows a plenty of room at the downside, however, oversold slow stochastic suggests bears may pause, but so far lacking firmer signal as the indicator is still heading south.
Broken daily Tenkan-sen caps Tuesday’s action at 1.1071 and marks initial barrier, with extended upticks expected to hold below 4-hr cloud top (1.1194) to keep near-term bears in play.
German inflation and EU Consumer confidence data are due later and eyed for further signals.
Res: 1.1171, 1.1194, 1.1234, 1.1250
Sup: 1.1100, 1.1060, 1.1053, 1.1000
Currencies: EUR/USD Declines On Soft Draghi Comments And Return Of Political Risk
Sunrise Market Commentary
- Rates: Inflation key, but investor's won't lose their nerves
Today's calendar heats up. We focus on German (CPI) and US (PCE) inflation readings. Markets will probably be most sensitive to hawkish surprises in EMU and dovish ones in the US. This week's backloaded eco calendar suggests that investors' won't rush into hurried conclusions though. Sentiment on EMU bond markets is a wildcard for trading. - Currencies: EUR/USD declines on soft Draghi comments and return of political risk
Yesterday and this morning, the euro was in the defensive as soft Draghi comments and uncertainty on Greece and Italy provided a good reason to take further profit on the recent EUR/USD rally. Today, the focus will be on price data in the US and Germany. The euro looks more vulnerable than the dollar if sentiment turns risk-off
The Sunrise Headlines
- US and UK investors return from the long weekend today after yesterday's Memorial Day and Spring Bank Holiday. Overnight, Asian stock markets trade mixed.
- Big banks are throttling back from the $1.2T US car loan market, fearing that consumers have taken on more debt than they can handle. Data released last week showed the 1st sequential drop in car loans outstanding in at least 6 years.
- Japan's unemployment rate held steady at 2.8% in April, at a 23-yr low. Japan's household spending pushed further into contraction, but retail sales rose at a faster rate thanks to a boost from department stores and supermarkets sales.
- St. Louis Fed Bullard says jury is still out on whether government policies will meet expectations that have been priced into equity markets.
- Greece's government is preparing to possibly go without next bailout payment if creditors don't agree on debt relief for the country, Bild reports, without saying where it obtained the information.
- North Korea's latest missile launch is its 3rd apparent breakthrough in missile technology in less than 3 weeks. Kim Jong Un expressed the conviction that it would make a greater leap forward in the spirit to send a bigger 'gift package' to the Yankees in retaliation for American military provocation, according to KCNA.
- Today's eco calendar heats up with EC confidence data, German (CPI) and US (PCE) inflation readings, US personal income/spending data and consumer confidence. Italy taps the market and ECB Liikanen and Fed Brainard speak
Currencies: EUR/USD Declines On Soft Draghi Comments And Return Of Political Risk
EUR/USD eases further off last week's top
Trading in EUR/USD and USD/JPY was confined to tight ranges yesterday with US and UK markets closed. ECB's Draghi maintained a soft approach in his appearance before the EU parliament. EUR/USD reversed modest gains after Draghi's testimony. EUR/USD closed the session at 1.1164, near the intraday low. USD/JPY finished an uneventful session at 111.27.
Overnight, Asian markets started with a cautious risk-off bias, but the losses are limited and eased as the session proceeds. Chinese markets are closed. Japanese eco data were mixed. The jobless rate (2.8%) is holding at a multi-year low and the Job-to-applicants ratio rose to the highest level since 1974. For now the favourable job market didn't lead to a pick in consumer spending. The yen holds strong. USD/JPY dropped below 111 and is testing last week's low. The move is in the first place due to the cautious risk sentiment, but Japanese factors might also play a secondary role (recent rise in short-term yields, decent eco data). The USD/JPY decline also pressured EUR/JPY (123.40) and EUR/USD (1.1130).
The eco calendar is well filled today. Confidence data from the European Commission are expected to confirm the improvement seen in other confidence indicators. German CPI is expected to decline 0.1% M/M to be up 1.5% Y/Y (from 2.0% in April). The swings are partially driven by technical factors, but a decline in German/EMU inflation might be seen as supporting the case for a cautious ECB approach. In the US, the personal income and spending data are expected at a decent 0.4%, but the deflators are expected slightly softer from March (1.7% from 1.8 for the overall deflator). US consumer confidence (conference board) is expected to decline slightly from a very high level
The price data (both in the US and Europe) and global risk sentiment are probably key for global/FX trading today. We don't expect the US data to be that poor that they will question a June Fed rate hike. Soft German inflation data have the potential to reinforce the recent euro correction. EMU political risk is also again on the radar (speculation on Italian elections and Greece looking for confirmation on debt relief). The soft Draghi comments might have a slightly negative impact on the euro.
So, the EUR/USD correction off last week's top might continue. USD/JPY, EUR/JPY and EUR/USD might feel more downside pressure if sentiment turns more risk-off.
Of late, the dollar traded soft. US data were a bit disappointing, markets turned more cautious on Trump's pro-growth agenda and US yields declined, keeping the dollar in the defensive. At the same time, the euro profited of reduced political risk on the region. This picture hasn't profoundly changed, but last week, there were tentative signs that the dollar decline could slow. Is enough USD softness discounted? This week's payrolls and manufacturing ISM might be important in this assessment. At the same time the euro positive momentum is also fading.
Technical picture
The USD/JPY rebound ran into resistance early May. A mini-sell-off pushed the pair back below the 112.20 previous top and made the short-term picture negative. Return action lower in the 108.13/114.37 range is possible.
Earlier this month, it looked that EUR/USD could revisit 1.0821/1.0778 support (gap). However, poor US data and political upheaval finally propelled EUR/USD north of the 1.1023 range top. The pair reached a short-term correction top at 1.1268. The correction top at 1.1300/1.1366 is next resistance. USD sentiment will have to be extremely negative to clear this hurdle short-term. Further ST EUR/USD gains might become tougher. A return below 1.1023 would indicate that the upside momentum has eased.
EUR/USD: correction off last week's top continues on soft Draghi comments and as EMU political risk returns to the radar
EUR/GBP
Focus for sterling trading remains on the opinion polls
UK markets were closed for the Spring bank holiday yesterday. Markets are keen to see whether PM May's conservative party can stop the erosion of its lead in the opinions polls for the June 08 elections. Political uncertainty didn't cause additional harm on sterling yesterday even as polls during the weekend confirmed the narrowing gap with Labour. Cable closed a thinly traded session at 1.2840. EUR/GBP finished the day at 0.8695. Post-Draghi euro softness also weighed slightly on EUR/GBP.
There again no important eco data in the UK today. Focus will remain on the UIK political scene. Uncertainty on the lead of the conservative party is a negative for sterling short-term. Contrary to what was the case of late, this might in the first place be visible in cable (rather than in EUR/GBP). The picture for EUR/GBP is more mixed as the single currency is also in the defensive. EUR/GBP trades off last week's top in the mid 0.87 area. Further consolidation/correction on the May rally might be on the cards
EUR/GBP: euro weakness dominates even as UK political uncertainty continues to play a role
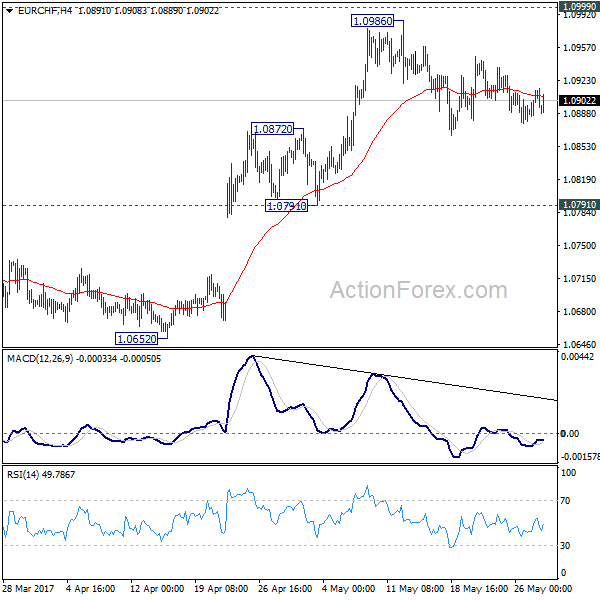
EUR/CHF Daily Outlook
Daily Pivots: (S1) 1.0887; (P) 1.0900; (R1) 1.0922; More...
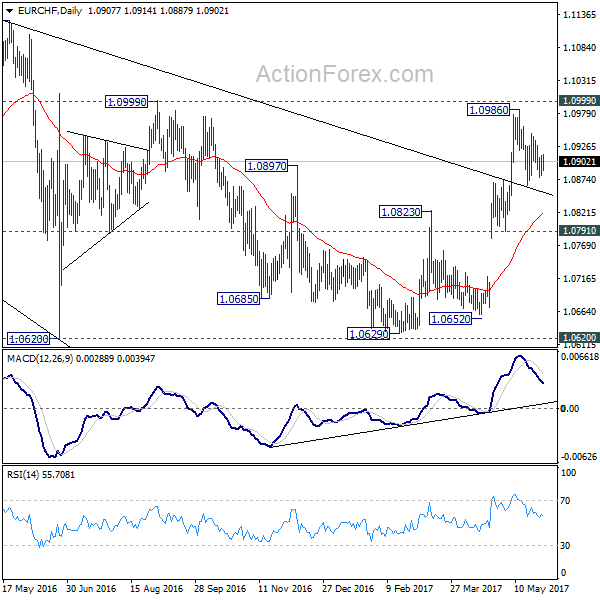
EUR/CHF is still engaging in the consolidation pattern from 1.0986 and intraday bias remains neutral first. Deeper fall could be seen but downside should be contained by 1.0791/0872 support zone to bring rise resumption. As noted before, the consolidative pattern from 1.1198 should be completed. Firm break of 1.0999 resistance will pave the way for a retest on 1.1198 high.
In the bigger picture, the price actions from 1.1198 are seen as a corrective move. Current strong rebound is raising the chance that it's completed after defending 38.2% retracement of 0.9771 to 1.1198 at 1.0653. Decisive break of 1.0999 resistance will target a test on 1.1198 high. For now, this will be the preferred case as long as 1.0791 support holds.
EURUSD Likely To Test $1.1100 US PCE Data Eyed
Following a slow start on Monday which saw the US and the UK markets closed, the economic calendar picks up pace today. The US personal consumption expenditure, income and spending data are on the cards with the broad data expected to show a pickup in spending and income.
The US dollar is currently seen pushing higher and a positive string of economic releases could help to keep the current recovery in the greenback intact. The markets were mostly mixed yesterday despite a slow trading and lack of any clear fundamentals to act as a catalyst.
Besides the data from the US the regional GDP numbers from the eurozone will be coming out. France GDP and preliminary inflation figures from Germany will help shape expectations for the euro ahead of this week's flash inflation estimates that will be key for the common currency.
EURUSD intraday analysis
EURUSD (1.1126): The euro attempted to rally but price action turned weaker by end of day. The EURUSD is currently seen pushing lower and it is likely that the support level at $1.1100 will be tested in the near term.
The currency pair is likely to see some bounce at this support level but could remain subdued below $1.1200. A break out below $1.1100 is required for EURUSD to target $1.1000 which could happen towards Friday's non-farm payrolls release.
GBPUSD intraday analysis
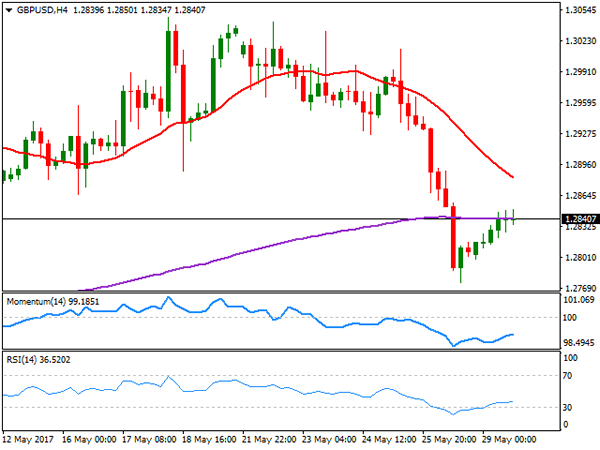
GBPUSD (1.2819): The British pound managed to stabilize following last Friday's strong declines that sent the cable to test $1.2800 support.
The modest recovery yesterday however failed to offer any bounce as price reverted to the support level once again which is being tested. The near-term bias remains flat in GBPUSD unless we see a strong break down below $1.2800. A better than expected PCE data today could help price to break down leaving the declines exposed towards $1.2600 support level which is the next downside target.
XAUUSD intraday analysis
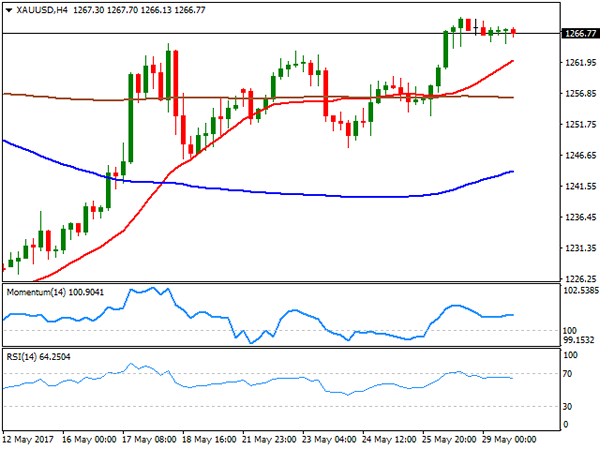
XAUUSD (1268.00): Gold prices continued to post modest gains with price rising to a fresh one-month high earlier today at $1270.47.
The next main resistance level is seen at $1274.00 which could be tested over the remainder of the week. In the near term, the current pullback could see gold prices retest the support at $1263.00. This level had previously acted as resistance in the past two weeks. Therefore, there is a strong chance that the newly developed support could hold prices. A break down below $1263.00 could however push gold prices lower, invalidating the bullish outlook to $1274.00 with prices instead likely to test $1250.00 support.
Foreign Exchange Market Commentary: EUR/USD, USD/JPY, GBP/USD, GOLD, WTI CRUDE, DJIA, FTSE100, DAX
EUR/USD
It was a dull Monday with holidays in most major markets keeping activity to the minimum across the FX board. China, the UK and the US, all remained closed at the beginning of the week. The only relevant event of the day was ECB's Draghi's testimony before the European Parliament, which added nothing new to what the market already knew. Draghi stressed the need for further monetary support, as despite the downside risks to the economic outlook have been diminishing, it's too early to retrieve it. The major issue, according to ECB's head is that underlying inflation has remained subdued as well as wage growth, insufficient to support a durable and self-sustaining convergence of inflation toward the medium-term objective.
The EUR/USD pair traded in the 1.1160/80 region all day long, with investors awaiting fresh clues, in the form of US and German preliminary May´s inflation, both scheduled to be released this Tuesday, alongside with EU latest confidence surveys. The technical picture in the short term favors a downward extension, although it will remain corrective due to ongoing dollar's weakness, unless the pair returns to territory sub-1.1000. In the 4 hours chart, technical readings present a neutral-to-bearish stance, with the price contained below a horizontal 20 SMA, and technical indicators heading marginally lower within negative territory.
Support levels: 1.1160 1.1120 1.1080
Resistance levels: 1.1220 1.1260 1.1300
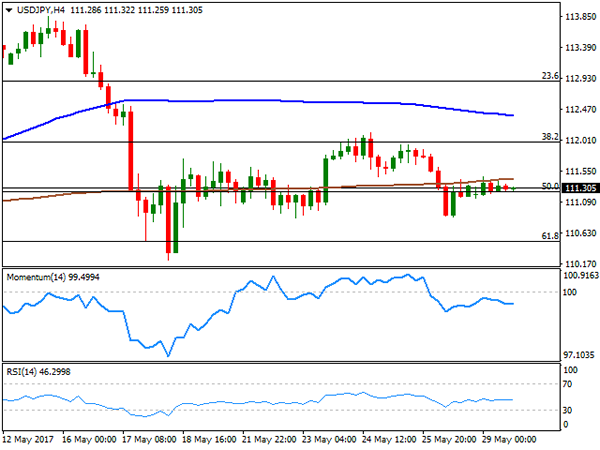
USD/JPY
The USD/JPY pair was unable to move this Monday, holding around its Friday's close of 111.33 for the past 24 hours, as multiple holidays across the world kept the most relevant markets closed. China will extend its holidays into this Tuesday, but the rest of the Asian markets will be active. Japan will release its April unemployment and retail sales data, expected to have improved modestly from March figures. Better-than-expected figures should favor additional gains in the JPY, as firmer macroeconomic data will support the beginning of the end for easing in the country. Still, and in the short term, yields will likely remain as the main motor. From a technical point of view, the pair has made little progress, comfortably consolidating around the 50% retracement of its latest bullish run and below its moving averages in the 4 hours chart, in where technical indicators head marginally lower within bearish territory, lacking momentum amid the absence of volume. A strong support comes at 110.85, with a break below it favoring a stronger slide towards the 110.00 region.
Support levels: 110.85 110.50 110.10
Resistance levels: 111.65 112.00 112.45
GBP/USD
The GBP/USD pair recovered up to 1.2850 this Monday, settling a few pips below it, amid continued dollar's weakness, despite thin trading conditions. There were no macroeconomic news coming from the UK, although PM May confirmed that Brexit negotiations will start next June 19th, urging voters to give her the support she needs in the upcoming national election. The announcement came after a survey poll led by The Independent showed that most voters want to know more about the Brexit plan before the election. Indeed, the Pound will be all about election and Brexit during the next couple of weeks, with polls leading the way, as both currencies are equally weak these days. From a technical point of view, the risk turned towards the downside after the bearish breakout of 1.2900, although there's still a critical support in the way towards 1.2500, the 1.2756 low set on April 21st, as it’s the lowest since PM May announced the election. Technical readings in the 4 hours chart confirm the negative bias, as technical indicators have barely corrected oversold conditions before losing upward strength, whilst the price keeps developing below a bearish 20 SMA, now providing resistance around 1.2880.
Support levels: 1.2790 1.2765 1.2730
Resistance levels: 1.2840 1.2885 1.2920
GOLD
Spot gold held near the three-week high set last Friday, heading into the Asian session barely below Friday's close, now around $1,266.70 a troy ounce. Political jitters and physical demand should back gold prices during the upcoming sessions, as during the weekend, North Korea issued another missile test that landed in the Sea of Japan, whilst Asian buyers will boost demand ahead of the wedding season. Also, the US will release its PCE index this Tuesday, Fed's favorite inflation measure, and higher than expected readings may cap advances on mounting speculation about a rate hike this month. Technically, the daily chart shows that the price holds well above their moving averages, whilst technical indicators have lost their upward strength, consolidating near overbought levels. In the 4 hours chart, the technical picture is neutral-to-bullish, as the price is also standing above its moving averages, with the 20 SMA heading north and providing an immediate support at 1,262.25, and technical indicators heading nowhere well above their mid-lines, reflecting the current quietness rather than suggesting upward exhaustion.
Support levels: 1,262.25 1,254.60 1,245.20
Resistance levels: 1,272.90 1,283.10 1,290.00
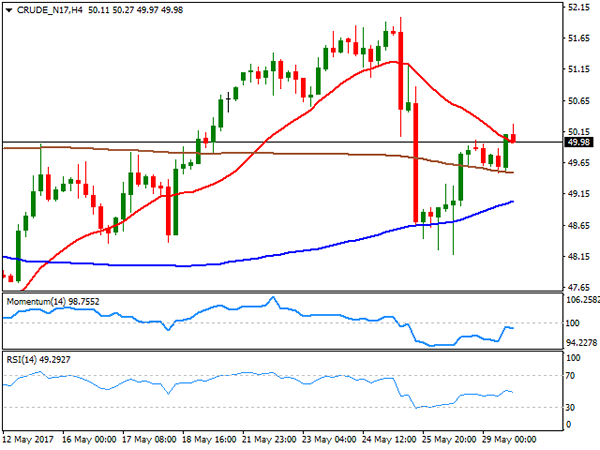
WTI CRUDE OIL
Oil prices advanced modestly this Monday, with West Texas Intermediate crude futures flirting with the 50.00 figure by the end of the day. The commodity traded as high as $50.27 a barrel with investors still cautious after a disappointing OPEC's announcement and another sign of US rising production, after the Baker Hughes report showed that the country keeps increasing drilling. Technically, the daily chart shows that the price remains below its 100 and 200 DMAs, both converging around 51.00, but above a bullish 20 DMA, whilst technical indicators hold within positive territory, although without directional strength. In the 4 hours chart, the price is now struggling around a bearish 20 SMA, whilst technical indicators have faltered around their mid-lines, now heading modestly lower within neutral territory, indicating that buying interest is still limited. An advance beyond 50.50, however, will likely indicate additional gains for this Tuesday.
Support levels: 49.40 48.70 48.10
Resistance levels: 50.50 51.20 51.85
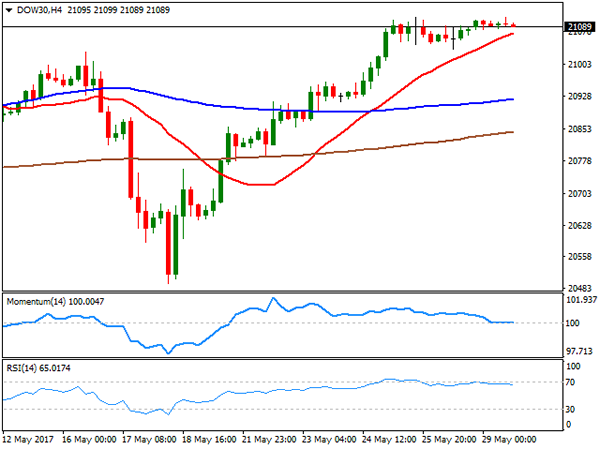
DJIA
Wall Street was closed this Monday, posting, however, a modest advance in electronic trading. The Dow Jones Industrial Average closed on Friday at 21,080.28, peaked at 21,111 this Monday, and currently stands around 21,090 ahead of the Asian opening. The index remains near record highs, albeit political jitters may take their toll over US equities this Tuesday, with the banking sector at risk, after plummeting in Italy on speculation of a call for early election, alongside with rising tensions surrounding North Korea. The technical picture for the Dow remains unchanged from previous update, generally bullish, despite indicators have turned flat within positive territory, amid the lack of volume at the beginning of the week. In the 4 hours chart, the index holds above a bullish 20 SMA, while the Momentum indicator has turned flat around its 100 level, as the RSI indicator holds near overbought readings. The mentioned 20 SMA stands at 21,075, offering an immediate support, although it will take a downward acceleration though the 21,00 figure to confirm a bearish extension for the upcoming sessions.
Support levels: 21,075 21,048 21,003
Resistance levels: 21,112 21,169 21,200
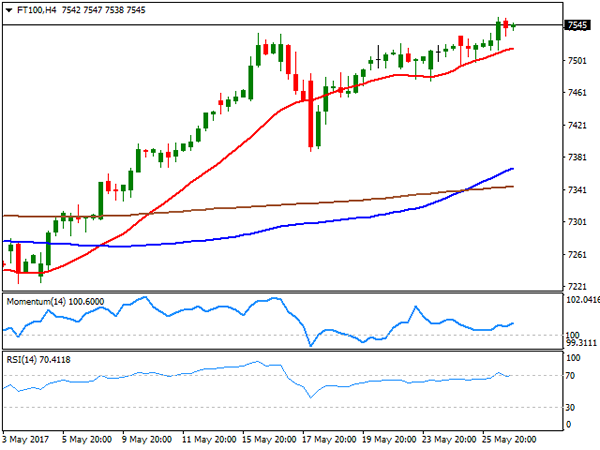
FTSE100
The London market remained closed this Monday, with the FTSE 100 latest registered close at 7,545, right below an intraday all-time high of 7,554 set on Friday. The Footsie advanced for four consecutive weeks, backed partially by latest Pound's weakness, as most of the companies listed generate revenues abroad that get pumped up on a fragile local currency. In fact, the index's latest rally can be attributed to speculation that the Pound will weaken further during the upcoming months and following the Brexit. Upcoming short term behavior, however, will depend on how Asian shares develop, particularly those related to commodities. In the meantime, the technical picture is bullish, as in the daily chart, the index remains far above all of its moving averages, whilst technical indicators are aiming back higher after a modest downward correction, holding near overbought levels. In the shorter term, the 4 hours chart the risk is also towards the upside, as the Momentum barely aims higher within neutral territory, whilst the RSI indicator corrected partially overbought readings, but pared losses around 70. In this last time frame, a bullish 20 SMA heads north below the current level, offering a dynamic support around 7,515.
Support levels: 7,515 7,490 7,455
Resistance levels: 7,554 7,590 7,620
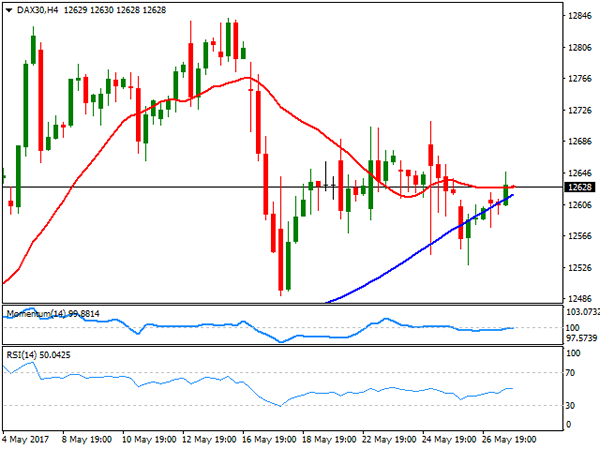
DAX
The German DAX added 26 points or 0.21% this Monday, closing at 12,628.95, in a lackluster trading day, amid holidays in the UK and the US. Most members closed up, although the banking sector came under pressure all through the region, dragged lower by Italian ones that plunged on talks over a possible early election in the country. Within the DAX, Muenchener was the best performer, up 0.97%, while Bayerische followed, ending up 0.85%. Vonovia was the worst performer shedding 0.97%, followed by Deutsche Bank that closed 0.61% lower. From a technical point of view, the index retains the neutral bias seen on previous updates, holding a few points below its 20 DMA, but far above bullish 100 and 200 SMAs, whilst technical indicators head nowhere around their mid-lines. In the shorter term, and according to the 4 hours chart, the benchmark is also neutral, with the Momentum stuck around its 100 level, the RSI hovering around its mod-line and the index converging with a horizontal 20 SMA.
Support levels: 12,591 12,542 12,490
Resistance levels: 12,631 12,675 12,729
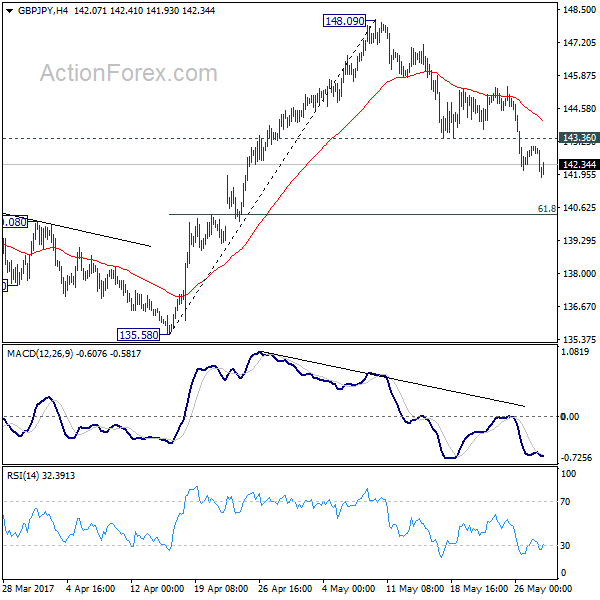
GBP/JPY Daily Outlook
Daily Pivots: (S1) 142.40; (P) 142.73; (R1) 143.16; More....
GBP/JPY's decline from 148.09 extends lower to as low as 141.82 so far and intraday bias remains on the downside. Deeper fall would be seen to 61.8% retracement of 135.58 to 148.09 at 140.35. At this point, we'd still expect rebound from 122.36 to resume later. Hence, we'd look for strong support below 140.35 to contain downside and bring rebound. On the upside, above 13.36 minor resistance will turn bias back to the upside. However, sustained trading below 140.35 will dampen our bullish view and turn focus back to 135.58 key near term support instead.
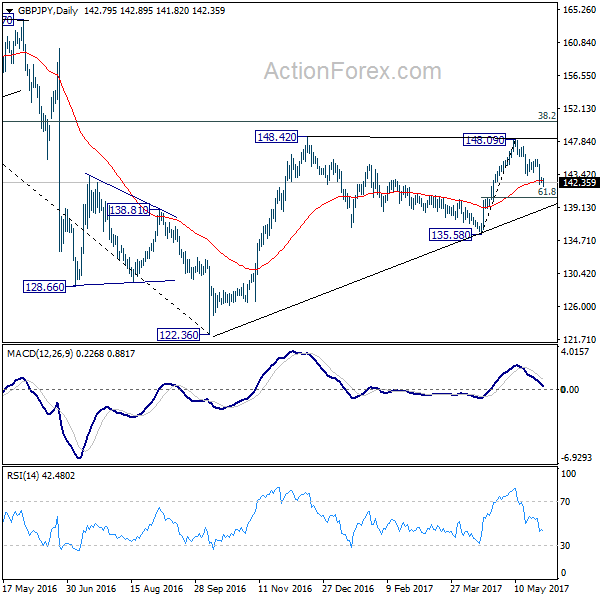
In the bigger picture, rise from 122.36 medium term bottom is still expected to extend to of 195.86 to 122.36 at 150.42. And decisive break there could pave the way to 61.8% retracement at 167.78. However, as the cross is starting to lose upside momentum, rejection below 150.42 and break of 135.58 support will indicate reversal and bring deeper fall back to retest 122.36 instead.
Risk Aversion Weighs On The Asia Session
Holidays in Greater China and Hong Kong see mixed equities moves with Yen crosses drifting lower on political uncertainty in the U.K and Europe.
With both the U.K. and the U.S. out overnight and with China, Taiwan and Hong Kong dragon boating today, the Asia session was never likely to be a fiery one. This should all start to change this afternoon as the week become very data heavy indeed around the world. Over the next 24 hours the most closely watched data should be U.S. PCE Inflation, always watched closely by the Fed, followed by China's PMIs. Soggy prints on both in recent times may see the risk-off them in Asia today continue into midweek.
With a lack of direction from New York, Asia's attentions were focussed mainly on Europe's travails. P.M May reiterated she would still enact a hard Brexit if Europe did not produce an acceptable deal. Polls continue to show that Labour is only six percent behind the Conservatives. Greece may opt out of its next debt payment ask creditors haggle over debt relief. Italian banks were under pressure as rumours continue to swirl about an early Election in September. Finally, the ECB's Draghi set a very dovish tone in comments yesterday.
This produced a risk-off environment in Asia with both EUR/USD, AUD/USD and USD/JPY falling on Cross/JPY selling. It had the usual knock on effect on the Nikkei which finishes the day slightly in the red.
FX
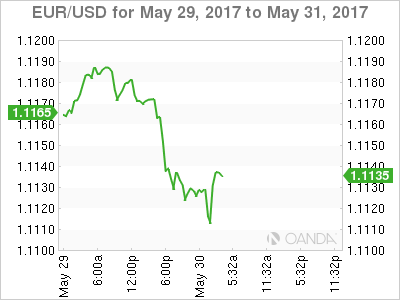
EUR/USD fell from 1.1165 to 1.1115 and starts Europe just above its lows at 1.1120. The single currency has support nearby at 1.1100, and the charts suggest a break would see more stop-loss selling appear with the next meaningful chart support around 1.1000. Overhead, resistance appears at 1.1180
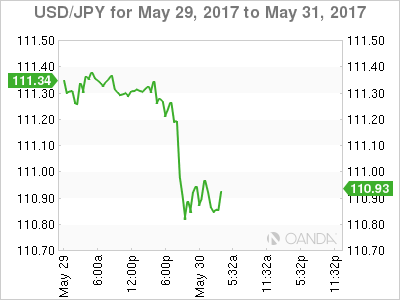
USD/JPY fell through 111.00 early in the session which appears to have triggered short term stop losses. It fell as low as the 110.80 area as investors sold AUD/JPY and EUR/JPY before stabilising around 110.97
USD/JPY has initial support at 110.80 followed by 110.50 ahead of the pivotal 110.00 area. Resistance appears at 111.45 and then 111.85.
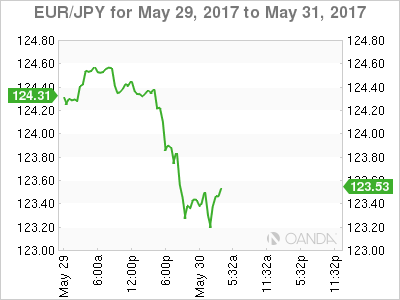
EUR/JPY fell from 124.00 to 123.25 and finishes the session just above there at 110.30 as Asian investors get cold feet on Europe and Draghi's dovishness. Initial support lies at 123.00 with a daily close possibly signalling a much deeper correction below 122.00 could be on the cards.
Resistance is at 123.55 before more important resistance at 124.25 and 124.55.
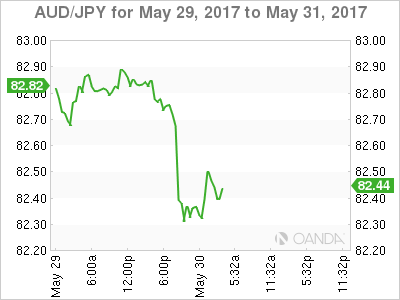
AUD/JPY suffered the same fate as ERU/JPY being a risk-off proxy. The cross dropped from 82.80 to 82.30 before recovering to 82.45. The move down is more significant however as the cross has broken long-term trendline support at 82.60 today. A close below here tonight could imply a further drop to the 81.60 area initially.
Resistance lies at 82.80 and then 82.90 followed by 83.30. Support rests at 82.15 and then 81.60.
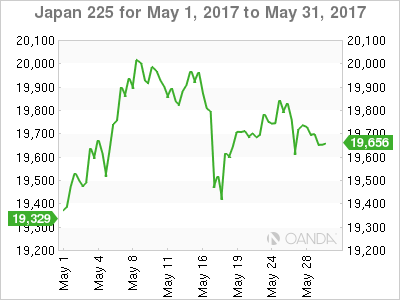
Nikkei 225
Followed USD/JPY and the crosses lower as per normal procedure. The index is delicately poised at its present level of 19,670. Resistance is now heavy above at 19800 and then 20,050.
Support lies at 19.560 before the vital 19,280 regions. This is the low of the 18th May and the 100-day moving average.
OIL
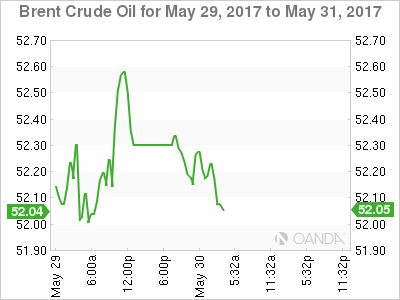
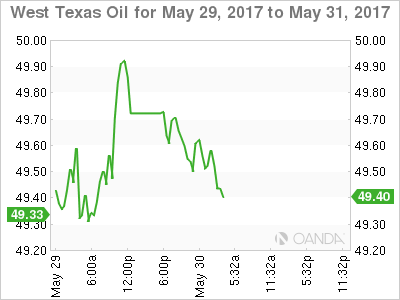
Holiday's in both the U.S and the U.K saw both Brent and WTI trade sideways through the overnight session to finish up roughly unchanged from Friday's close. WTI spot did attempt a move higher in thin trading but failed at the 50.00 level before slipping back to the 49.50 region. Brent meanwhile, contented itself to trade quietly in a 52.00/52.50 range for the most part.
With China and Hong Kong out today, we would expect much of the same for the Asia session barring any unexpected headline risk. The week should pick up going forward as we run into a series of data-heavy days around the world.
Brent spot trades at 52.30 with initial support at 51.90 and then 51.00. Initial resistance is at 52.70 followed by 53.00.
WTI spot trades at 49.65 with support at 49.20. Above, 50.00 will form an important pivot, with a move above implying the rally can extend to the 51.00 area initially.
GOLD
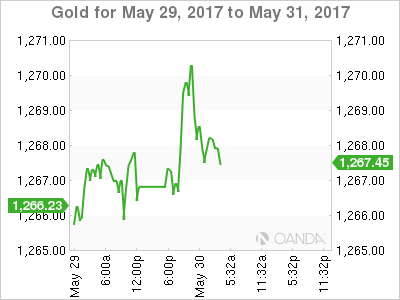
Gold opened with a bid tone in Asia and continued through the session. The bid tone should continue, although the picture will muddy somewhat as we head into a very data heavy rest of the week globally. For now, risk aversion should continue to support gold and precious metals in general.
Gold trades at 1268.50 and is attempting to force its way through the 1270 resistance level just above with 1272 very close behind that. A break of the latter would imply gold may have the legs to reach for 1280 in the coming sessions.
Support also lies nearby at 1264.50 with a break opening up a move to 1260. A close below this level could signal a deeper correction to the 1245 area may be on the cards.
Daily Technical Analysis: EURUSD, GBPUSD, USDJPY, USDCHF
EURUSD
The EURUSD was indecisive yesterday but traded lower earlier today in Asian session, slipped below the H1 EMA 200 as you can see on my H1 chart below, hit 1.1122. The bias is bearish in nearest term testing 1.1080 support area which remains a good place to buy with a tight stop loss as a clear break and daily close below that area would expose 1.0950 region. Immediate resistance is seen around 1.1160 (H1 EMA 200). A clear break and daily close above that area could trigger further bullish pressure testing 1.1200 – 1.1265 resistance area. I still prefer a bullish scenario at this phase but a clear break and daily close below 1.1080 would activate my wait and see mode.
GBPUSD
The GBPUSD attempted to push higher yesterday topped at 1.2850 but traded lower earlier today in Asian session slipped below 1.2800. The bias remains bearish in nearest term testing 1.2780 support area which remains a good place to buy with a tight stop loss as a clear break below that area would expose 1.2700 – 1.2670 or lower. Immediate resistance is seen around 1.2850. A clear break above that area could lead price to neutral zone in nearest term testing 1.2900/25 resistance area.
USDJPY
The USDJPY was indecisive yesterday but traded lower earlier today in Asian session hit 110.77. The bias is bearish in nearest term testing 110.25/00 region. A clear break and daily close below that area would expose 108.00 area this week. Immediate resistance is seen around 111.30. A clear break above that area could lead price to neutral zone in nearest term but as long as stay below the trend line resistance and 112.00 key resistance I still prefer a bearish scenario at this phase and any upside pullback should be seen as a good opportunity to sell.
USDCHF
The USDCHF had a moderate bullish momentum yesterday and hit 0.9794 earlier today in Asian session. The bias is bullish in nearest term testing 0.9815 area which is a good place to sell with a tight stop loss as a clear break above that area would give further confirmation to the double bottom bullish scenario (see my H4 chart below)with nearest target seen around 0.9900. Immediate support is seen around 0.9765. A clear break below that area could lead price to neutral zone in nearest term testing 0.9695 key support area.
Market Update – Asian Session: Japan Jobless Rate Remains At 23-Year Low But Household Spending Remains Soft
Politics
(UK) According to Times/Survation Poll, support for UK Conservatives at 43% vs 37% for Labour - US financial press
(UK) Opposition Labour Party leader Corbyn: Would be open to Scotland referendum talk with SNP if Labour party wins next month's elections - UK press
(UK) PM May reiterates prepared to walk away from Brexit talks without a deal with the EU if the agreement was not good enough – UK Press
(BR) Brazil President Temer: No parties informed him of plan to quit coalition; Still fully capable of governing
(GR) Greece may opt out of next payment without a debt deal - German Press
Key economic data
(JP) JAPAN APR RETAIL SALES M/M: +1.4% (6-month high) V -0.2%E; RETAIL TRADE Y/Y: 3.2% (2-year high) V 2.3%E
(JP) JAPAN APR OVERALL HOUSEHOLD SPENDING Y/Y: -1.4% V -0.9%E; 14th consecutive month of decline
(JP) JAPAN APR JOBLESS RATE: 2.8% V 2.8%E (matches lowest rate since Jun 1994)
(AU) AUSTRALIA APR BUILDING APPROVALS M/M: +4.4% V +3.0%E; Y/Y: -17.2% (8th consecutive decline) V -18.1%E
(NZ) NEW ZEALAND APR BUILDING PERMITS M/M: -7.6% V -1.2% PRIOR; 2nd straight decline and biggest decline in 5 months
Asia Session Notable Observations, Speakers and Press
Asian indices are mixed as thin trading persists for the 2nd day of Dragon Boat Festival day, with Shanghai, Taiwan, and Hong Kong all joining US markets for holiday break. Korea's Kospi is seeing some profit taking from recent record highs, Australia is marginally higher, while Nikkei225 is dragged down by USD/JPY retreat below 111. Modest risk-off is playing out in FX space going into key US PCE inflation data and China manufacturing PMIs this week, both of which have shown underwhelming prints over the past 2 months. EUR/USD is also under pressure, falling for the 4th straight session to 1.1120. Dovish remarks from ECB head Draghi justifying the current easy stance were compounded by escalating standoff between Greece and negotiations, as German press reported Athens may opt out of next payment without a debt deal. GBP/USD was also down slightly to fall below $1.28, with another poll showing Labour gaining on Conservatives heading into elections in just 10 days.
Economic data were also largely mixed. Japan jobless rate remains at 23-year low 2.8%, though household spending continues to falter with its 14th consecutive month of decline. Recall the latest Labor Cash earnings data out of Japan saw the biggest decline in nearly 2 years, suggesting that tight labor market is not producing wage inflation. Former BOJ member Shirai notes this is largely to the structural rigidity in Japan society. In Australia, building approvals rose m/m after a significant decline in the prior month, however economists with Westpac said the rebound is likely to be temporary, and housing investment will still enter into material decline later this year and becoming a drag on growth.
China
(CN) PBOC denies press report it told banks to deposit in dollars, in order to meet liquidity needs - financial press
(CN) Templeton's Mobius: Iron ore consumption in China likely to be sustained as infrastructure buildup continues - press
Japan
(JP) Former BOJ member Shirai: Japan has a labor shortage but labor structure is not allowing wage inflation
Australia/New Zealand
(AU) Westpac: Monthly update on Australia building approvals was more positive than expeted, but slowdown theme remains - press
(NZ) Moody's: Budget highlights fiscal flexibility and shock absorption capacity
Korea
(KR) South Korea Financial Supervisory Service (FSS): Bad debt ratio for loans by local lenders in Q1 fell 0.04pts to 1.38%, lowest since Q4 of 2012 - Korean press
(KR) South Korea conducted drills with US B-1B strategic bomber on Monday
Asian Equity Indices/Futures (00:00ET)
Nikkei -0.3%, Hang Seng closed, Shanghai Composite closed, ASX200 +0.2%, Kospi -0.5%
Equity Futures: S&P500 flat; Nasdaq flat, Dax flat, FTSE100 -0.1%
FX ranges/Commodities/Fixed Income (00:00ET)
EUR 1.1120-1.1170; JPY 110.75-111.30; AUD 0.7415-0.7445; NZD 0.7035-0.7060
June Gold flat at 1,268/oz; July Crude Oil +0.1% at $49.86/brl; July Copper -0.5% at $2.56/lb
(JP) Japan MoF sells ¥1.99T v ¥2.2T indicated in 2-yr 0.1% (prior 0.1%) JGBs; Avg yield: -0.162% v -0.193% prior; bid to cover: 5.06x v 5.51x prior
(AU) Australia MoF sells A$150M in 2.0% in 2035 bonds; bid-to-cover 2.36x
(AU) Australia Office of Financial Management (AOFM) CEO: No plan to extend bond curve beyond 30 years - press
Asia equities notable movers
Australia
Insurance Australia (IAG) +3.1%; Raised at Credit Suisse
Sandfire Resources (SFR) +1.3%; Guides FY17 production
Japan
Suzuki (7269) +0.5%; Apr production
Panasonic (6752) +0.4%; To increase output at Tesla battery plant - comments from mid-term outlook
Japan Airlines (9201) -0.5%; Cut at JPMorgan
Toshiba (6502) -0.7%; INCJ to enter into negotiations with Western Digital regarding joint bid for chip unit - Japanese Press