Sample Category Title
Can The NZD Push Higher Still?
Key Points:
- A bullish Kiwi Dollar could continue to rally in the week to come.
- The technical bias has shifted to bullish.
- The RBNZ is worth keeping an eye on.
The NZDUSD was one of the winners of last week and closed out Friday substantially higher despite many other crosses experiencing mixed degrees success. As a result, the question is now whether the pair can maintain its current momentum or if we are going to see it slip back to the downside. To delve into this question, we need to look at both what was driving the NZD's recent performance and what is likely to by in the driving seat next week.
Starting with last week's performance, the Kiwi Dollar was bullish for all but one session, a clear response to the broadly better NZ economic data and some less than buoyant US numbers. Particularly of note were the NZ trade figures which included a Trade Balance outcome of 578M – a figure more than double its forecasted result. Additionally, whilst it was somewhat underwhelming, the NZ Annual Budget threw some money around which was little surprise given the recent government surplus but it still managed to generate some positive sentiment for the NZD. The net effect of the generally solid week of fundamentals saw the pair close all the way up at 0.7061.
Moving on to what on the agenda for the week to come, there is an excellent range of economic news releases coming down the line but one stands out in particular. Namely, the RBNZ's Financial Stability report is due out Tuesday and could set the tone for the rest of the week. Importantly, given that it comes in the wake of a rather lacklustre budget which barely tackles the housing crisis in NZ, we could see the bank taking a less optimistic tone than is usual. Furthermore, the worsening situation in the Australian and Canadian housing markets is, no doubt, heightening the RBNZ's concerns that the nation's asset bubble could be in danger of bursting.
Looking to the technical readings, last week's strong performance has, for the most part, pushed the pair's readings into bullish territory. Notably, the NZDUSD is now not only sitting comfortably above its 100 day EMA but the 12 and 20 day averages are also in a bullish configuration. What's more, we have a highly bullish parabolic SAR reading which would typically suggest that the uptrend will remain in place. The only major factor that would militate against further gains would be the stochastic oscillator which is overbought.
Ultimately, we have a fairly optimistic view for the week to come but this is somewhat tempered by expectations of a tonal shift from the RBNZ. However, the shift in the technical bias could definitely counteract some of the effect of a particularly grim release from the RBNZ which is worth considering. As a result, it may be wise to wait on the central bank's announcement before attempting to form a bias – irrespective of how well the pair has performed in the lead up.
Market Morning Briefing: Volatility May Be Very Low Today
STOCKS
Dow (21080.28, -0.01%) is almost stable near previous levels and could head towards resistance near 21170 as mentioned last week. The index could trade within the 21170-21000 region for at least the next couple of sessions before any sharp directional move is seen.
Dax (12602.18, -0.15%) is now in a pause mode and is trying to attempt some lower levels. Overall 12400 continues to remain the downside limit for the near term while 12800-12850 is an important near term resistance which could hold for sometime. View remains sideways to bearish for the near term.
Shanghai (3110.06, +0.07%) has scope on the upside and could move up in the medium term. While support near 3000-3020 holds, medium to long term looks bullish.
Nikkei (19713.21, +0.13%) is trading higher today. Immediate support seen near 19600-19400 which could keep the index higher in the coming sessions. A period os sideways consolidation is possible for the near term.
Nifty (9595.10, +0.90%) saw a sharp rally as expected. We may look for levels near 9700-9800 in the medium term.
COMMODITIES
Today U.S market will remain close due to Memorial Day thus we may witness less volatility in the commodities section. We are doubtful about the sustainability of Gold (1266) beyond 1275 levels. If Gold could not hold its ground beyond these levels, it could fall towards its crucial support of 1249, which could be a level where the price action has to be checked to assess the chances of further fall to 1230 regions. A failure to hold 1249 could keep the price range-bound in the 1220-1250 regions for a short term time period.
Similar kind of trading pattern has been seen in Silver (17.35) also. The recent trading range could be 17.02-17.75 and a close below 17 levels could open up 16.50 levels as well.
Copper (2.53) has found resistance at 2.62 levels and trading within the narrow range of 2.45-2.55 levels. Only above 2.62, higher resistances of 2.67-72 can come into consideration. In the medium term 2.44 are going to be a strong support now but a close below that could open up 2.40-35 levels as well.
Brent (52.12) and WTI (49.76) are holding their respective supports of 51.20 and 49.50 but the same is not implying strength. We will be assured of strength only when a firm and sustainable closing above 54.60 and 53 are made by both Brent and WTI respectively. A daily close below the respective supports could open up 49.50 levels for Brent and 48 for WTI as well.
FOREX
Volatility may be very low today due to the markets closed in US, UK and China today. It remains to be seen if the ECB president Draghi’s speech in European Parliament today can trigger any significant moves in Euro.
Euro (1.1165) remains in the normal corrective mode. While the major support 1.1100-1.1075 is expected to trigger a turnaround to the upside, if the interim support zone of 1.1150-40 holds, then the recovery may come sooner and in a sharper manner.
A recovery in Euro in the next couple of days may weaken Dollar Index (97.48) again which is trading above our resistance of 97.45 but the strength is suspect so far. If it fails to sustain above 947.45-55 in a firm manner, then a reversal towards 97.00 can be seen once again.
Dollar Yen (111.37) has been consolidating sideways in line with expectations in the narrow range of 110.80-112.00. As discussed last week, while above important support at 110, there is scope for an upmove towards 114.0-114.5 in the medium term. Keep an eye on the immediate support of 110.80 which if holds, can push the price up sharply in the next few sessions. EURJPY (124.33) needs to hold above the support of 124.00 to aid Euro and weaken Yen.
Pound (1.2814) is feeling the UK election jitters as the June 8 vote nears. A sharp crash came in the last session as the gap between the conservative party and the opposition Labour party shrank to 5 points only from the 24 points seen early in the month. The bulls need the major support 1.2750-00 to hold but it will need the Conservative party lead to widen again. The polls can keep the currency volatile till June 8.
Aussie (0.7443) has weakened as expected and may trade sideways for 2-3 sessions in the range of 0.74-0.75.
Dollar Rupee (64.44) may remain in a consolidative mode. Further strength in Nifty could take Rupee towards 64.00 else a bounce back towards 64.70 is expected.
INTEREST RATES
The Japanese yields are moving lower and could test support below current levels. If the supports hold, the yields may bounce back to higher levels in the coming sessions. Medium term looks bullish.
The UK yields are also trading low and could move down further in the near term. Thereafter the yields may go into a sideways mode for a few sessions before bouncing back to higher levels.
The German-US 2Yr (-2.02%) and the German-US 10Yr (-1.91%) are coming off from the medium term resistances and while that holds, the yield spreads could come down further possibly pulling down Euro also to lower levels. In that case, further upside for Euro could be limited just now.
The US yields are trading sideways and could remain stable near current levels for sometime. On a medium term, there could be some rise from current levels.
EURUSD – Closes Lower On Rejection Candle
EURUSD - With the pair failing to hold on to its past week gains to close on a rejection candle the past week, it now faces pullback threats. Resistance comes in at 1.1250 level with a cut through here opening the door for more upside towards the 1.1300 level. Further up, resistance lies at the 1.1350 level where a break will expose the 1.1400 level. Conversely, support lies at the 1.1150 level where a violation will aim at the 1.1100 level. A break of here will aim at the 1.1050 level. All in all, EURUSD faces further bear pressure.
GOLD – Risk Remains Higher On More Strength
GOLD - The commodity continues to hold on to its upside pressure short term. On the downside, support comes in at the 1,260.00 level where a break will turn attention to the 1,250.00 level. Further down, a cut through here will open the door for a move lower towards the 1,240.00 level. Below here if seen could trigger further downside pressure targeting the 1,230.00 level. Conversely, resistance resides at the 1,270.00 level where a break will aim at the 1,280.00 level. A turn above there will expose the 1,290.00 level. Further out, resistance stands at the 1,300.00 level. All in all, GOLD looks to weaken further.
Holiday Markets
Holiday Markets
Not much to be gleaned from Friday's pre-long weekend activity.The markets were reticent as traders were in snooze mode by weeks end.
As we turn the page in the month of May, the US dollar battleground amongst various competing market narratives rages on. And with recent Fed speak as much ado about the balance sheet as it is about the rate hike path, now enters another level of confusion to dissect.
US equities continued powering higher last week as concerns about the capacity for the Trump administration to pass through pro-growth agenda subsides.But given the levels of political noise likely to emanate from Washington on Trump's return, investor bravado could turn on a dime. Dealers will be on the lookout for any Comey/Russia developments
The Euro
There was a minor dent in the Euro armour heading into week's end on suspected positions squaring.However . Coeure's dovish stance, lessening a chance of an ECB December hike along with the Feds ratcheting up the tapering rhetoric has dealers thinking that we have not seen the maximum rate differential just yet, which is likely weighing on Euro sentiment. But EU inflow remains buoyant, and from a flow perspective, this should be respected. In the meantime, with the ECB June meeting approaching and the market building higher expectation for an ECB policy move, both ECB and FED speeches will be monitored more intently.
On the EU front, a big inflation print Wednesday could swing Euro views leading up to the June 8 ECB meeting. And the always important NFP will shape dollar sentiment leading up to the Jun 14 FOMC meeting.The battleground will likely get more intense in the weeks ahead
The British Pound
The pound was a G-10 worst performer as election polls are pointing to a narrower-than-expected win for Prime Minister Theresa May in June.Whatever thoughts the market once had about a “ soft “ Brexit are now shaping up to be an unrealistic political pipe dream. Not only are negotiators dealing with an extremely contentious divorce bill, but the uptick in UK political uncertainty could send the pound toppling lower.There's a growing sense of unpredictability in the markets, and If I didn't have the GBP symbol on my Sterling chart, I would have trouble differentiating the gaps, blips and madcap price action from an EM currency
The Chinese Yuan
CNH markets are back in focus after suspected intervention amidst stronger CNY fixings. Additionally Tom Next ratcheted higher to 88 pips on Friday as the fear of another market squeeze had dealers aggressively paying the forward curve. While month end financing pressure is expected, this surge in funding is well beyond the norm so that traders will be monitoring the short-term interest rates markets this week for additional clarity.These tight conditions make it extremely prohibitive to carry short CNH position and within the Pboc arsenal to kerb speculative activities.
Lots of confusion with China's plan to add a ‘counter-cyclical factor' in their CNY fixing formula. I'm in the two steps back camp as far as moving towards free float, as this “get out of jail” card could and will likely be used to iron out intraday market pressure points. The policy shift could be another hit to the Pboc credibility who continue to struggle to get their house in order
Australian Dollar
The China growth narrative or lack thereof is gradually coming into focus as concerns about an adverse economic shock from China are building which should present a clear problem to commodity exporters like Australia. I expect industrial metals to remain dark as talk of a China slowdown fans.
With the AUDUSD carry trade shaved paper thin to nonexistent in short dates, it all about the commodity plays these days and with the markets growing increasingly concerned about demand for Iron Ore the Aussie could continue to struggle more so if both the Fed and ECB point to a more hawkish shift in forwarding guidance. Notwithstanding the odds for a rate cut by the RBA are now increasing oh so slightly.
EUR/USD Weekly Outlook
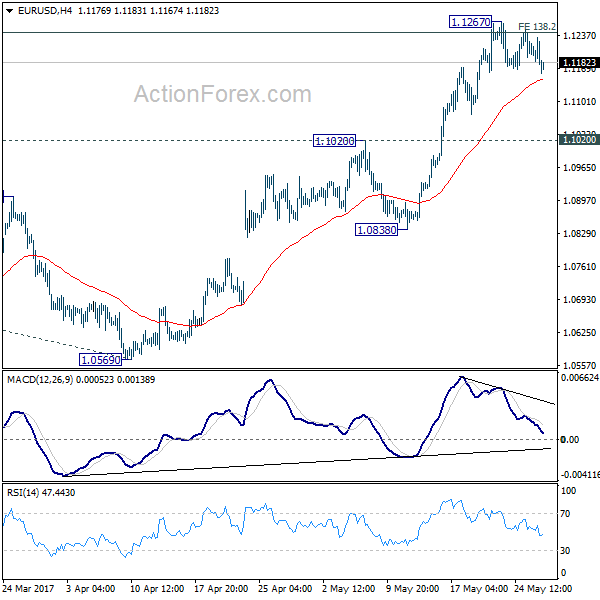
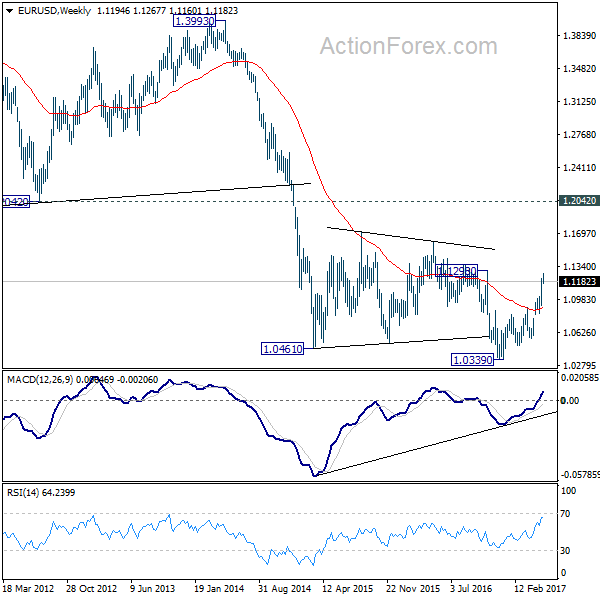
EUR/USD edged higher to 1.1267 last week but lost momentum after breaching 138.2% projection of 1.0339 to 1.0828 from 1.0569 at 1.1245. That was also close to 1.1298 key resistance. Initial bias remains neutral this week for consolidations first. At this point, remain cautious on strong resistance from 1.1245/98 to limit upside and bring reversal. But another rise will be in favor as long as 1.1020 resistance turned support holds. Decisive break of 1.1298 will carry larger bullish implication and target 1.1615 resistance next. On the downside, though, break of 1.1020 resistance turned support will indicate rejection from 1.1245/98 and turn bias to the downside for 1.0838 support first.
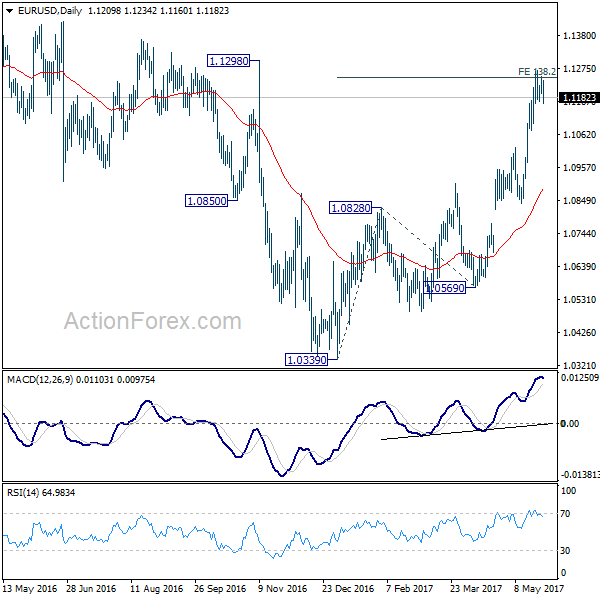
In the bigger picture, the case for medium term reversal continues to build up with EUR/USD staying far above 55 week EMA (now at 1.0888). Also, bullish convergence condition is seen in weekly MACD. Focus will now be on 1.1298 key resistance. Rejection from there will maintain medium term bearishness and would extend the whole down trend from 1.6039 (2008 high). However, firm break of 1.1298 will indicate reversal. In such case, further rally would be seen back to 1.2042 support turned resistance next.
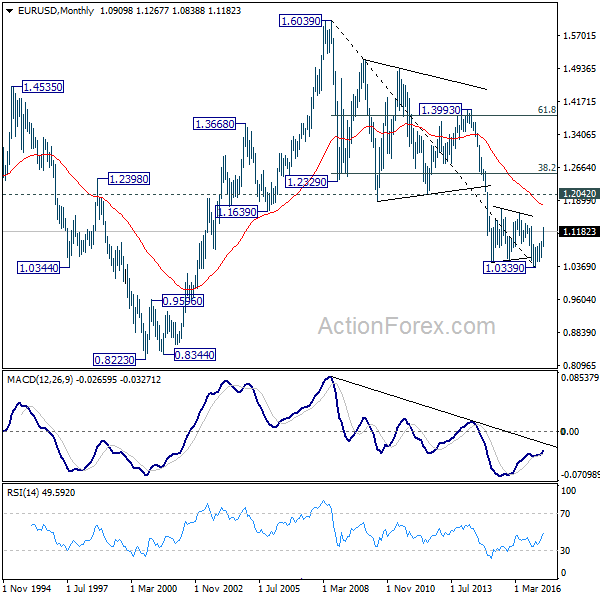
In the long term picture, the case for completion of down trend from 1.6039 (2008 high), and long term bottoming at 1.0339, is starting to build up. Decisive break of 1.1298 will bring rise back to 1.2042 as first resistance. And in that case, we should at least see rally back to 38.2% retracement of 1.6039 to 1.0339 at 1.2516.
USD/JPY Weekly Outlook
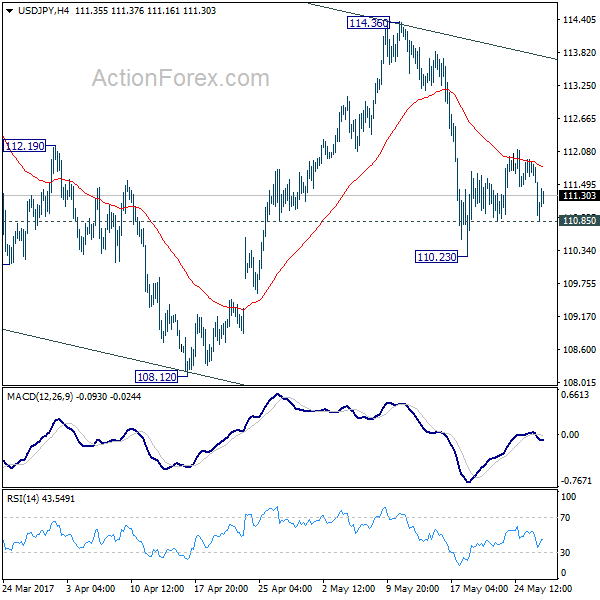
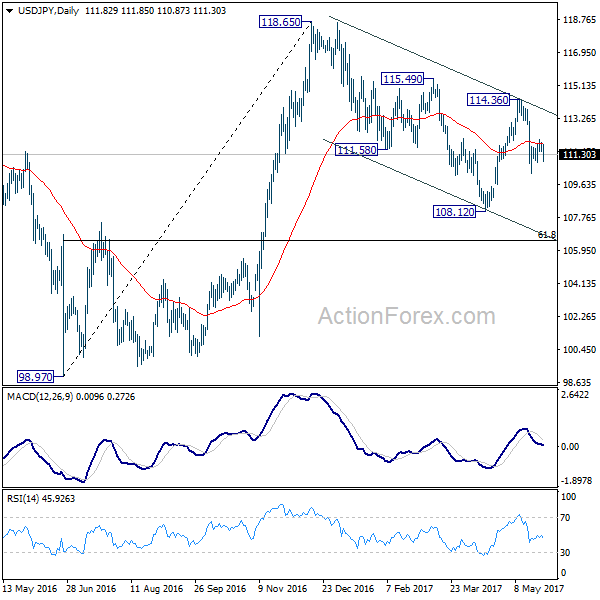
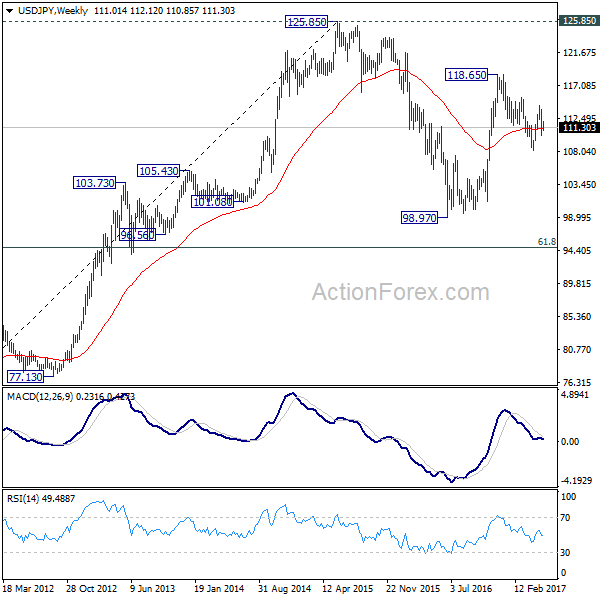
USD/JPY stayed in consolidation from 110.23 last week and outlook is unchanged. Initial bias remains neutral this week first. On the downside, below 110.85 minor support will turn bias to the downside to extend the fall from 114.36 to 108.12 low. Break there will resume the whole decline from 118.65. In that case, we'll look for bottoming signal again at 61.8% retracement of 98.97 to 118.65 at 106.48.
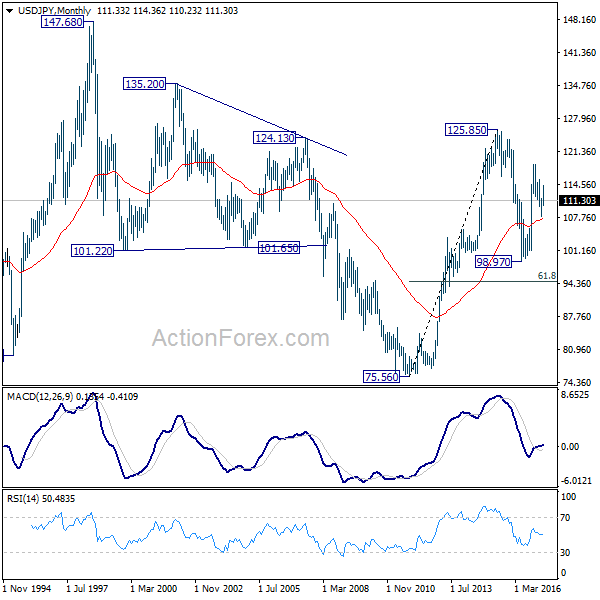
In the bigger picture, price actions from 125.85 high are seen as a corrective pattern. It's uncertain whether it's completed yet. But in case of another fall, downside should be contained by 61.8% retracement of 75.56 to 125.85 at 94.77 to bring rebound. Overall, rise from 75.56 is still expected to resume later after the correction from 125.85 completes.
In the long term picture, the rise from 75.56 long term bottom to 125.85 medium term top is viewed as an impulsive move. Price actions from 125.85 are seen as a corrective move which could still extend. But, up trend from 75.56 is expected to resume at a later stage for above 135.20/147.68 resistance zone.
GBP/USD Weekly Outlook
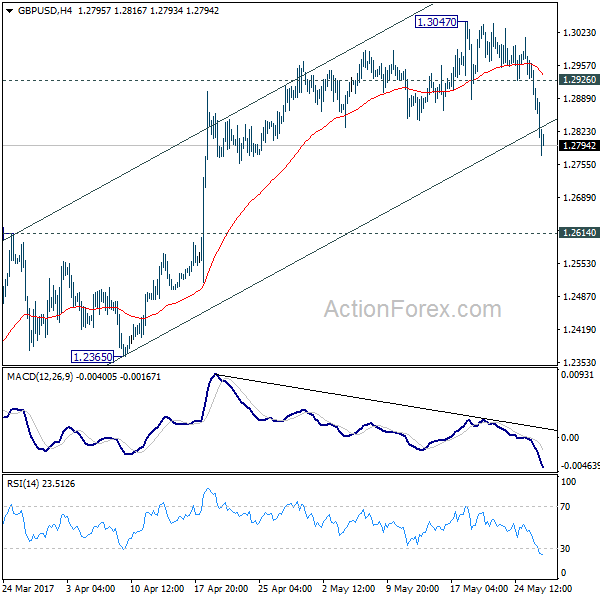
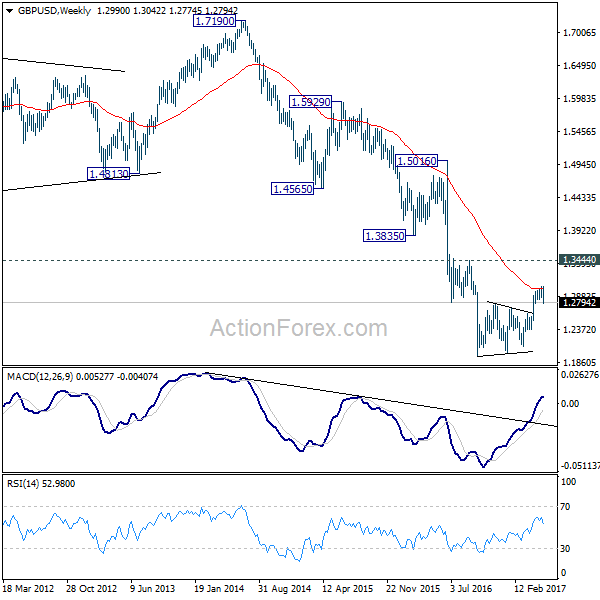
GBP/USD's sharp fall last week indicates short term topping at 1.0347 on bearish divergence condition in 4 hour MACD. Break of the near term channel also suggests completion of rise from 1.2108. Initial bias remains on the downside this week for 1.2614 resistance turned support first. Break there should also indicate completion of whole consolidation pattern from 1.1946 and target a retest on this low. Meanwhile, above 1.2926 minor resistance will turn focus back to 1.3047 high instead.
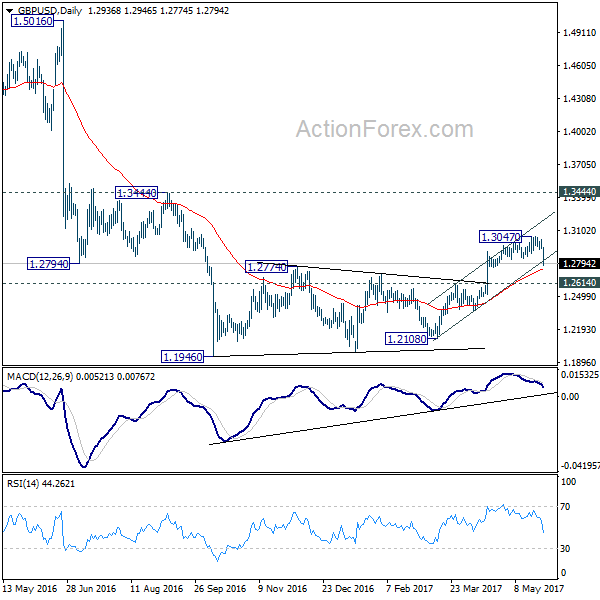
In the bigger picture, fall from 1.7190 is seen as part of the down trend from 2.1161. The rejection from 55 week EMA is maintaining bearishness in the pair. Also, at this point, as long as 1.3444 resistance holds, fall from 1.7190 is still expected to continue. Break of above mentioned 1.2614 support will affirm this bearish case.
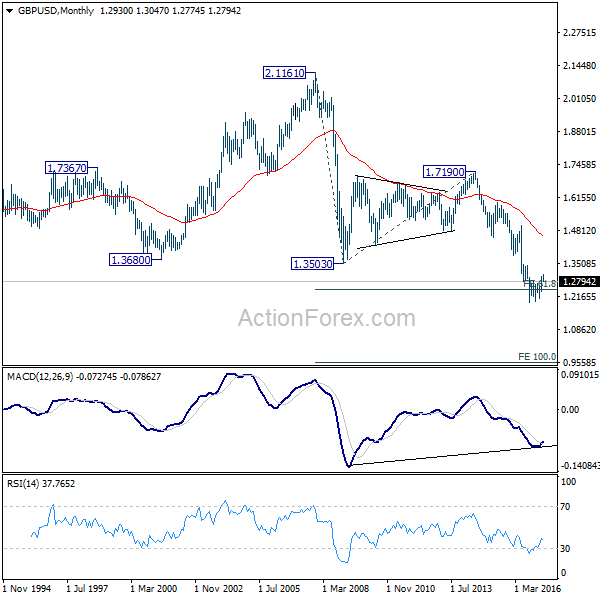
In the longer term picture, no change in the view that down trend from 2.1161 is still in progress. On resumption, such decline would extend deeper to 100% projection of 2.1161 to 1.3503 from 1.7190 at 0.9532.
USD/CHF Weekly Outlook
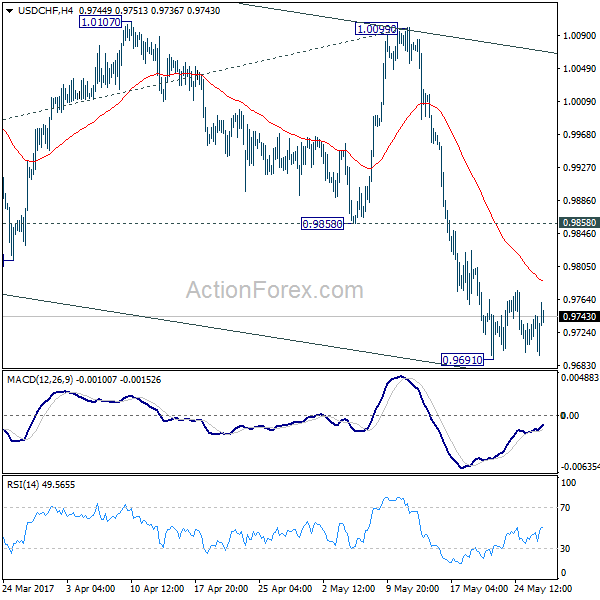
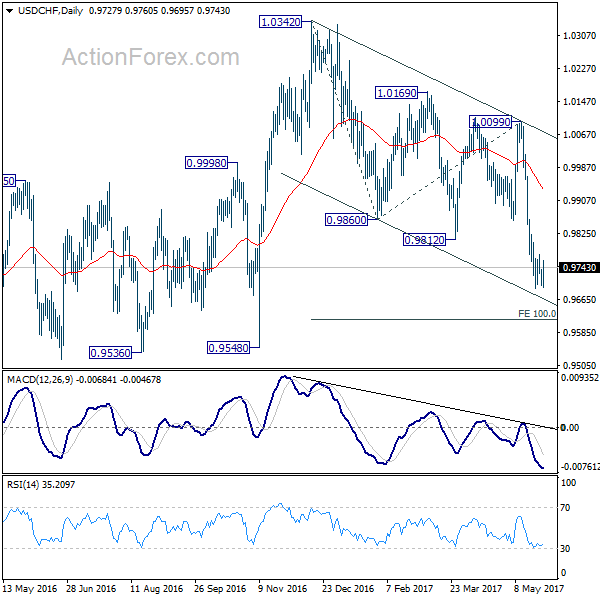
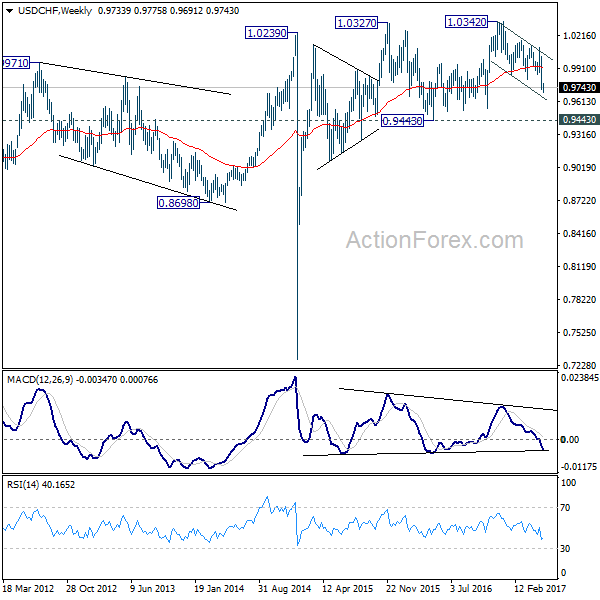
USD/CHF edged lower to 0.9691 last week but turned sideway since then. Initial bias remains neutral this week first. Consolidation from 0.9691 could extend and stronger recovery cannot be ruled out. But upside should be limited by 0.9858 support turned resistance and bring fall resumption. Whole decline from 1.0342 is still in progress and below 0.9691 will target 100% projection of 1.0342 to 0.9860 from 1.0099 at 0.9617. We'll start to look for reversal signal below there.
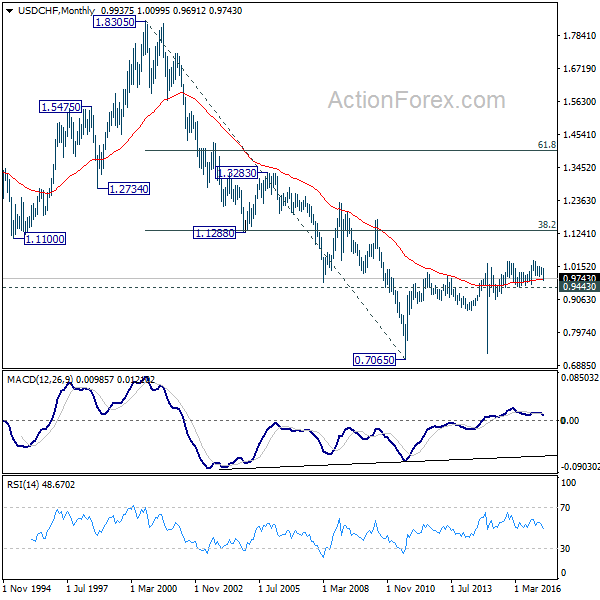
In the bigger picture, USD/CHF is bounded in medium term range of 0.9443/1.0342 for the moment. Consolidative trading would likely continue and medium term outlook remains neutral. Break of 1.0342 key resistance is needed to confirm underlying bullish momentum in the pair. Meanwhile, downside attempts should be contained by 0.9443 key support level.
AUD/USD Weekly Outlook
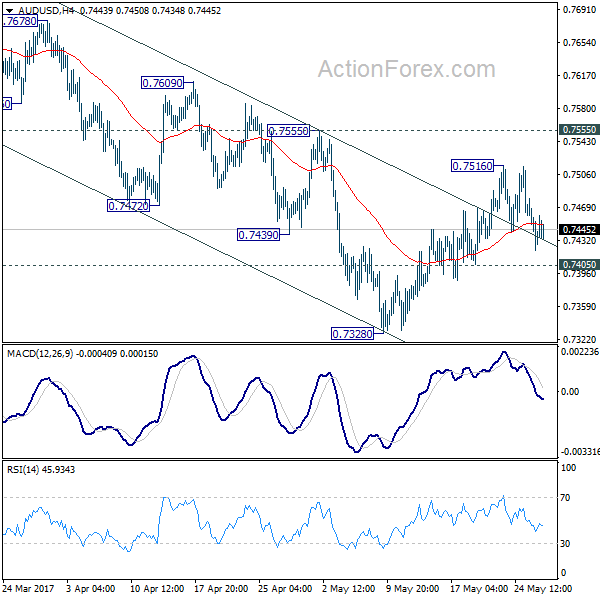
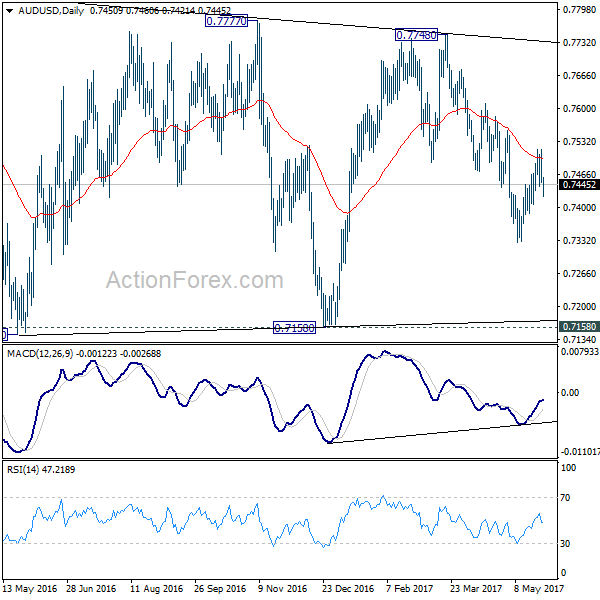
AUD/USD rose to 0.7516 last week but failed to sustain above 55 day EMA and retreated. At this point, it's staying above 0.7405 minor support. Thus, there is no confirmation of completion of rebound from 0.7328 yet. Initial bias remains neutral this week first. Overall, as long as 0.7555 resistance holds, fall from 0.7748 is still expected to continue. Below 0.7405 minor support will turn bias to the downside for 0.7382. Break there will target 0.7144/7158 support zone. However, firm break of 0.7555 will argue that fall from 0.7748 is completed and turn bias back to the upside.
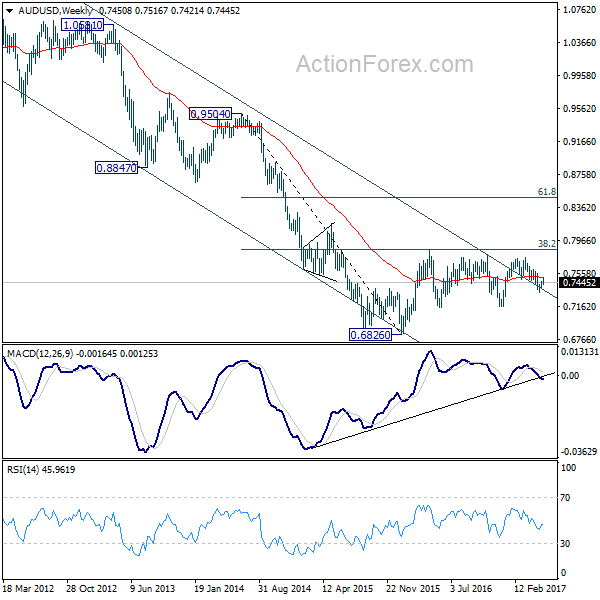
In the bigger picture, we're still treating price actions from 0.6826 low as a corrective pattern. And, as long as 38.2% retracement of 0.9504 to 0.6826 at 0.7849 holds, long term down trend from 1.1079 is expected to resume sooner or later. Break of 0.6826 low will target 0.6008 key support level. However, firm break of 0.7849 will indicate that rise from 0.6826 is developing into a medium term rebound, rather than a sideway pattern. In such case, stronger rise should be seen to 55 month EMA (now at 0.8115) and above.
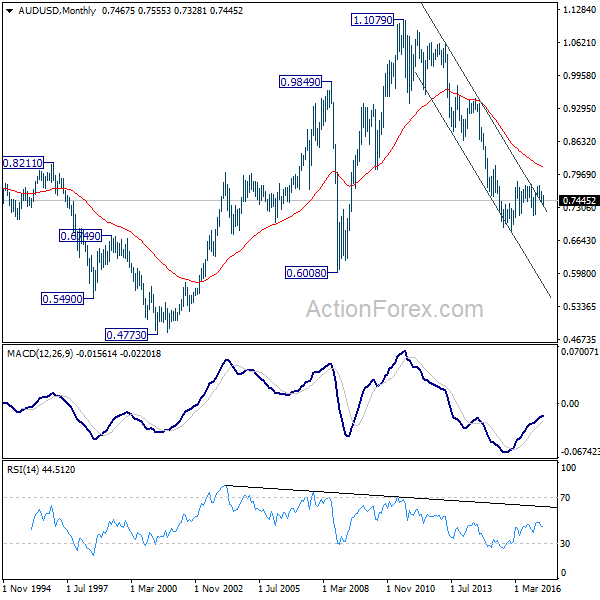
In the longer term picture, while the down trend from 1.1079 might extend lower, we're not anticipating a break of 0.6008 (2008 low) yet. We'll look for bottoming above there to reverse the medium term trend.