Sample Category Title
Trade Idea Wrap-up: USD/CHF – Hold long entered at 0.9700
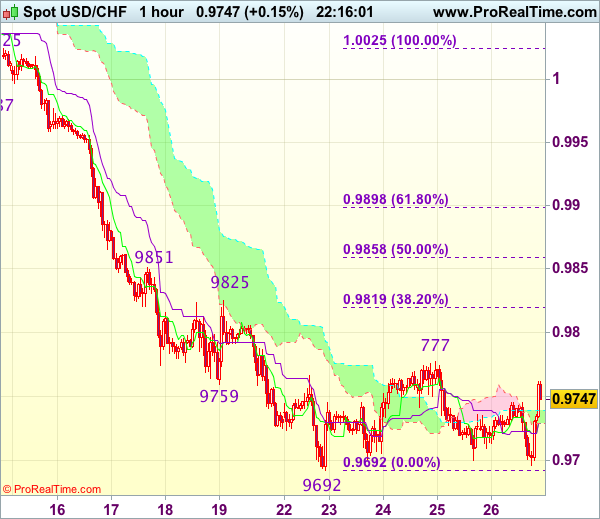
USD/CHF - 0.9743
Most recent candlesticks pattern : N/A
Trend : Near term down
Tenkan-Sen level : 0.9729
Kijun-Sen level : 0.9729
Ichimoku cloud top : 0.9739
Ichimoku cloud bottom : 0.9728
Original strategy :
Bought at 0.9700, Target: 0.9800, Stop: 0.9700
Position : - Long at 0.9700
Target : - 0.9800
Stop : - 0.9700
New strategy :
Hold long entered at 0.9700, Target: 0.9800, Stop: 0.9700
Position : - Long at 0.9700
Target : - 0.9800
Stop : - 0.9700
The greenback met resistance at 0.9777 and has retreated, suggesting caution on our long position entered at 0.9700 but as long as support at 0.9692 holds, further consolidation would be seen with mild upside bias for another rebound, above said resistance at 0.9777 would add credence to our view that temporary low is formed, bring retracement of recent decline to 0.9800, then 0.9819-25 (38.2% Fibonacci retracement of 1.0025-0.9692 and previous resistance) but price should falter below resistance at 0.9851 (also just below 50% Fibonacci retracement at 0.9858), bring another decline later.
In view of this, we are holding on to our long position entered at 0.9700. Below said support at 0.9692 would signal recent decline has resumed and extend weakness to 0.9670-75 but reckon downside would be limited to 0.9650 and 0.9620-25 should hold, bring another rebound later.
Trade Idea Wrap-up: GBP/USD – Sell at 1.2910
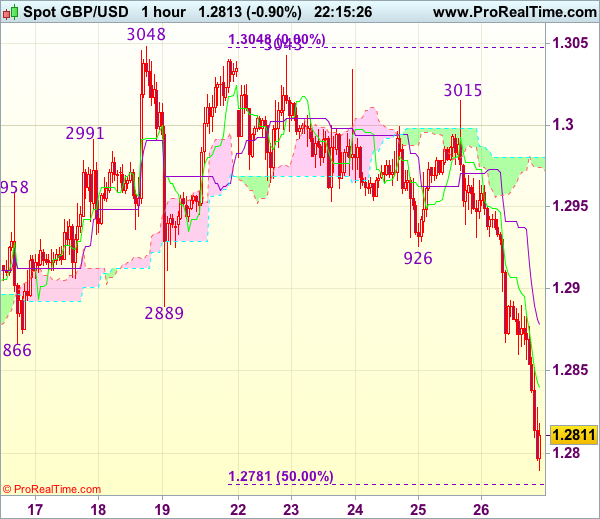
GBP/USD - 1.2820
Most recent candlesticks pattern : N/A
Trend : Near term up
Tenkan-Sen level : 1.2840
Kijun-Sen level : 1.2879
Ichimoku cloud top : 1.2980
Ichimoku cloud bottom : 1.2974
Original strategy :
Sell at 1.2910, Target: 1.2810, Stop: 1.2945
Position : -
Target : -
Stop : -
New strategy :
Sell at 1.2910, Target: 1.2810, Stop: 1.2945
Position : -
Target : -
Stop : -
Sterling ran into heavy selling pressure at 1.3015 yesterday and has dropped sharply, price just broke below 1.2866 support earlier today, suggesting top has indeed been formed at 1.3048 earlier and downside bias is seen for this the erratic decline from there to extend weakness to 1.2780-85 (50% Fibonacci retracement of 1.2515-1.3048), however, near term oversold condition should prevent sharp fall below previous support at 1.2757 today, bring rebound later.
In view of this, would not chase this fall here and would be prudent to sell cable on recovery as previous support at 1.2926 should turn into resistance and cap upside. Above this level would defer and suggest an intra-day low is formed instead, bring a stronger rebound to 1.2950 but upside should be limited to 1.2990-00.
Durable Goods Cast Shadow on Q2 Business Spending
A four-month run of increasing durable goods orders ended with a smaller-than-expected decline in April. Softening core capital goods orders and shipments raise doubts about second quarter business spending.
Orders, Shipments and the Pirate's Code
New orders for manufactured goods had increased for four consecutive months heading into today's report. After such a hot streak, the consensus expectation was braced for 1.5 percent "payback" decline.
In the actual event, orders only fell 0.7 percent and the prior month's gain was revised from a modest 0.9 percent increase to 2.3 percent. To sum up, durable goods orders have been running hot for four months and today's giveback was smaller than expected.
As a general rule, orders tend to lead shipments. So, it becomes difficult to square this series of monthly gains in orders with the fact that shipments of durable goods fell another 0.3 percent in April, marking the third decline in shipments out of the past four months. To paraphrase Captain Barbossa, sometimes the relationship between orders and shipments is more of a guideline than a rule.
Fading Boost from Equipment Spending
In a separate release this morning, estimates for first quarter GDP growth were revised to show the overall growth rate was 1.2 percent, up from the initial estimate of just 0.7 percent. Equipment spending had been a drag on growth for three out of four quarters in 2016, but has increased in each of the past two quarters, albeit at a somewhat slower rate than first reported. The pace of equipment spending growth in Q1 was 7.2 percent, a pace that slackened from the initial estimate of 9.1 percent.
Today's durable goods report gives us some clues as to how equipment spending is shaping up in the current quarter. Shipments of nondefense capital goods orders, ex-aircraft, or core capital goods, slipped 0.1 percent in April and the initially reported gain for March was slashed to a scant gain of just 0.2 percent.
Objects in the Rearview Mirror Are Smaller than They Appear
The March factory orders report showed a 0.5 percent increase in core capital goods orders, but today's report revised away that gain. Core capital goods orders have now flat-lined for two months in a row. This is the most worrying dynamic in today's report. This hard data suggest that the longoverdue rebound in the factory sector is delayed yet again.
Nonresidential business fixed investment spending added 1.3 percentage points to the overall GDP growth rate in Q1. That was the biggest boost to headline growth from this category in five years. A gradual firming in equipment spending is still our base-case forecast. However, the recent softening in both core capital goods orders as well as shipments raises doubts about the ability of this category to lend the same kind of support to GDP growth in the second quarter.
Trade Idea Wrap-up: EUR/USD – Stand aside
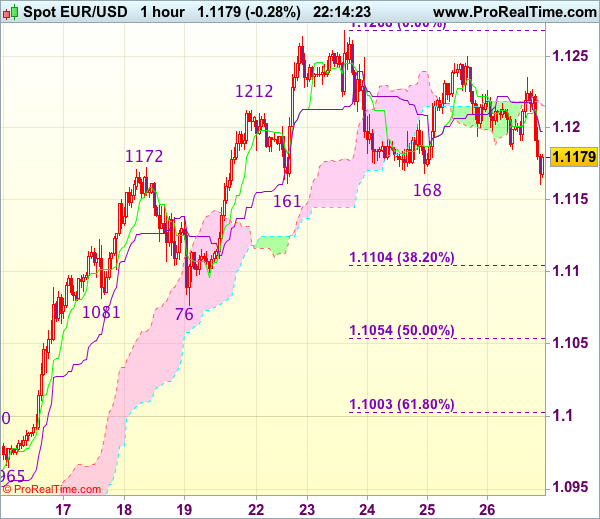
EUR/USD - 1.1181
Most recent candlesticks pattern : N/A
Trend : Up
Tenkan-Sen level : 1.1198
Kijun-Sen level : 1.1198
Ichimoku cloud top : 1.1216
Ichimoku cloud bottom : 1.1216
New strategy :
Stand aside
Position : -
Target : -
Stop : -
As the single currency met renewed selling interest at 1.1235 and has fallen again, retaining our view that further consolidation below this week’s high of 1.1268 would be seen and mild downside is seen for correction to 1.1130 but reckon downside would be limited to 1.1100-05 (38.2% Fibonacci retracement of 1.0839-1.1268) and price should stay well above support at 1.1076, bring rebound later.
On the upside, expect recovery to be limited to 1.1215-20 and said resistance at 1.1235 should hold, bring further consolidation. A firm break of 1.1235 would signal the pullback from 1.1268 has ended, bring test of 1.1250, break there would confirm upmove has resumed for retest of 1.1268, then 1.1280-85 (61.8% projection of 1.0839-1.1172 measuring from 1.1076) and possibly towards 1.1300-10.
Trade Idea Wrap-up: USD/JPY – Stand aside
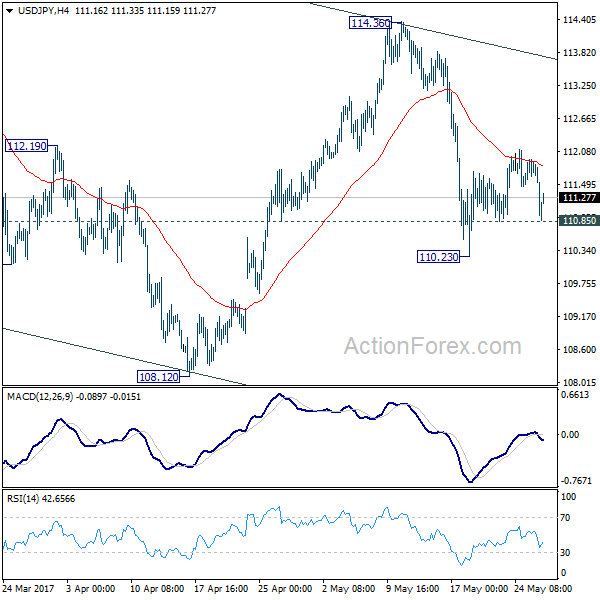
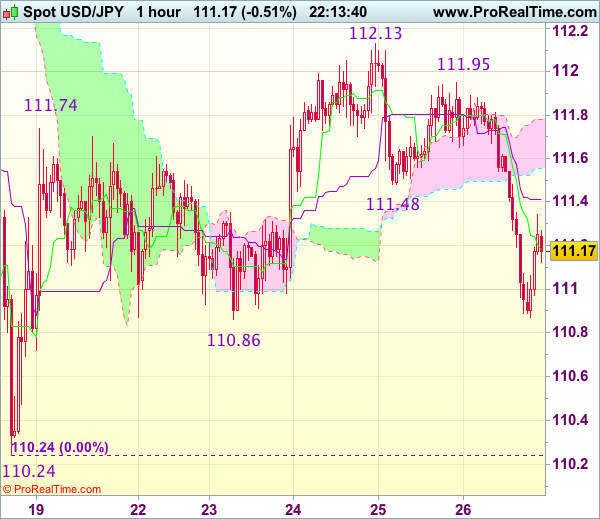
USD/JPY - 111.15
Most recent candlesticks pattern : N/A
Trend : Near term down
Tenkan-Sen level : 111.18
Kijun-Sen level : 111.41
Ichimoku cloud top : 111.78
Ichimoku cloud bottom : 111.56
New strategy :
Stand aside
Position : -
Target : -
Stop : -
Dollar’s selloff after meeting renewed selling interest at 111.95 (yesterday’s high) suggests top has been formed at 112.13 and bearishness remains for test of 110.86 support, however, a sustained breach below this level is needed to signal the rebound from 110.24 has ended at 112.13, bring further fall to 110.50-55, then retest of 110.24 probably next week.
In view of this, would not chase this fall here and would be prudent to stand aside in the meantime. Above the Kijun-Sen (now at 111.41) would bring test of previous support at 111.48 but reckon upside would be limited to 111.75-80 and said resistance at 111.95 should remain intact.
Pound Slips on British Election Polls, Strong US GDP
Its been a rough outing for the British pound, as GBP/USD has dropped 1.0 percent in the Friday session. In North American trade, the pair is trading just above the 1.28 line. On the release front, US Preliminary GDP for the first quarter posted a strong gain of 1.2%, beating the estimate of 0.9%. This was a strong improvement over the Advance GDP release in April, which showed a gain of 0.7%. However, the news was not as positive from the manufacturing sector, as Core Durable Goods Orders disappointed with a decline of 0.4%, compared to a forecast of +0.4%. Later in the day, we'll get a look at the UoM Consumer Sentiment report. The markets will also be monitoring the G-7 summit in Sicily, with the war against terror high on the agenda after the Manchester bombing earlier this week.
The Manchester bombing has sent shock waves across Britain, and the pound has dropped about 1 percent on Friday. The currency reacted negatively to a new opinion poll which showed Prime Minister May's lead over the opposition had narrowed by 5 points. With the entire country on the highest terror alert, the election race could continue to tighten and put pressure on the pound. Currently, GBP/USD is at its lowest level since April 25. On Thursday, British Second Estimate GDP was revised to 0.2%, down from 0.3% back in April. Although the dip was certainly not dramatic, it was well short of GDP in Q4, which posted a respectable gain of 0.7%. The soft reading comes at a time when other key indicators are missing their estimates, raising concerns that Brexit is finally taking a toll on the British economy. Consumer spending, a key driver of economic growth, had its worst quarter since 2014, as nervous consumers are holding tighter to their purse strings.
Federal Reserve policymakers find themselves in a quandary, as the US economy has been sending conflicting signals with regard to inflation and employment. The labor market remains red hot, as the unemployment rate fell to 4.4 percent in April, its lowest level since 2007. Problem is, inflation hasn't kept up, and remains below the Fed target of 2 percent. The Fed minutes stated that the central bank plans to raise rates "soon", and the odds of a June hike remain at about 78%, unchanged by the minutes. At the same time, the Fed has provided itself some wiggle room, and could opt to delay a hike until the second quarter if inflation or consumer indicators take an unexpected nosedive. As for additional hikes in 2017, the markets remain skeptical. The odds for a September rate stand at just 37%, with the markets unclear on whether the Fed will make further moves this year if inflation remains below the Fed target. Even if soft first quarter data was a blip, the markets (and possibly Fed policymakers) are concerned that President Trump, who is facing congressional investigations over his connections with the Russian government, may not be able to pass his agenda of cutting taxes and reigning in government spending. Gone are the heady days at the end of 2016, when a red-hot US economy had analysts predicting four rate hikes in 2017.
Once Again, Q1 Growth Upgraded in Second Estimate
The second estimate of U.S. real GDP growth for the first quarter of 2017 was revised up to 1.2%(annualized), from 0.7% in the advance estimate. This reflected upward revisions to business investment, consumer spending, and state and local government spending that were partly offset by downward revision to private inventories.
Consumer spending growth was upgraded, but was still weak at only 0.6% (prev. 0.3%), a marked deceleration from the 3.5% pace recorded in Q4. Both spending on services was slightly stronger, and the decline in durable goods was smaller.
Business investment was already a bright spot in Q1, and was revised up to 11.4%, reflecting even stronger spending on structures (+28.4%) and intellectual property (+6.7%). Residential investment was largely unchanged.
Offsetting all this good news, weaker inventory investment subtracted 1.1 percentage points from growth, slightly more than in the advance estimate (-0.9 p.p.).
Key Implications
Today's growth upgrade continues the pattern of upward revisions to GDP estimates between the first and third release. While this provides some encouragement that the weakness in Q1 was not as bad as previously thought, it doesn't really change the story of another soft start to the year, followed by a rebound in Q2. Many of the factors depressing growth in Q1 were temporary, and a reversal in Q2 is expected to drive a rebound of greater than 3% growth.
Looking through the noisy quarter-to-quarter swings in GDP (as discussed in our recent report), we judge underlying growth in the U.S. economy to be running slightly better than 2%. With an aging population, this is a decent pace of growth relative to the economy's potential (see our recent report) and strong enough to generate a modest pickup in inflation.
The Fed has already indicated it is looking through the Q1 GDP disappointment, and will take its cue more from what the revisions mean for growth in the second quarter and beyond. Moreover, it will likely be more focused on whether job market strength continues in next week's payrolls report and how that squares with the cooler core inflation readings we have seen in March and April. We expect that the Fed will stick to its gradual pace of rate hikes and hike in June, if the data cooperates.
Increased Election Uncertainty Weighs on GBP/USD
GBP/USD has rallied around 3.5% from Theresa May announced a snap general election until May 22, as markets have largely priced in the expectations on a Tory landslide victory.
GBP/USD hit a high of 1.3047 on May 18, last seen September 29.
However, the bullish momentum has waned since May 22, as the difference of approval rating between the Conservative and the Labour narrowed to 9% after Theresa May proposed cancellation of free school lunches and reduction of free healthcare services for wealthy elders.
The terror attack in Manchester and the downward revised UK Q1 GDP released on May 25 further weighed on Cable.
Notably, per the latest polls conducted by YouGov after the Manchester terror attack, the Conservatives' lead is now down to just 5%, 43/38.
On Friday May 26, GBP/USD has plunged around 100 points, hitting a 3-week low of 1.2836.
On the 4-hourly chart, the 10 SMA has crossed over the 20 SMA downward, indicating increased bearish momentum.
The uncertainty over the general election outcome has been lifting, weighing on GBP prospect.
The downtrend will likely test the significant support line at 1.2800, where there is a stronger support.
However, if the support line is broken, we will likely see an extended downtrend.
Be aware that GBP crosses are likely to be volatile before and after the general election.
The resistance level is at 1.2850, followed by 1.2880 and 1.2900.
The support line is at 1.2830, followed by 1.2800.
US durable goods, core durable goods (Apr) and Q1 GDP second reading will be released at 13:30 BST this afternoon. It will likely affect GBP/USD.
US GDP Growth Slightly Less-Slow in Q1
Highlights:
- U.S. Q1 GDP growth revised up to 1.2% from 0.7% in the advance estimate
- Consumer spending growth remained modest but was revised up slightly to 0.6% from 0.3% previously
- An already-strong business investment gain was revised up to 11.4%, marking the strongest quarterly increase in five years.
- Slower inventory investment was a slightly larger drag than previously reported
Our Take:
It is still the case that GDP growth moderated in Q1, but slightly less than previously reported and with the composition still arguing that the slowdown was more a result of quarterly volatility than a fundamental deterioration in the economic backdrop. It remains the case that slower Q1 growth largely reflected a pullback in the volatile inventory component (now slightly larger than first reported) and a sharp slowing in consumer spending growth (+0.6% now versus +0.3% in the advance estimate) that both look unlikely to be repeated. On balance, data to-date, remains consistent with our expectation that overall GDP growth bounced back to a solid 2.9% rate in Q2 and, combined with further tightening in labour markets, is consistent with our expectation that the Fed will hike the fed funds target range by another 25 basis points in June.
USD/JPY Mid-Day Outlook
Daily Pivots: (S1) 111.54; (P) 111.74; (R1) 112.02; More...
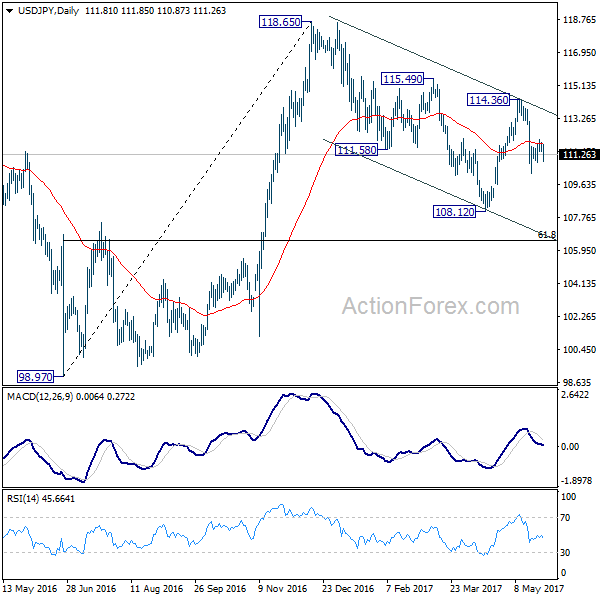
USD/JPY was rejected from 4 hour 55 EMA but it's staying above 110.85 minor support for the moment. Intraday bias remains neutral first. Rise from 110.23 is seen as a correction and the larger fall is expected to resume later. On the downside, below 110.85 minor support will turn bias to the downside to extend the fall from 114.36 to 108.12 low. Break there will resume the whole decline from 118.65. In that case, we'll look for bottoming signal again at 61.8% retracement of 98.97 to 118.65 at 106.48.
In the bigger picture, price actions from 125.85 high are seen as a corrective pattern. It's uncertain whether it's completed yet. But in case of another fall, downside should be contained by 61.8% retracement of 75.56 to 125.85 at 94.77 to bring rebound. Overall, rise from 75.56 is still expected to resume later after the correction from 125.85 completes.