Sample Category Title
Eco Data 5/30/17
[php_everywhere] [/php_everywhere]
Eco Data 5/29/17
[php_everywhere] [/php_everywhere]
Summary 5/29 – 6/2
Monday, May 29, 2017
[php_everywhere] [/php_everywhere]
Tuesday, May 30, 2017
[php_everywhere] [/php_everywhere]
Wednesday, May 31, 2017
[php_everywhere] [/php_everywhere]
Thursday, Jun 1, 2017
[php_everywhere] [/php_everywhere]
Friday, Jun 2, 2017
[php_everywhere] [/php_everywhere].
Increasingly Self-Sustaining Expansion in the Eurozone
Sentiment indicators in the Eurozone are quite strong at present. The manufacturing PMI in the euro area rose to a multi-year high in May, and the Ifo index of German business sentiment stands at its highest level since reunification. That said, the actual state of the Eurozone economy does not appear to be as strong at present as the sentiment indicators would suggest. However, the expansion is becoming increasingly self-sustaining. Accordingly, we look for real GDP in the Eurozone to accelerate modestly in coming quarters.
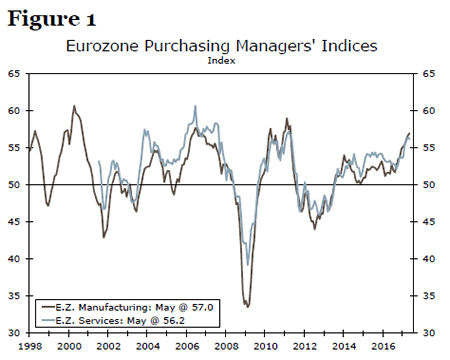
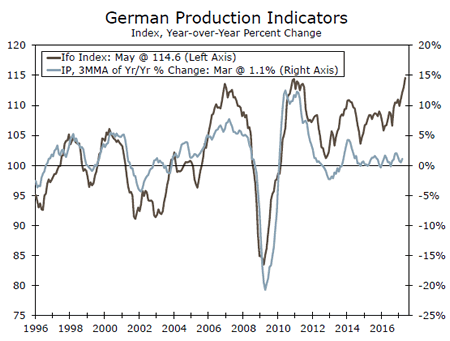
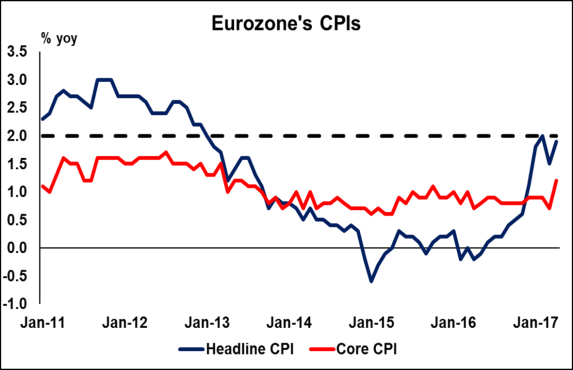
Data released this week showed that business confidence in the Eurozone continues to strengthen. The manufacturing PMI in the Eurozone rose to 57.0 in May, its highest reading in six years (Figure 1). The comparable index for the service sector edged down a bit in May, but it remains at an elevated level. Taken at face value, the strength of the PMIs suggests that the Eurozone economy is booming at present. Business sentiment in Germany, the single largest economy in the euro area, also is robust at present. The Ifo index of German business sentiment rose in May to its highest level since German reunification occurred in 1991 (Figure 2). Likewise, a widely followed index of consumer confidence in Germany edged up to its highest level in at least 12 years.
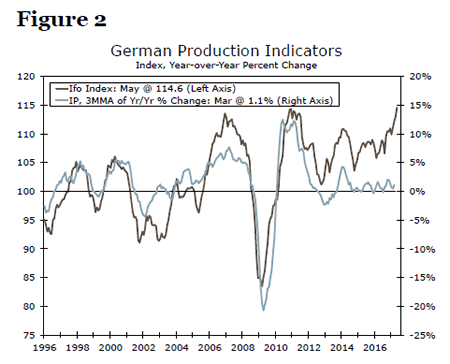
That said, there seems to be some disconnect at present between the strength in sentiment indicators and actual growth in economic activity. In Germany, industrial production (IP) was up only 1.1 percent on a year-ago basis in the first quarter of the year. With the Ifo index at its highest level in at least 26 years, it would be reasonable to expect that growth in German IP would be significantly stronger at present than just 1 percent. Perhaps IP growth in Germany will strengthen in coming months. In that regard, the volume of manufacturing orders, which was up 2.3 percent in Q1, does point to some acceleration in production going forward.
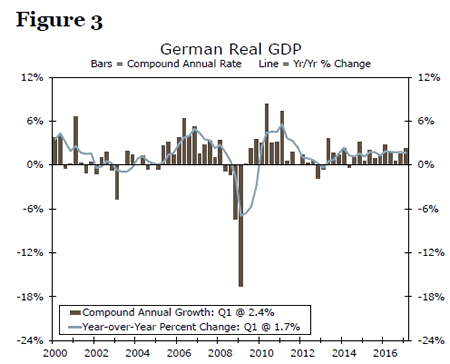
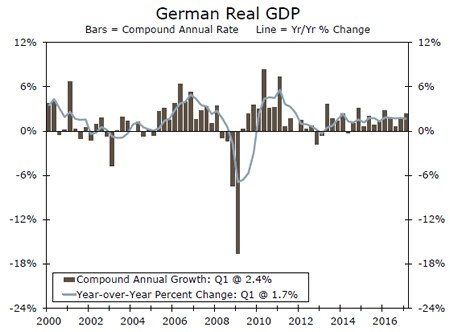
Although the actual state of economic growth in the euro area at present may be a bit disappointing in light of the strength in sentiment indicators, there are signs that the expansion is becoming increasing self-sustaining. Data released this week showed that real GDP in Germany grew at an annualized rate of 2.4 percent on a sequential basis in the first quarter, which confirmed the preliminary estimate that was released a few weeks ago (Figure 3). But the new details on the spending components that were available this week showed that domestic demand was an important driver of real GDP growth in Germany in Q1. Although real personal consumption expenditures grew only 1.2 percent in Q1, growth in investment spending was quite strong. Business spending on machinery equipment rose 5.0 percent while construction spending shot up 9.5 percent.
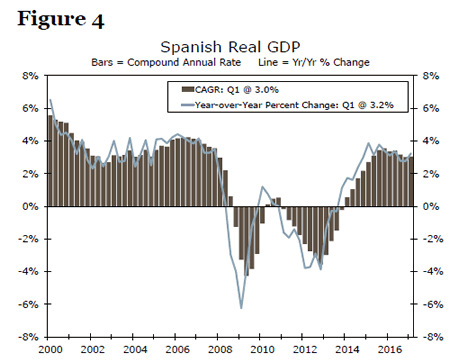
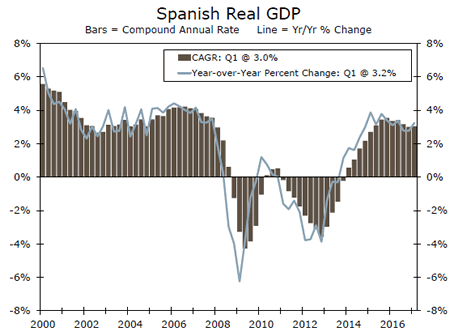
The Spanish economy tanked during the global financial crisis and its immediate aftermath - real GDP contracted nearly 10 percent between 2008 and 2013 - but growth has been quite strong in recent years. Real GDP in Spain grew 3.2 percent in both 2015 and 2016, an annualized pace of growth that was maintained in Q1-2017 (Figure 4). The data on GDP spending components in the first quarter that were released this week showed that domestic demand remains the primary driver of economic growth in Spain.
Weekly Economic and Financial Commentary
U.S. Review
Quieter Week Reiterates Generally Solid Fundamentals
- New information released this week pertaining to the housing market showed that sales of new and existing sales slipped in April after getting an early start to a very robust spring selling season.
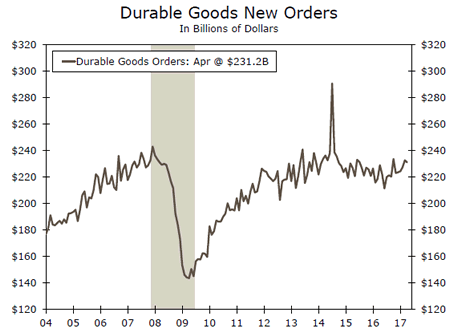
- Durable goods orders slipped less than expected though core orders also unexpectedly declined.
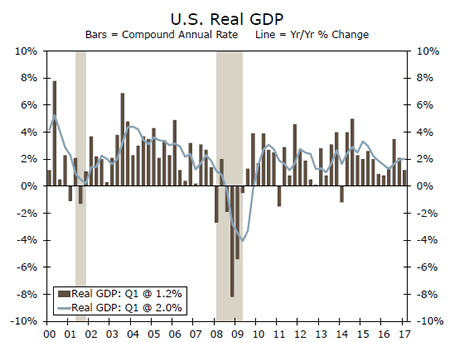
- The second look at Q1 GDP was better; the economy expanded 1.2 percent rather than 0.7 percent. We still expect a solid bounce back in Q2.
Monthly Home Sales Data Hide Robust Spring Sales
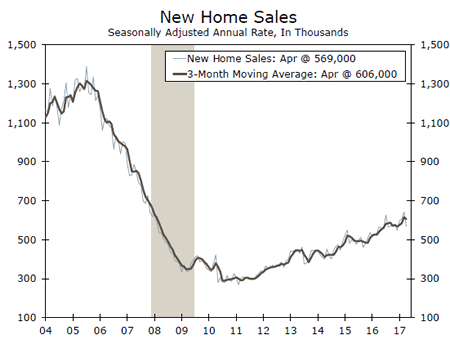
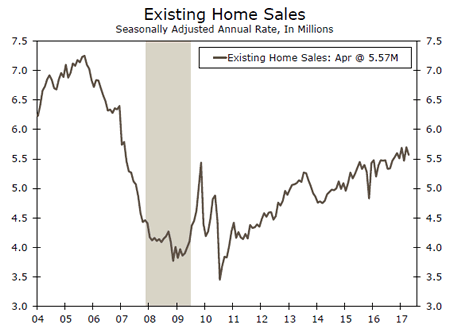
New and existing home sales in April were released this week, and both slipped further than expected. New homes sales were down 11.4 percent on the month and existing sales were down by 2.3 percent. April's 569,000-unit pace of new home sales follows an upwardly revised 642,000-unit pace in March which marks the cycle-high for the series. Sales of existing homes were also coming down from hitting a cycle high of 5.7 million-units in March. April resales were running at a still-strong 5.57 millionunit pace. The mild winter weather in the Midwest and Northeast allowed an earlier start for the spring selling season, pulling transactions that usually take place in April into earlier months. During the first four months of the year, new home sales were up an impressive 11.3 percent compared to the same period last year. Existing home sales were up 4.1 percent compared to the first four months of last year.
Resales are being held back by very low inventory of homes on the market. Even with a 7.2 percent rise in for-sale inventory on the month, there were 9 percent fewer homes on the market in April 2017 than a year ago. Competition between buyers is significant; the average home sold in April was on the market for just 29 days—the shortest point since the NAR tracked the series in 2011. One factor that may be holding homeowners back from selling is concern about finding a new home.
Housing demand is strong, supported by the healthy job market and continued recovery in household finances. Demographic factors are also starting to turn in favor of homeownership. The first quarter of 2017 marked the first time during the current cycle that household formation for homeowners outpaced rental household formation. Similarly, momentum is shifting from multifamily homebuilding to single-family and from urban markets to well-connected suburbs. Homebuilders are the most optimistic in over a decade and are seeing strong shopper traffic. For these reasons, we remain positive on housing for the year even if we do see some payback in Q2 after the strong print for Q1 residential investment in GDP.
Recent data from the factory sector have been mixed. Headline durable goods orders slipped 0.7 percent in April, which was a smaller drop than expected, and March orders were revised much higher. However, durable goods orders ex-transportation declined unexpectedly. Shipments of nondefense capital goods, ex-aircraft, our preferred measure of business equipment spending, slipped in April following a downward revision to March. Recent survey data from the factory sector has also been quite mixed. It appears the gap between the hard and soft data we have noted since the election are beginning to converge, but at a slower pace than soft data had indicated earlier.
The second look at Q1 GDP was an improvement on the first, with the economy expanding 1.2 percent as personal consumption expenditures was revised from just 0.3 percent to 0.6 percent, adding 0.2 percentage points more to headline. Fixed investment and net exports also added more to Q1 growth than first reported, while government spending was less of a drag.
U.S. Outlook
Personal Spending • Tuesday
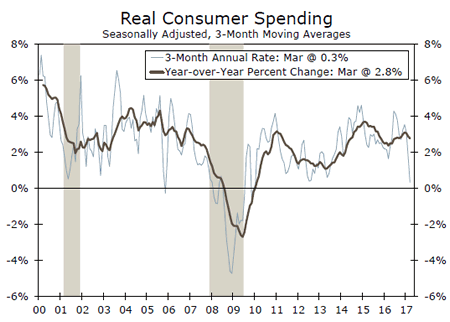
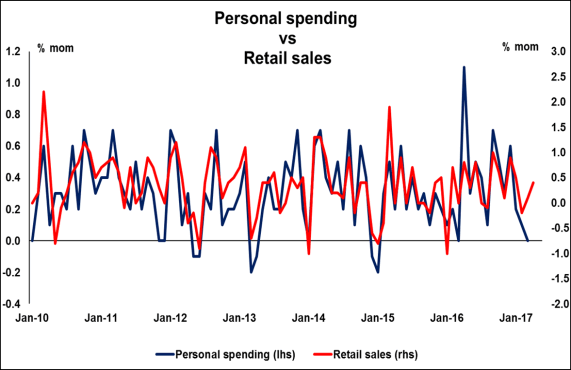
Real consumer spending started the year at just 0.3 percent in the first quarter, the slowest pace since October 2009. The downshift has been attributed to softer utilities spending but, in our view, the slower pace had more to due to a tax policy change that went into effect this year. Households filing for the Earned Income Tax Credit and the Childcare Tax Credit had their tax refunds held until February 15th. Recent consumer sector data, including retail sales data point towards a bounce back in consumer spending in Q2. Now that the delayed tax refunds are flowing to households, we expect consumer spending to make up ground in the second quarter. Our forecast calls for 3.0 percent real consumer spending in Q2. We expect nominal consumer spending to rise 0.4 percent in April, setting up a solid start to the quarter. With continued wage gains and steady employment growth, we see consumer spending rising to average 2.4 percent over the final two quarters of this year.
Previous: 0.0% Wells Fargo: 0.4% Consensus: 0.4% (Month-over-Month)
ISM Manufacturing • Tuesday
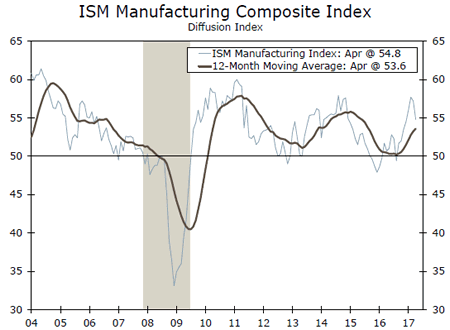
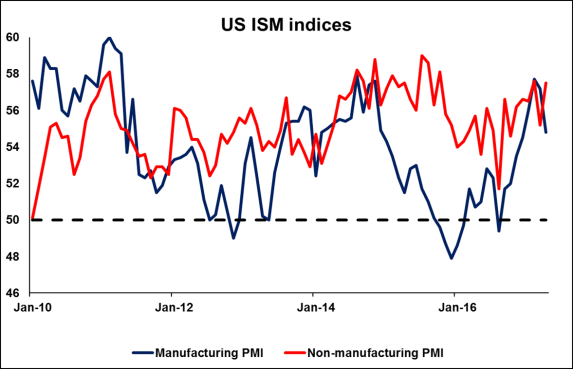
Manufacturing sentiment, as measured by the ISM manufacturing index, downshifted in April to 54.8 from March's 57.2 reading. The production subcomponent continued to show improvement, however, the new orders component softened for the month. The closely watched employment component also weakened on the month. We expect a bounce back in the headline index reading for May to 55.2. We continue to expect the industrial sector to slowing improve this year as global growth begins to firm and domestic business investment slowly begins to pick up once again. Our expectation is that industrial production will accelerate to around 3.0 percent in the second quarter, making up ground lost in Q1 before averaging 2.4 percent in both the third and fourth quarters of this year.
Previous: 54.8 Wells Fargo: 55.2 Consensus: 54.9
Employment Situation • Friday
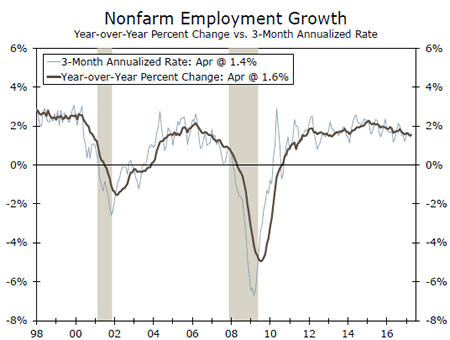
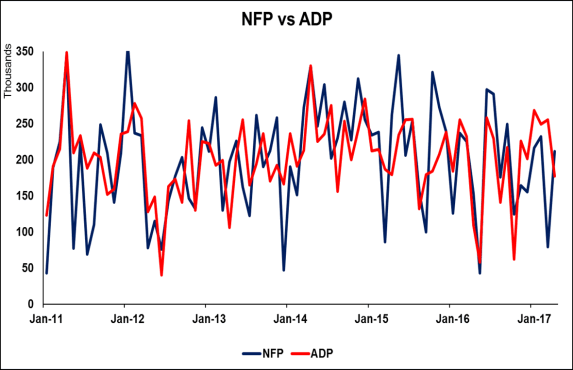
Following a disappointing March report which showed job gains of just 79,000, hiring activity accelerated in April, climbing 211,000. The unemployment rate continued to decline and now stands at 4.4 percent. Looking at the year-over-year change in nonfarm employment growth it is clear how stable the pace of job gains has been over the last few months, with only a very slight downshift recently. We expect the pace of job growth to maintain this steady pace once again in May with employers adding 185,000 jobs. We look for the unemployment rate to remain steady at 4.4 percent as the labor force participation rate climbs slightly higher. We expect the pace of job growth to average around 177,000 in Q2 and then gradually downshift in the third and fourth quarters of this year. We also expect the unemployment rate to remain steady at 4.4 percent through the end of this year.
Previous: 211,000 Wells Fargo: 185,000 Consensus: 180,000
Global Review
Increasingly Self-Sustaining Expansion in the Eurozone
- Sentiment indicators in the Eurozone are quite strong at present. The manufacturing PMI in the euro area rose to a multi-year high in May, and the Ifo index of German business sentiment stands at its highest level since reunification.
- That said, the actual state of the Eurozone economy does not appear to be as strong at present as the sentiment indicators would suggest. However, the expansion is becoming increasingly self-sustaining. Accordingly, we look for real GDP in the Eurozone to accelerate modestly in coming quarters.
Increasingly Self-Sustaining Expansion in the Eurozone
Data released this week showed that business confidence in the Eurozone continues to strengthen. As shown in the graph on the front page, the manufacturing PMI in the Eurozone rose to 57.0 in May, its highest reading in six years. The comparable index for the service sector edged down a bit in May, but it remains at an elevated level. Taken at face value, the strength of the PMIs suggests that the Eurozone economy is booming at present. Business sentiment in Germany, the single largest economy in the euro area, also is robust at present. The Ifo index of German business sentiment rose in May to its highest level since German reunification occurred in 1991 (top chart). Likewise, a widely followed index of consumer confidence in Germany edged up to its highest level in at least 12 years.
That said, there seems to be some disconnect at present between the strength in sentiment indicators and actual growth in economic activity. In Germany, industrial production (IP) was up only 1.1 percent on a year-ago basis in the first quarter of the year. With the Ifo index at its highest level in at least 26 years, it would be reasonable to expect that growth in German IP would be significantly stronger at present than just 1 percent. Perhaps IP growth in Germany will strengthen in coming months. In that regard, the volume of manufacturing orders, which was up 2.3 percent in Q1, does point to some acceleration in production going forward.
Although the actual state of economic growth in the euro area at present may be a bit disappointing in light of the strength in sentiment indicators, there are signs that the expansion is becoming increasing self-sustaining. Data released this week showed that real GDP in Germany grew at an annualized rate of 2.4 percent on a sequential basis in the first quarter, which confirmed the preliminary estimate that was released a few weeks ago (middle chart). But the new details on the spending components that were available this week showed that domestic demand was an important driver of real GDP growth in Germany in Q1. Although real personal consumption expenditures grew only 1.2 percent in Q1, growth in investment spending was quite strong. Business spending on machinery equipment rose 5.0 percent while construction spending shot up 9.5 percent.
The Spanish economy tanked during the global financial crisis and its immediate aftermath—real GDP contracted nearly 10 percent between 2008 and 2013—but growth has been quite strong in recent years. Real GDP in Spain grew 3.2 percent in both 2015 and 2016, an annualized pace of growth that was maintained in Q1-2017 (bottom chart). The data on GDP spending components in the first quarter that were released this week showed that domestic demand remains the primary driver of economic growth in Spain.
Although recent sentiment data in the Eurozone may be overstating the actual strength of economic activity, there are signs that the economic expansion that is underway is becoming increasingly self-sustaining. Indeed, we look for real GDP in the Eurozone to accelerate modestly in coming quarters.
Global Outlook
Chinese PMI • Wednesday
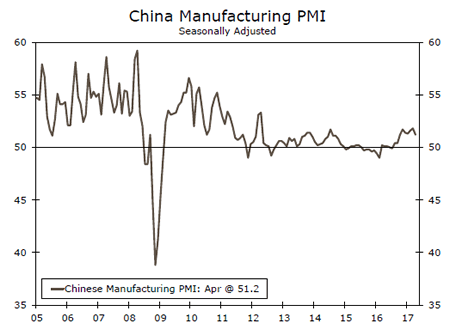
The Chinese economy grew 6.9 percent on a year-over-year basis in the first quarter. Some indications for how the second quarter is shaping up will be released next week with an early indication of business activity in May. The official PMI, which better captures large and often state-owned enterprises is out first with a scheduled release date of Wednesday. This measure had been trending higher but gave up some ground in April. That said, this measure is still above the 50 line of demarcation and as such is consistent with a modest pace of expansion.
The Caixin PMI for China is due out the following day. This barometer of small and medium sized private-sector businesses has been skating on thinner ice in recent months. In fact, the April print of 50.3 is dangerously close to slipping into contraction territory.
Previous: 51.2 Consensus: 51.0
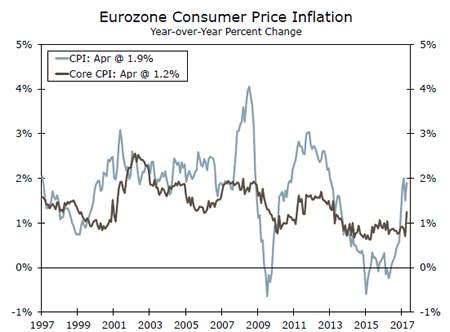
Eurozone CPI • Wednesday
Initial estimates of first quarter GDP show that the Eurozone economy grew 0.5 percent in the period to keep the growth rate steady at 1.7 percent as the economic expansion in Europe continues. Purchasing manager surveys in recent months have hit levels last seen when the European economy dodged a bullet in the wake of the sovereign debt crisis in 2010. Yet despite these positive indicators, inflation has not taken off.
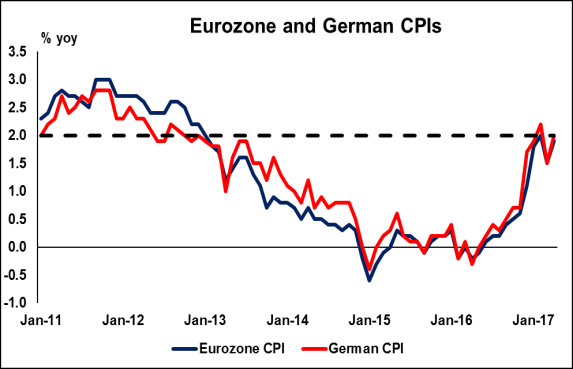
The year-over-year rate of CPI inflation in the Eurozone was 1.9 percent in April; the core CPI rate was just 1.2 percent. Modest though that may be, the 1.2 percent rate of core inflation was an uptick in the rate as the nearby chart shows. If that upward trajectory continues, the ECB may turn more hawkish at its June 8th policy meeting.
Previous: 1.9% Consensus: 1.5% (Year-over-Year)
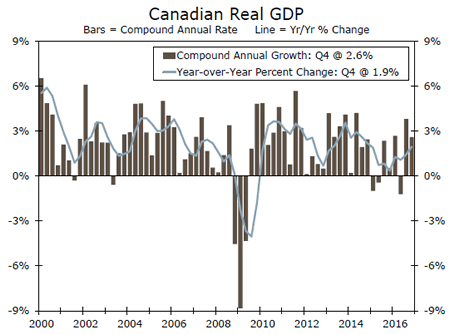
Canadian GDP • Wednesday
The weak backdrop for oil and commodity prices introduced a significant degree of weakness in business spending in Canada over the past couple of years. Since oil prices have moderated somewhat in the second half of last year, real GDP growth has increased for two consecutive quarters.
On Wednesday of next week, we will get the initial estimate for first quarter GDP growth in Canada. Retail sales increased in two out of three months in the first quarter which bodes well for consumer spending—a stalwart driver of growth in this expansion in Canada. Three straight monthly gains in wholesale trade sales and a more modest pickup in shipments suggest some help from business spending as well. The annualized pace of growth in the fourth quarter of 2016 was 2.6 percent, and we expect the growth rate in Q1 will be roughly the same.
Previous: 2.6% Wells Fargo: 2.5% Consensus: 4.3% (CAGR)
Point of View
Interest Rate Watch
A Slower Road to Normalization
The minutes of the early May FOMC meeting contained few surprises but did spell out a plan to begin to normalize the Fed's balance sheet. FOMC members spent a great deal of time downplaying the weak first quarter economic data and mentioned repeatedly that they felt any shortfall in growth was transitory. There was a bit more concern about the inability of inflation to reach and maintain the Fed's preferred 2 percent threshold but once again most members agreed that the pull back in reported inflation was temporary and likely due to several one-off factors.
The FOMC appears to feel much more confident about the employment data and some members even worried that if the unemployment rate falls further, which it has already done, then inflation could overshoot the Fed's target. Most members did not feel this way, however, and the markets interpreted the Fed's comments as being slightly dovish, or at least a bit more cautious than had been expected.
Financial market participants feel fairly certain the Fed will raise the federal funds rate target by a quarter percentage point in June but the tone of the Fed's comments left some doubts beyond that. We still expect another quarter-point hike in September and then look for the Fed to begin to reduce the size of their balance sheet toward the end of the year.
The Fed staff's recommendation on how to reduce the balance sheet was the biggest takeaway from the minutes. The Fed plans to gradually reduce the balance sheet by announcing a small amount of securities to be allowed to run off and not reinvested and then gradually raise that target.
The Fed's guarded optimism on the economy and cautious stance on balance sheet normalization was interpreted to suggest that interest rate hikes may be a little slower and that the balance sheet will remain larger for longer. Demand of intermediate-term securities thus increased. The yield on the 5-year Treasury note fell notably following the release of minutes, while yields on 2-year and 10-year notes were less impacted and ended the week close to their week-ago levels.
Credit Market Insights
Historical Look at Household Debt
Earlier this month, the New York Fed released a report (Household Borrowing in Historical Perspective) examining the newly released Q1-2017 Quarterly Report on Household Debt and Credit. The report showed a continuance in the trend of rising household debt levels for the 11th consecutive quarter, up $149 billion to $12.73 trillion. While the nominal nature of the data removes some significance of the streak, the report reveals some interesting trends and shifts when examining household debt and credit historically.
Data on household debt were not measured until 1999, but based on estimates, the level displayed a 63-year upward trend until 2008, hitting a 5-year run of declining balances. Following this aberration, debt balances began to recover, reaching 2008 levels in Q1-2017. However, the composition of household debt has shifted since that time in both the type of debt and holder. Mortgage balances have shrunk in favor of auto and student loans, while the borrower profile has shifted towards older and more creditworthy persons. These shifts have contributed to the improvement in delinquency rates. Delinquencies peaked during the recession, and are currently at levels below or near lows since 2000 in all categories with the exception of student loans. Student loan delinquencies have consistently worsened since 2004, and part of this could be explained by the rapid growth in the balance of student loans compared to other categories.
Topic of the Week
Budget Wonks Need the Long Weekend
This week the Trump administration released its budget for fiscal year (FY) 2018 and the following decade. The administration's projections show publicly held debt will be reduced to 60 percent of GDP by the end of the 10-year window. This goal is achieved through $3.6 trillion in spending cuts and (assumed) faster economic growth spurred by the president's policies.
One of the most important aspects of any set of budget projections is the economic assumptions used. The top chart compares the GDP growth assumptions contained in the president's budget relative to our forecast, the Congressional Budget Office's (CBO) and the Blue Chip Consensus. While growth forecasts are roughly consistent in the near term, the administration's assumptions over the long-run are much greater than our forecast as well as those of the Blue Chip and CBO.
It should be noted that while the president's budget often garners political attention, rarely does Congress enact all or even some of a president's proposed budget. The next major step is for Congress to assemble and pass its own budget proposal, the FY 2018 budget resolution, which will establish the spending and deficit levels for the next 10 years. This process will also help get the legislative ball rolling on tax reforms/cuts.
Also on the D.C. policy front this week the CBO released its score of the House-passed American Health Care Act (AHCA). The score was only marginally different from earlier estimates: CBO projects the bill would reduce the federal deficit by $119 billion over the next 10 years, and the number of uninsured would rise by 23 million by 2026 relative to current law (bottom chart).
The estimates from CBO show that the path forward for Congressional Republicans remains challenging. In order to keep the plan deficit-neutral, policymakers have about $19 billion a year to work with to try and make the bill more palatable in the Senate. As the health care and budget debates move forward, we will continue to update our readers on key fiscal policy developments.
The Weekly Bottom Line
HIGHLIGHTS OF THE WEEK
United States
- Despite the upward revision to first-quarter GDP growth, with the second estimate indicating a 1.2% annualized gain on stronger consumption and investment, market reaction was relatively subdued given that the overall story is largely unchanged.
- Although investors are almost fully pricing in a June rate hike, the yield curve flattened this week as longerterm growth prospects became murkier and the Fed communicated that the balance sheet unwinding process would be protracted.
- Strength in consumption should leave the U.S. economy 3.3% larger this quarter, for an average growth of 2.2% during the first half of the year. While this is far from red-hot, it nonetheless is enough to reduce slack and should enable the Fed to continue along its gradual rate hike path.
Canada
- News and data were thin ahead of the BoC's monetary policy decision this week, but what little there was served to confirm our expectation of strong Canadian economic performance for 17Q1.
- Next week we expect Statistics Canada to report economic growth of about 4.0% (annualized) in the first quarter. This strong expansion is expected to be largely driven by consumer spending and business investment.
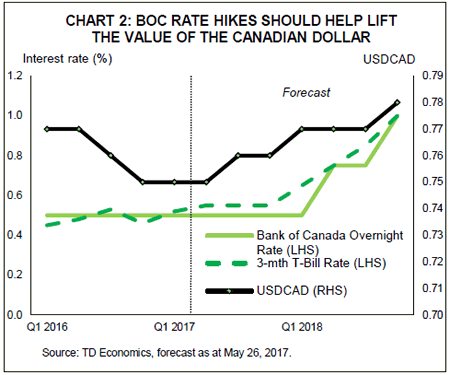
- With excess capacity quickly being absorbed, a rate hike by the BoC is likely to happen as early as 18Q2. Combined with firming energy prices, this should help provide a lift to the Canadian dollar. The bid on the Canadian dollar following Wednesday's monetary policy statement suggests maybe the time has come to buy Canada.
UNITED STATES - FED MINUTES SIGNAL JUNE HIKE
Despite the upward revision to first-quarter GDP growth, with the second estimate indicating a 1.2% annualized gain on stronger consumption and investment, market reaction was relatively subdued given that the overall story is largely unchanged. After another slow start to the year in 2017, economic growth appears to be rebounding this quarter, and should help to further diminish labor market slack.
That narrative was expressed in the minutes of the FOMC meeting released this week, which confirmed that participants are willing to see through the first-quarter weakness, and more robust data should be enough to justify a June rate hike. The minutes suggested some discomfort about softer inflation readings for March and April, with the Fed anticipating the upcoming inflation reports to confirm the one-off nature of the declines. Next week's payrolls should also help mitigate further concerns should the American economy continue to produce jobs at a healthy clip and wage growth pick-up.
Despite investors almost fully pricing in a June rate hike, the yield curve flattened this week as longer-term growth prospects became murkier and the Fed communicated that the balance sheet unwinding process would be protracted. Trump's proposed budget released this week featured projections of a drastically reduced debt-to-GDP ratio. But the feasibility of the plan is already being contested given its generous underlying growth assumptions. At the same time, the administration's efforts to push through health care and tax code reform are being met with significant opposition from Congress, leading bondholders to pare back their longer-term growth forecasts. So far, equity investors have remained upbeat, with stock prices recovering last week's losses, supported by stellar first quarter corporate earnings.
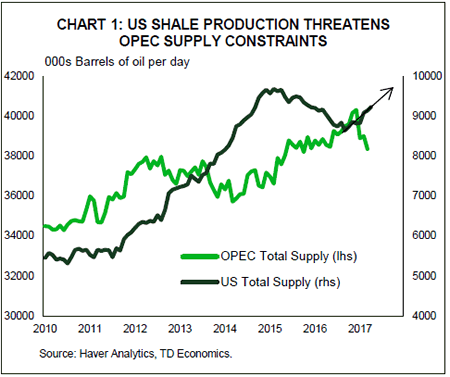
Oil tumbled this week as OPEC's extension of production cuts through to Q1 2018 fell short of market expectations. The decision comes amidst a surge in US shale production to its highest level since August 2015, keeping oil inventories elevated and having the potential to undermine OPEC's agenda. Having said that, we expect that oil will find its footing and will end the year higher as U.S. production growth decelerates and the market rebalances.
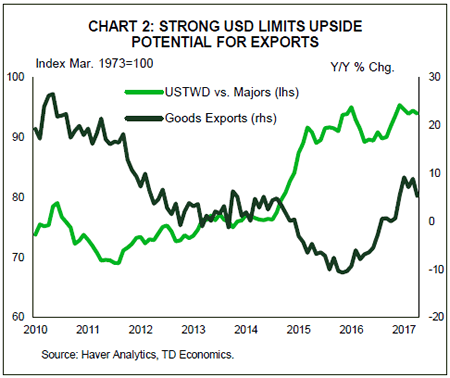
Economic data out this week was relatively modest. Sales of new and existing homes pared back in April, after a strong start to the year. Moreover, April's advanced international goods trade balance widened unexpectedly as the surge in imports outpaced the rise in export volumes. Ultimately, the strength of U.S. demand and a relatively elevated dollar will boost imports and hinder export growth, with offsetting impacts on U.S. manufacturers. Next week's ISM manufacturing index will likely telegraph continued growth for the sector, albeit at a slightly slower pace.
Next week's income and spending data will provide information on how consumers and inflation performed during the very important handoff month of April. We expect growth in consumption to accelerate from 0.6% in the first quarter to about 3.4% during Q2. Taken together with some inventory investment, the strength in consumption should leave the U.S. economy 3.3% larger this quarter, for an average growth of 2.2% during the first half of the year. While this is far from red-hot, it nonetheless is enough to reduce slack and should enable the Fed to continue along its gradual rate hike path.
CANADA - BUY CANADA
A relatively quiet and short week, but what little new information there was proved to confirm the expectation for a strong performance by the Canadian economy at the start of this year. Indeed, strong economic momentum is boosting business confidence. The CFIB's Business Barometer index rose to 66 in May, its best reading in two and a half years and near levels seen prior the 2014 oil price collapse. The boost to small business optimism was fairly broad, although the natural resource sector recorded its third consecutive monthly decline, likely a reflection of sectoral challenges including low prices and softwood lumber tariffs. An early indicator, it is supportive of our view that economic activity is on track to expand at an above 2.0% pace in 17Q2.
Unfortunately, corporate profits have yet to fully mirror the strong performance of the Canadian economy, but should eventually. Although corporate profits of Canadian firms declined 7.4% in 17Q1 relative to the end of 2016, underlying developments were more positive. Excluding a one-off actuarial adjustment in the insurance and related industries from the calculation revealed corporate profits grew 0.5%.
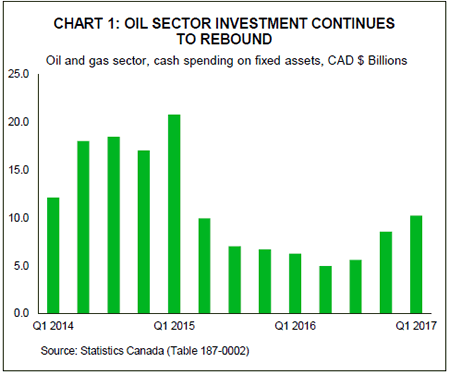
While struggling to regain profitability, the Canadian oil sector continues to show signs of life. Since 2014 the sector has responded to the collapse in oil prices by cutting jobs and investment. As a result, it has been a drag on both provincial and national economic activity. However, the rebound in oil prices appears to have renewed investment interest in Canada's oil sector. Drilling rig counts are climbing, and cash spending on fixed spending in the sector is resurgent - both signs of a sector in recovery mode.
A recovering oil sector is just one factor driving the above trend economic performance. Next week we expect Statistics Canada to report economic growth of about 4.0% (annualized) in the first quarter. This strong expansion is expected to be largely due to consumer spending and business investment. Household consumption growth appears to reflect labour market improvements, although real wage growth continues to disappoint. Business investment is expected to be driven by an oil sector led expansion in structures.
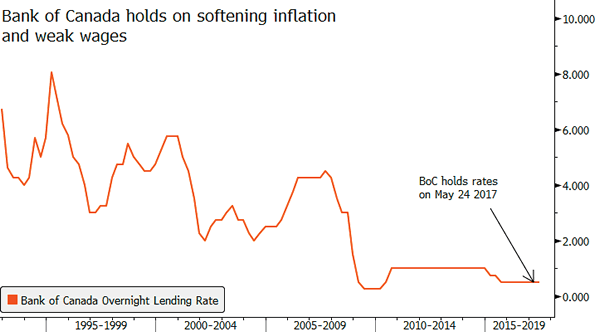
The above trend pace of economic activity may still have room to run. Excess capacity is apparent in the Canadian economy, as highlighted by the Bank of Canada's (BoC's) Monetary Policy decision this week. As universally expected, the BoC kept its policy rate at 0.5%, noting that all three measures of core inflation remain below target and wage growth remains subdued - all signs of economic slack. Notably absent were comments about the financial troubles of Home Capital Group, suggesting some comfort by policymakers that the scope for contagion is limited.
Canada's strong economic performance thus far has been seemingly ignored by financial markets, as concerns about Canada's housing market and trade clouded the outlook. With excess capacity quickly being absorbed, a rate hike by the BoC is likely to happen as early as 18Q2. Combined with firming energy prices, this should help provide a lift to the Canadian dollar. The bid on the Canadian dollar following Wednesday's monetary policy statement suggests maybe the time has come to buy Canada.
Interesting Times for the US Dollar
What to look out for this week
- European markets remain much the same
- Sterling slips on GDP drop and election concerns
- Interesting times for the US Dollar
- Canadian Dollar stronger on positive economic news
European markets remain much the same
There wasn't much volatility this Bank Holiday Friday. European traders had time off for Ascension Day, leaving European markets fairly stable.
Sterling slips on GDP drop and election concerns
However, Sterling slipped on a Gross Domestic Product (GDP) downgrade, amidst fears that the incumbent parliament may not get the landslide victory they were expecting.
Sterling could be in for a bumpy ride again and is likely to move in the coming days, in the run up to the UK General Election, as pollsters and media discuss the strength of the various candidates and sways Sterling strength.
Interesting times for the US Dollar
In contrast, the US Dollar strengthened somewhat following the US Federal Open Market Committee (FOMC) minutes, which suggested a US interest rate hike could be on the cards very soon. This was halted, however, by the news of the Federal Reserve's proposed reduction in Quantitative Easing (QE).
US Q1 economic growth data showed less growth than expected and the slowest rate of growth since Q1 2016. This is certainly far removed from the market forecasts, which suggested that GDP growth would be revised upwards at 0.9 percent. These figures contrast with strong employment figures and GDP growth of 1.2 percent annually, compared to the previous month's 0.7 percent.
Concerns are growing about the ability of the Trump administration to implement ambitious financial and economic reforms, designed to boost US business.
Canadian Dollar stronger on positive economic news
The Bank of Canada has kept their interest rates at the same level, strengthening the Canadian Dollar, alongside positive economic data and rising oil prices.
Chinese economic downgrade
China's credit rating has been downgraded by ratings agency, Moody's, for the first time since 1989, as well as amending the economic outlook to negative, as they predict a slowing of growth for the Asian powerhouse.
What will be the outcomes of the G7 meeting?
We also await the various communications from world leaders from the G7, which tend not to have too much of an impact on currency markets, but can hold insights into future policy and plans that may have more of an effect.
Watch out for currency volatility to protect against losses In times of uncertainty and turbulence, it's important to keep a close eye on exchange rate movements and consider your short-term currency risk management strategy carefully, as well as assessing longer term expectations.
What to look out for next week - and beyond...
Next week, at the very start of a new month, we have the global release of the Manufacturing Purchasing Managers' Indices (PMI) on 1st June, always a useful indicator of economic clout. The Services PMI will follow on 5th June, also holding important insights on the strength of world economies, industry challenges and opportunities. Then we will have the much-discussed UK general election on 8th June, which is bound to cause market volatility.
Should be interesting! In the meantime, enjoy the weekend and if you are in the UK or US, enjoy the Bank Holiday.
Bank Holiday Jokes:
One seventh of your life is spent on Monday. However, the only person to get his work done by Friday was Robinson Crusoe.
If a train station is where the train stops, and a bus station is where the bus stops, what is a work station?
I've just been on a holiday of a lifetime. I'll tell you what, never again."
Week Ahead US Political Risk and Data to Guide Markets
Holidays in UK and US will compress busy trading week
The US dollar is regaining momentum after the Commerce department upgraded its first quarter GDP estimate from 0.7 percent to 1.2 percent. The U.S. Federal Reserve was already considering the slowdown a transitory one as per the minutes from its May meeting that were released on Wednesday. US political risk is keeping the USD from taking off as the Russian connection probe is now targeting Trump's son law Jared Kushner. The price of gold has risen as investors looks for a safe haven during times of turbulence.
The GBP has dropped following the results of election polls are showing Labour has narrowed the Conservative lead with less than two weeks to go before the snap election on June 8. The questionable handling of social benefit reductions and the uncertainty following the Manchester attack have rocked the political narrative. Conservatives are still expected to win a majority, but will not come unscathed ahead of upcoming Brexit negotiations that could set the UK for a different economic reality.
The Memorial Day holiday in the United States and the Spring Bank Holiday in the UK will keep market action subdued on Monday. US economic released will be shifted to accommodate the shorter week. The ADP private payrolls report will be released on Thursday, June 1 at 8: 15 am EDT, followed by weekly unemployment claims at 8:30 am EDT, ISM manufacturing PMI at 10:00 am EDT and weekly crude inventories at 11:00 am. The U.S. non farm payrolls (NFP) report will be published on Friday, June 2 at 8:30 am EDT. Employment has been the strongest pillar in the recovery of the US economy with the Fed looking more closely at the wage component for signs of positive inflation ahead of the June FOMC meeting.
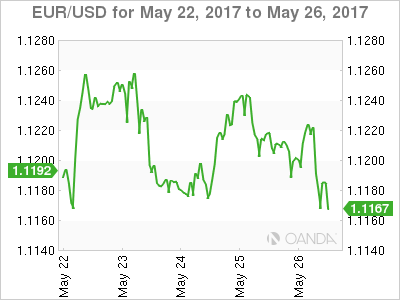
The EUR/USD gained 0.173 percent in the last week. The single pair is trading at 1.1196 after the USD is making a late charge on the back of an improved first quarter GDP reading. The second estimate revised the growth of the US economy from 0.7 percent to 1.2 percent. The GDP is still lower than the 2.1 percent average since the end of the recession but is now more in line with the lack of momentum at the beginning of the year that picks up speed. The US Consumer sentiment was revised slightly to 97.1 as the index has slowly retraced since January.
The June Federal Open Market Committee (FOMC) meeting is fast approaching and Fed speakers have for the most part been supportive of more rate hikes. The market has increased the probabilities it is pricing in for the June FOMC and is close to 90 percent with only the NFP report as a potential, but long shot, to derail a rate increase in June.
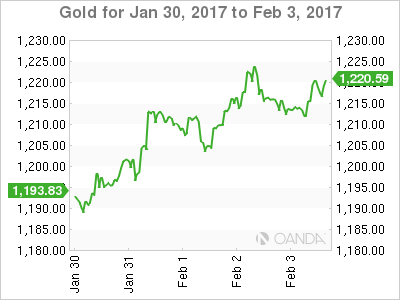
Gold gained 1.032 in the last five days. The yellow metal is trading at $1,266.02 after geopolitical turmoil has made investors turn to a safe haven. The US probe into Russian connections within the Trump administration and the stronger tone on North Korea from President Trump ahead of the G7 meeting in Italy have shifted the focus away from Europe. The UK elections on June 9 and French parliamentary elections on June 11 are full of uncertainty, specially after the fumbles in the UK Conservative party have closed the gap of what was considered a slam dunk win back when the snap election was called.
Gold has advanced even as the Fed minutes kept the June rate hike on the table, and comments from various Fed members have been net positive of multiple rate hikes needed sooner rather than later. The main reason is that a rate increase by the American central bank has been mostly priced in already with the market assigning a probability of 87.7 percent that the June 14 Federal Open Market Committee (FOMC) will end up with a 100 to 125 basis points range. The market's optimism does not extend to the December meeting with only 36.7 percent of the rate going to the 125 to 150 basis points range.
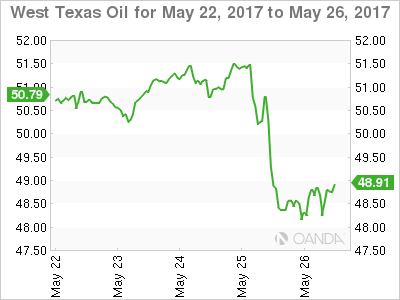
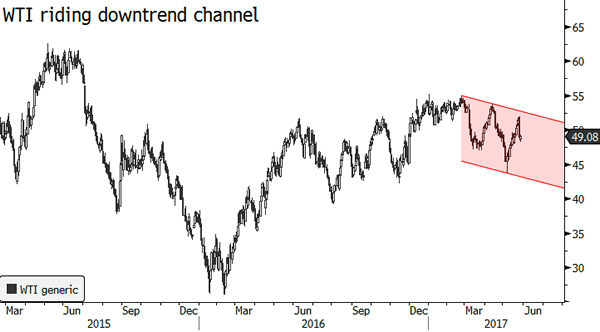
Oil lost 2.55 in the last week. The price of West Texas Intermediate is trading at $48.64 after the Organization of the Petroleum Exporting Countries (OPEC) meeting in Vienna ended with no surprises about the 9 month extension to the production cut agreement with members and other major producers agreeing to extend the deal until the end of March 2018.
The OPEC might have revealed too much ahead of the meeting as this time they stuck to the script that was offered when Saudi Arabia and Russia issued a joint statement backing the extension on May 15. The market quickly priced in that information but as rumours and comments circled that nothing was set and there could be a possible longer time frame and deeper cuts the price of oil surged. When those proved to be unfounded as the OPEC and other producers announced that the terms were exactly those from the Saudi Arabia and Russia statement there was a sell off of crude.
The price of oil is trending upwards on Friday's trading and in the midterm it will depend more on global inventories for direction. Last week US inventories shrank by 4.4 million barrels almost doubling the forecasted number. US production will also keep prices near current levels, but a weak dollar might help the OPEC move the price towards the $60 price level.
Market events to watch this week:
Monday, May 29
- 9:00 am EUR ECB President Draghi Speaks
Tuesday, May 30
- 10:00 am USD CB Consumer Confidence
- 5:00 pm NZD RBNZ Financial Stability Report
Wednesday, May 31
- 8:30 am CAD GDP m/m
- 9:30 pm AUD Private Capital Expenditure q/q
- 9:30 pm AUD Retail Sales m/m
Thursday, Jun 1
- 4:30 am GBP Manufacturing PMI
- 8:15 am USD ADP Non-Farm Employment Change
- 8:30 am USD Unemployment Claims
- 10:00 am USD ISM Manufacturing PMI
- 11:00 am USD Crude Oil Inventories
Friday, Jun 2
- 4:30 am GBP Construction PMI
- 8:30 am CAD Trade Balance
- 8:30 am USD Average Hourly Earnings m/m
- 8:30 am USD Non-Farm Employment Change
- 8:30 am USD Unemployment Rate
*All times EDT
US Employment Report, Eurozone Inflation Prints, Other Key Data in Focus
Next week's market movers
- In the US, the final employment report before the Fed's June meeting could add the finishing touch to market expectations regarding a hike at that gathering.
- In Eurozone, CPI data for May will be in the spotlight, amid heightened speculation regarding an increasingly more optimistic tone by the ECB at one of its upcoming meetings.
- We also get key economic data from Germany, the UK, and the US.
On Monday, we have no major events or indicators on the economic agenda. Markets will remain closed in the US, the UK, and China.
On Tuesday, we get Germany's preliminary CPI data for May, just one day ahead of Eurozone's. The forecast is for the nation's inflation rate to have declined notably. We see the risks surrounding that forecast as skewed to the upside, perhaps for a smaller-than-anticipated decline, considering that the preliminary Markit composite PMI for the month showed that German businesses raised their prices at one of the steepest rates in six years. In case Germany's CPI rate surprises to the upside, it could raise some speculation for a positive surprise in the bloc's print as well.
From the US, we get personal income and spending data, all for April. The forecast is for both the income and the spending rates to have risen from the previous month. The income forecast is supported by a similar increase in the average hourly earnings rate for the same month. Meanwhile, the spending forecast is somewhat supported by the rebound in retail sales during the month. Bearing in mind that the FOMC May meeting minutes showed that policymakers want to see evidence that GDP growth rebounded in Q2 before hiking again, we think that investors will focus primarily on the spending print, as consumption is by far the largest component of US GDP.
Staying in the US, we also get the core PCE price index for April, though no forecast is available yet. We see the case for the rate to have remained unchanged, with risks tilted to the downside. We base that view on the unexpected decline in the core CPI rate for the month, as well as the nation's Markit services PMI, which showed that service providers raised their prices at the slowest rate for five months.
On Wednesday, Eurozone's preliminary CPI figures for May will capture market attention. The forecast is for both the headline and the core rates to have declined. We view the risks surrounding these forecasts as tilted to the upside, given that the bloc's preliminary composite PMI for May showed that firms raised their selling prices at the second fastest pace since 2011. Considering that these will be the last inflation prints before the ECB's June meeting, we expect them to attract even more attention than usual, amid elevated speculation regarding the prospect of a more optimistic tone by the ECB. Indeed, the bloc's economic data are improving rapidly, adding credibility to that scenario. Inflationary pressures are picking up overall, GDP growth is strong and the unemployment rate has been declining steadily. Thus, we agree that the Bank could begin to change its forward guidance and signal that the risks surrounding growth are no longer tilted to the downside, but are instead close to balanced. The minutes of the May ECB gathering already showed that "some members" considered the risks to GDP as broadly balanced, which suggests that a change in language may be on the cards as early as at the June meeting.
On Thursday, from the US, we get the ADP employment report as well as the ISM manufacturing PMI, both for May. Kicking off with the jobs data, the consensus is for the private sector to have added 185k jobs, slightly more than April's print of 177k. In case the ADP figure meets or exceeds its forecast, we could see increased speculation for the nonfarm payrolls print to also meet its forecast of 183k.
As for the ISM manufacturing index, the forecast is for the figure to have declined marginally, but to still remain safely above the critical 50 mark that separates expansion from contraction in the sector. The case for a modest tumble in this print is supported by a similar decline in the Markit manufacturing index for May, which fell to an 8-month low, dragged lower by softer output, new orders and employment growth.
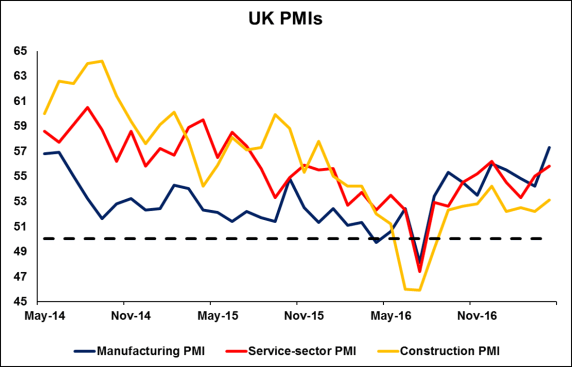
From the UK, we get the manufacturing PMI for May and then on Friday, we will get the construction index for the month. The forecast is for both of these indices to have declined, though such a decline would still leave the manufacturing index at a very elevated level. Even though these will likely give the first picture of how the UK economy performed in May, we think that investors may prefer to wait for the services index that will be released the following week before making their overall assessment. The service sector accounts for the vast majority of UK GDP. In addition, we think that over the next couple of weeks, UK political developments are likely to overshadow economics, bearing in mind the looming General Election. In this respect, we expect incoming polls to attract a lot of market attention. The risk here for sterling would be any new polls that show Labour catching up with the Conservatives, as that could amplify speculation that Theresa May could fail to secure the strong majority she is seeking in Parliament.
On Friday, all eyes will be on the US employment report for May. The forecast is for nonfarm payrolls to have risen by 183k, less than the 211k in April, but still a solid number that is consistent with further tightening in the labor market. The unemployment rate is expected to have ticked up while average hourly earnings are anticipated to have slowed somewhat in monthly terms, though that would leave the yearly rate unchanged at +2.5% yoy. Despite some potential softness in the unemployment rate and earnings, we think that overall, this is likely to be seen as a decent report by FOMC officials. An uptick in the unemployment rate would leave it at 4.5%, which is still consistent with the FOMC's estimation of full employment, suggesting that such an uptick is unlikely to be particularly worrisome for the Fed. As for earnings, we doubt that this will be a game-changer for policymakers either.
At the time of writing, the probability for a June rate hike is 83% according to the Fed funds futures, implying that as far as the market is concerned, it is almost a done deal. As such, we think that the risks surrounding the dollar from monetary policy over the coming two weeks may be asymmetrical and tilted to the downside. In case we get strong data consistent with the Fed raising rates, we could see that probability climb a bit higher towards 100% ahead of the meeting. However, any serious disappointment in economic indicators could lead to a significant re-pricing of that probability. In this respect, it is critical to remember that in the FOMC May meeting minutes, policymakers signaled they want to see evidence that the recent slowdown in economic activity was indeed transitory before taking any further action, something that is not clear yet in our view.
Trump And OPEC Send The Loonie Higher
- US Data Key To USD Positioning - Peter Rosenstreich
- Crude Oil's Roller-Coaster Ride - Arnaud Masset
- Canada: Trump And OPEC Send The Loonie Higher - Yann Quelenn
- Swiss Smart Beta
Economics - US Data Key To USD Positioning
The USD failure to hold gains is a clear indication that sentiment around the greenback has shifted. The FOMC 14th June rate decision is expected to bring a 25bp hike, yet following the Feds interest rate tightening cycle becomes subdued. Markets have already shifted away from two additional hikes to possible one in 2017. The fact is that US economic data has not recovery significantly since the soft patch in 1Q, while global economic data has underwhelmed. Suggesting that acceleration for US growth is unlikely. Anticipation for stronger growth in 2H, to a pace of 2%, has been based on expectation for fiscal stimulus, primarily tax reform. Yet, instability in the Trump administration has derailed the near term likelihood of his pro growth policy. Stalling of the US economic story to backstop risk appetite, has exposed markets to rogue bouts of volatility (as seen by markets now reacting to every news headlines). Next weeks US data heavy schedule will be critical for the USD, high beta currencies and stocks with their nose bleed valuations.
First up is consumer data, which needs to remain, elevated to support any chance of hikes after June. Markets and Fed members have been unimpressed with 1Q inflation trend. Income growth has remained marginal in 1Q averaging 0.3% m/m. Given the strong April employment data we should see a stronger increase. Yet continued failure of spillover from tigher labor markets into wage growth will have clear dovish effect on Fed speakers. We could see personal income increase 0.5% m/m, which will encourge the few hawkish members.
Personal consumption expenditure in 1Q was also disappointing. Yet uptick in retail sales should support personal spending. Durable good spending should have also improved after recovery in automotive and parts picked up after 3 months of decline. At the May FOMC members indicated that weakness in PCE was due to transitory factors, such a wireless telephone services.
However, soft incoming data since the meeting indicates that core PCE is unlikely that have rebounded. PPI specifically has failed to meaningfully contribute to core PCE. Taken in its entirely we suspect that balance of risk is for a weaker USD in the near term. We don't see a substantive shift in the economic data that would support repricing of additional rate hikes. The shallow Fed tightening cycle will keep USD supported just enough to get pushed lower. Traders should watch for sustained higher average volatility in currencies.
Economics - Crude Oil's Roller-Coaster Ride
After several months of relative quiet trading, crude oil came back under the spotlight as investors anticipated the outcome of the May OPEC meeting. Markets' expectations were high as the supply cut provided by OPEC members and selected non-members failed to boost durably crude oil prices. Indeed, following the previous OPEC meeting - back in November 2016 - the Cartel agreed to trim output to 32.5 million barrel a day, which correspond to a cut 1.8 million barrel a day. This decision allowed crude oil to rally strongly, with the WTI jumping to around $54. However, the honey moon didn't last long as the effect of the so-called "output deal" were rapidly put into question by market participants as we get closer to the end of the six months trial period.
On May 25th, the 14 OPEC members and 10 non-members agreed to extend the cut for a further period of nine months, starting July 1st 2017 until the end of the first quarter of 20108. The decision was no surprise and was already priced in the future market. In fact, both the Brent and WTI extended losses after the announcement, suggesting that investors hoped for deeper production cuts. The West Texas Intermediate's price fell more 7% over the last two days and returned below the $49 threshold, while Brent's price slid to $50.
As explained in our Weekly Report a couple of weeks ago, we believe this decision is not sufficient to bolster crude oil prices in the medium nor the long-term. The current OPEC strategy is fatally flawed as the US shale industry, which does not participate to the effort, is the primary beneficiary of those production cuts, meaning that the higher the price, the higher the number of profitable US wells.
Once again, the market will enter in to a wait-and-see attitude and assess the effect of the recent extension decision. We expect a few choppy trading session over the next couple of weeks but we remain highly sceptical it will fuelled a rally. The OPEC and its allies need to provide a much larger effort to lift price above the $60 threshold. Extending a deal that had mixed results will not do the job.
Economics - Canada: Trump And OPEC Send The Loonie Higher
Unsurprisingly, Canada's central bank has decided to keep unchanged its overnight rate target at 0.50%. The Bank Rate is at 0.75% while the deposit rate is at 0.25%.
Financial markets are still expecting the cost of borrowing to stay low for some more time and underpin the housing bubble. Since 2009, the average price of a home has increased by more than 40% in nominal terms.
It is clear that the housing market is a concern. It is way too soon to assess recent measures from the provincial government in Ontario aiming at cooling the real estate market (rent control in particular).
In terms of economic data, annualised inflation (1.6%) is declining and is still below the central bank's target midpoint. According to the Monetary Policy Report, consumer prices are declining because of the intense retail competition. March retail sales (excluding Auto) are also on the soft side with -0.2% y/y performance.
Canadian policymakers are largely following the US economic recovery. Officials hinted that the benchmark interest rate policy may change when the US economy will rebound further in the second quarter. Anyway, the Canadian central bank is satisfied with the current level of monetary stimulus and seems then very optimistic about the next US Q2 that would allow them to normalize their monetary policy.
Currency-wise, current major CAD drivers are US President Donald Trump and OPEC. The market is pricing in more difficulties for Trump to achieve its reforms. By the way, there are now more bearish pressures on the greenback.
The loonie has been strengthening since the start of this month and is now trading around one-month highs against the US dollar below 1.35. In addition, markets rumours were right, OPEC will continue to cut production beyond June, and for the next nine months, so we believe this is also sending the loonie higher. There is definitely more downside risks on the USDCAD pair.
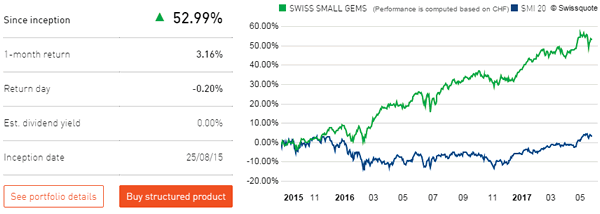
Themes Trading - Swiss Smart Beta
Switzerland's stability has provided ideal soil for global brands to develop. The Swiss National Bank's commitment to hold interest rates negative "for some time" should convince domestic savers to move their savings into stocks while allowing the Swiss franc to further devalue. With a weaker Swiss franc, companies will regain some of the competitive edge they have lost. However, Swiss companies rely more on brand quality and innovation than on pure price competitiveness. Outside the blue chip names are small cap companies that are perfect for value investors, offering a P/E of 15x (compared with 18x for US small caps) and attractive dividend yields.
This theme was built using companies with market capitalizations below CHF 2 billion, P/E less than 18 and used a standard GARP (growth-at-areasonable price) model to uncover the most attractive stocks.