Sample Category Title
Trade Idea Update: GBP/USD – Stand aside
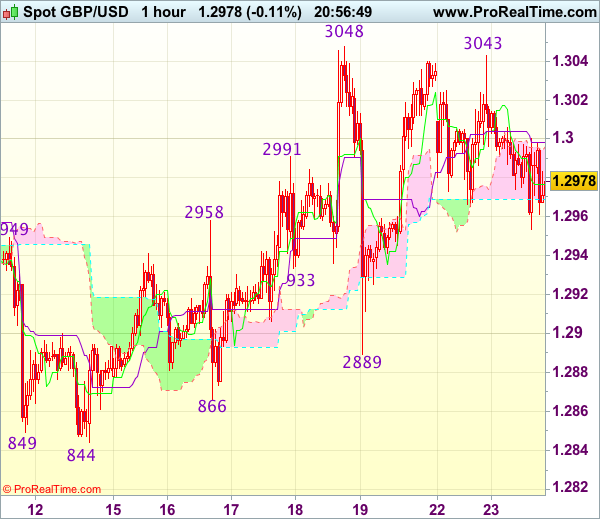
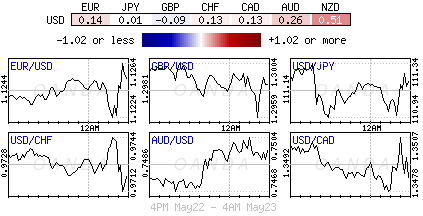
GBP/USD - 1.2983
New strategy :
Stand aside
Position : -
Target : -
Stop : -
Despite yesterday’s rise to 1.3043, as cable has retreated after faltering below indicated resistance at 1.3048 (last week’s high), retaining our view that further choppy trading below this level would be seen and pullback to 1.2950 cannot be ruled out, however, reckon downside would be limited to 1.2920-25 and said support at 1.2889 should remain intact, bring another rebound later.
On the upside, only a break of said resistance at 1.3048 would confirm recent upmove has resumed an extend further gain to 1.3075-80 and possibly towards 1.3100-10 later. As near term outlook is mixed, would be prudent to stand aside in the meantime.
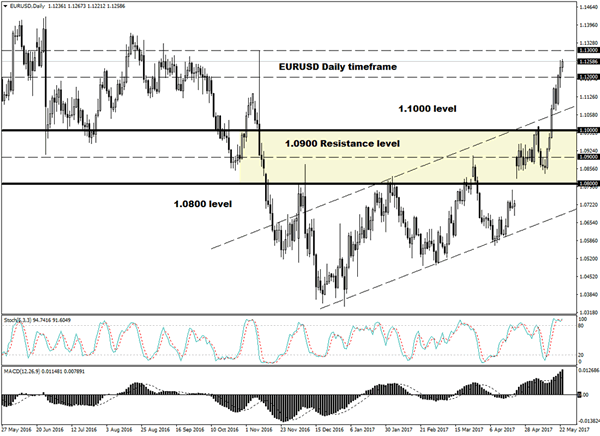
Trade Idea Update: EUR/USD – Stand aside
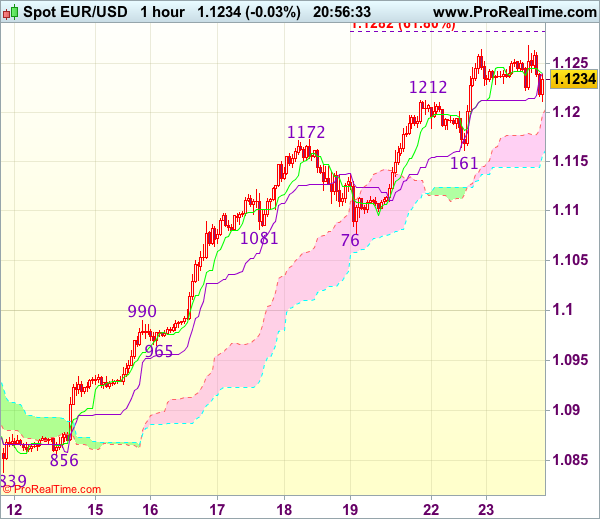
EUR/USD - 1.1232
New strategy :
Stand aside
Position : -
Target : -
Stop : -
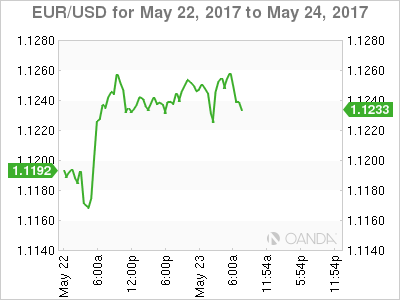
Although the single currency has maintained a firm undertone after recent rally and near term bullishness remains for recent upmove to extend gain to 1.1260-65, reckon upside would be limited to 1.1280-85 (61.8% projection of 1.0839-1.1172 measuring from 1.1076) and loss of near term upward momentum should prevent sharp move beyond 1.1300-10, risk from there is seen for a retreat later.
In view of this, would not chase this rise here and would be prudent to stand aside in the meantime. Below the Kijun-Sen (now at 1.1213) would bring pullback towards support at 1.1161 but break there is needed to signal top is formed, bring retracement of recent rise to 1.1125-30 first.
Trade Idea Update: USD/JPY – Sell at 112.05
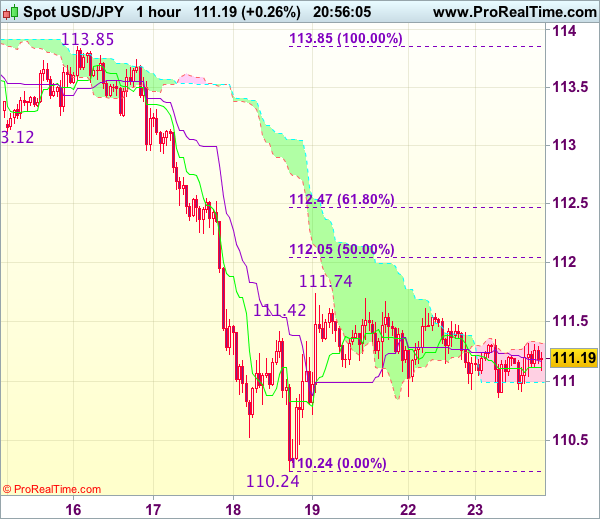
USD/JPY - 111.20
Original strategy :
Sell at 112.05, Target: 110.85, Stop: 112.40
Position : -
Target : -
Stop : -
New strategy :
Sell at 112.05, Target: 110.85, Stop: 112.40
Position : -
Target : -
Stop : -
The greenback has remained confined within near term established range and further sideways trading within this familiar range would be seen and another corrective bounce to resistance at 111.74 is likely, however, reckon upside would be limited to 112.00-05 (50% Fibonacci retracement of 113.85-110.24) and bring another decline later, below 110.70-75 would suggest the rebound from 110.24 has ended, bring retest of this level first.
In view of this, would be prudent to sell dollar on further subsequent recovery as 112.05-10 should limit upside and bring another decline. Above 112.35-40 would defer and signal low is formed instead, risk a stronger rebound to 112.65-70.
EUR Spikes Again on Eurozone Data
US futures are expected to open a little higher on Tuesday, tracking similar gains in Europe where markets have been buoyed by impressive numbers from the eurozone.
The euro is on the rise again this morning, boosted by the sentiment data from the eurozone this morning, most of which pointed to continued progress in the region. Germany in particular continues to be the main engine of growth for the region with improvements being seen across the different sectors of the economy in the first quarter, while the May sentiment figures suggest its continued into Q2.
The manufacturing sector has performed particularly well in Germany, as seen again by this morning's survey data, with exports appearing to contribute. Today's data will likely reignite the discussion on the role that the weaker euro is playing in the strength of the export sector, following Angela Merkel's claims yesterday that it's only weak due to the ECBs monetary policy. Regardless, I don't expect it to influence the central bank's decision making process as the region as a whole is not nearly as strong as its largest member.
That said, we are seeing clear improvements elsewhere which is what has triggered the belief that the ECB will likely lay out plans to further reduce is asset purchases at the end of the year and/or take steps to move end its negative interest rate policy. The PMIs from the eurozone and France this morning show that the region is going from strength to strength, although there is still plenty of other data that highlights why the ECB must proceed carefully and gradually. The euro may have rallied in response to Merkel's comments on Monday but under the circumstances I don't think the views of the German leader or Donald Trump previously will have any impact.
There's still plenty of economic data to come today, including US new home sales and PMIs, and oil inventory data from API. We'll also hear from two voting members of the FOMC, Neel Kashkari and Patrick Harker. Markets remain rather convinced that we'll see a rate hike in June, with it currently 78% priced in according to Fed Funds futures, although traders appear less so that we'll see a second by the end of the year, with it currently only priced at 42%.
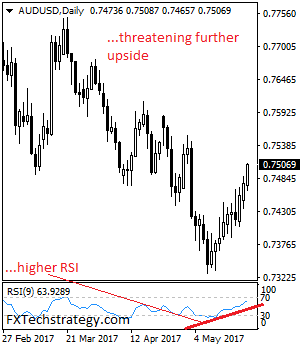
AUDUSD: Rallies Further On Bull Pressure
AUDUSD. The pair continues to retain its recovery threats strengthening strongly on Tuesday and leaving risk of price extension. On the downside, support resides at the 0.7450 level where a breach will aim at the 0.7400 level. Below that level will set the stage for a run at the 0.7350 level with a cut through here targeting further downside pressure towards the 0.7300 level. On the upside, resistance lies at the 0.7550 level. A cut through here will turn attention to the 0.7600 level and then the 0.7650 level where a violation will set the stage for a retarget of the 0.7700 level. On the whole, AUDUSD remains biased to the upside on correction.
Markets Mixed as Investors Tread Carefully
The Greenback was under pressure on Tuesday with prices finding comfort near a six-month low against a currency basket as political turmoil in Washington weighed heavily on sentiment. A growing sense of anxiety over Trump's ability to move forward with the pro-growth policies amid this uncertainty has added to the downside risks. With the soft U.S economic data compounding to an already messy mix yet again, questions have been raised over the impact this will have on the Fed hawks.
Much attention will be directed towards the pending Fed minutes on Wednesday which investors expect to provide some sort of confirmation of a rate hike in June. Although the Federal Reserve has placed itself on an aggressive hiking path this year, the combination of political instability in Washington and soft economic data could obstruct the central bank's efforts to raise rates three times this year. The rising Trump jitters are likely to influence the Federal Reserve's monetary stance in the longer term with the third pending rate hike in 2017 coming under threat.
From a technical standpoint, the Dollar remains heavily pressured on the daily charts. Repeated weakness below 97.00 should encourage a further decline towards 96.00.
Euro continues to shine
A noticeable relief from political risk in Europe has boosted the appetite for the Euro this month with prices skyrocketing to a fresh six-month high above 1.1200 as of writing. With Emmanuel Macron's market friendly victory in the French elections dealing a symbolic blow to populism, investors have redirected all their attention towards the improving economics of Europe. There is a growing possibility of the European Central Bank rattling the financial markets in the pending ECB meeting as the recent political relief invites ECB hawks. With economic data from Europe following a positive trajectory, the European Central Bank could start considering a stimulus exit at the next meeting which may strengthen the Euro further.
From a technical standpoint, a vulnerable Dollar has attributed to the upside rally on the EURUSD and has the ability to send the EURUSD towards 1.1300. A breakout above 1.1300 should provide enough encouragement for bulls to target 1.1500.
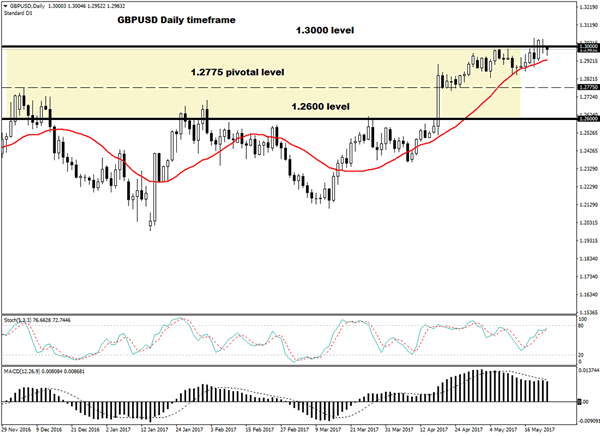
Sterling steady ahead of inflation report hearing
Sterling edged lower on Tuesday as investors remained on standby ahead of the Inflation Report Hearing at the UK Treasury Select Committee. With the repeatedly soft economic data and uncertainty over Brexit weighing on sentiment, it will be interesting to see how today's inflation report hearing plays out. A verbal battle between BoE Mark Carney and the treasury committee over Brexit and the economic outlook could spark some Sterling volatility.
The Brexit risk should limit gains on Sterling with further downside expected in the medium to longer term as the official Brexit talks and negotiations get under way. GBPUSD bears need to break back below 1.2900 to open a path lower towards 1.2775.
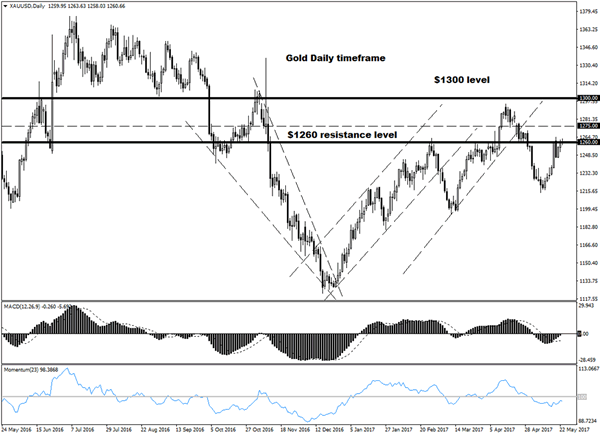
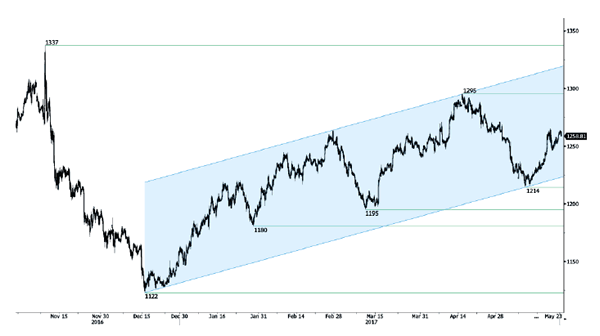
Commodity spotlight – Gold
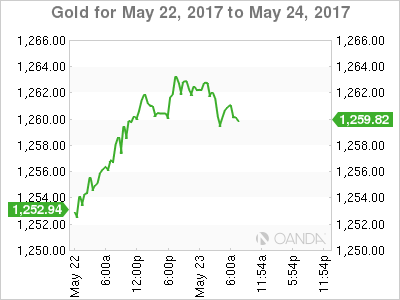
Gold edged higher on Tuesday with prices clipping above $1260 as political uncertainty in the U.S and geopolitical tensions boosted appetite for safe-haven investments. Bulls remain in control on the daily charts and should be instilled with enough inspiration to conquer $1260 this week if the Dollar continues to depreciate. Although U.S rate hike expectations may dictate where Gold trades in the longer term, short term bulls remain in firm control with further upside expected once $1260 is breached. Technical traders may exploit the decisive break and daily close above $1260 to propel prices higher towards $1275.
Trump Risk and Geopolitics Weighs on Pound, Stocks, Supports Yen
Tuesday May 23: Five things the markets are talking about
Trump risk and geopolitical concerns triggered by the U.K news overnight has investors prone to risk-aversion moves.
The yen has rallied and the pound has dropped along with stocks, as the market turns cautious after a suspect terrorist bomb attack in the U.K and the latest reports on the Trump administration.
In the U.S, political wrangling returns to the fore, taking the focus away from global economic growth. It's being reported that President Trump asked intelligence chiefs to publicly deny any collusion between his campaign and Russia.
Also, the White House is set to deliver Trump's first full budget to lawmakers later today. The plan is to cut -$3.6T in government spending over 10 years - Investors should expect fallout.
1. Stocks mixed results
Risk aversion mood has kept many investors on the sidelines overnight.
In Japan, the Nikkei stock average fell -0.1%. Its broader Topix dropped -0.2%.
In South Korea, the Kospi rallied +0.3%, while in Hong Kong, the Hang Seng fell -0.1%.
In China, the Shanghai Composite Index lost -0.5%.
The selloff of Brazilian assets has resumed, the Ibovespa index has slumped another -3.9% in overnight trading as a political crisis has returned to the country after last year's impeachment process.
In Europe, regional indices are trading modestly higher buoyed by stronger PMI and IFO data out of Europe (see below). Some positive earnings results are also adding to the sentiment.
U.S stocks are set to open in the black (+0.1%).
Indices: Stoxx50 +0.6% at 3598, FTSE +0.2% at 7509, DAX +0.3% at 12660. CAC-40 +0.7% at 5359, IBEX-35 +0.9% at 10885, FTSE MIB +0.6% at 21449, SMI -0.4% at 9049, S&P 500 Futures +0.1%
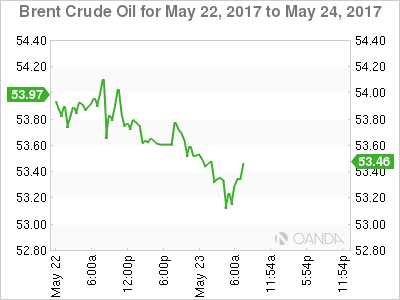
2. Oil prices fall on White House proposal to sell U.S oil reserves, gold unchanged
Ahead of the U.S open, oil prices are under pressure, weighed down by Trump's plan to sell off half of the U.S's stockpile, threatening a future and further "glut" despite OPEC trying to tighten the market.
Brent crude has ended a run of four consecutive session gains to trade -36c lower at +$53.51 per barrel. U.S. light crude (WTI) is down -33c at +$50.80.
Note: The White House plans to sell -50% of its oil stockpile from 2018 to 2027 to raise +$16.5B to help balance the budget. The budget is to be delivered to Congress today.
OPEC meet on Thursday, May 25 and are expected to extend the period of their pledge to cut output by -1.8m bpd from just the first half of this year to all of 2017 and the first quarter of 2018.
Note: Yesterday, Kuwait's oil minister said 'not' all OPEC countries and allies were on board for a nine-month extension and producers would discuss this week whether to extend output cuts by six or nine months.
Gold prices are little changed (+$1,259.49 per ounce) despite the geopolitical events overnight. President Trump controversies and a weaker USD have been providing the yellow metal support over the past week.
Note: Spot gold advanced +2.2% last week over Trump's alleged links to Russia and his firing of former FBI chief James Comey raised concerns about his ability to push through promised fiscal stimulus.
3. U.S debt supply to back up yields
This week's U.S Treasury debt supply is expected to back up U.S yields a tad. Today, there is +$26B sale of two-year notes is due, followed by +$34B five-year notes tomorrow and +$28B sale of seven-year notes Thursday.
Ahead of the U.S open, 10's are trading at +2.24%. U.S yield have been under pressure by political worries out of D.C. that is deflating investors' optimism towards a rollout of large fiscal stimulus this year.
Note: The Fed's minutes for May are due tomorrow afternoon. The market will focus on clues about the pace of interest-rate increases as well as discussions about how to wind down the Fed's balance sheet.
Currently, fed funds show a +79% chance that the Fed would raise short-term interest rates at its June 13-14 meeting - the odds was at +74% on Friday and +51% a month ago.
Elsewhere, yields on Aussie debt lost -4 bps to +2.45%, while German bunds slipped -1 bps, France and the U.K fell -2 bps.
4. U.S dollar losing its luster
The EUR/USD (€1.1258) trades atop of its six-month high aided by yesterday's comments from German Chancellor Merkel reiterating that the large German surpluses are being "aided by a weak EUR currency." Other regional data (see below) this morning is also providing the single unit support.
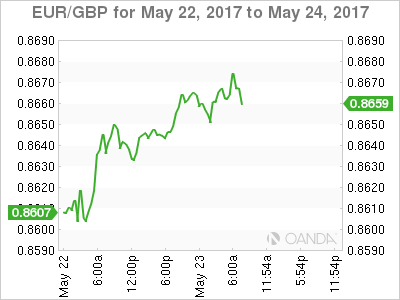
The pound (£1.2988) is off its overnight highs on the terror incident in Manchester, but still within reach of the psychological £1.3000 handle. However, to many, £1.3000 is considered the key pivot and with any momentum through theses levels expect the structural shorts out there post-Brexit will be looking to wind back. Short-term sterling bulls are now targeting £1.3350/1.3400.
JPY (¥111.14) has befitted from safe-haven flows following the U.K terror incident.
5. Eurozone composite PMI stronger than expected
Data this morning showed that the composite PMI for the eurozone was slightly stronger than expected in May, with an unchanged reading of 56.8 comparing to a consensus forecast for a slight drop to 56.6.
Digging deeper, it's a six-year high and points to robust growth in Q2. Most of the support comes from France and Germany, both of which recorded significant increases, while other economies slowed.
The surveys also pointed to a possible weakening of activity in coming months, with new orders at their lowest for four-months. Inflationary pressures have also eased slightly.
DAX Edges Higher As German GDP, Business Climate Impresses
The DAX index has edged upwards on Tuesday, reversing the losses which marked the Monday session. Currently, the DAX is trading at 12,679.50 points. On the release front, German and eurozone numbers were solid. German Final GDP posted a gain of 0.6%, matching the forecast. There was positive news from the manufacturing sector, as German and Eurozone Manufacturing PMIs beat their estimates. As well, German Ifo Business Climate rose to 114.6, easily beating the estimate of 113.1 points.
Germany's economy continues to perform well, and this has meant stronger growth for the euro-area. German numbers continue to impress. Final GDP for the first quarter remained at a respectable 0.6%, unchanged from the Preliminary GDP reading. The Ifo Business Climate report sparkled, climbing to 114.6, marking its highest level since 1991. As well, the manufacturing sector continues to expand, as German Manufacturing PMI improved to 59.4, its highest reading since February 2011. Exports and manufacturing propelled the economy in the first quarter, and these sectors should remain strong, so we can expect strong economic expansion in the second quarter as well. The strong manufacturing numbers in Germany have also boosted eurozone numbers, as the manufacturing sector continues to expand. Eurozone Manufacturing PMI climbed to 57.0 in April, the ninth straight month that the indicator has improved.
Greece hasn't been in thee headlines for quite some time, but that could change. EU finance ministers met on Monday, and a key issue was debt relief for Greece. However, the ministers could not reach an agreement, and opted to try and hammer out an agreement at the June meeting. The uncertainty caused by the delay will only exacerbate concerns about the fragile Greek economy. Greece has undergone a severe austerity plan and understandably, the Greek government is reluctant to adopt further painful measures. Greece could be headed on a collision course with the EU, if the latter insists that the further reforms are needed. German Finance Minister Wolfgang Schaeuble praised the reforms implemented by Greece as “remarkable”, but insisted that Greece must take further steps before the EU provides further financial aid. Greek's debt woes once resulted in the country almost leaving the eurozone, and if the EU holds up aid, the euro could lose ground.
Euro Ticks Higher As German GDP Matches Forecast
The euro has edged higher in the Tuesday session, as EUR/USD is currently trading at 1.1250. In economic news, it's a very busy day in the Eurozone. German Final GDP posted a gain of 0.6%, matching the forecast. There was positive news from the manufacturing sector, as German and Eurozone Manufacturing PMIs beat their estimates. German Ifo Business Climate rose to 114.6, easily beating the estimate of 113.1 points. In the US, today's highlight is US New Home Sales, which is expected to drop to 611 thousand.
German numbers continue to impress, and a strong German economy has helped lift up the eurozone economy, which hasn't looked this strong in years. German Final GDP for the first quarter remained at 0.6%, unchanged from the Preliminary GDP reading. The Ifo Business Climate report sparkled, climbing to 114.6, marking its highest level since 1991. As well, the manufacturing sector continues to expand, as German Manufacturing PMI improved to 59.4, its highest reading since February 2011. Exports and manufacturing propelled the economy in the first quarter, and these sectors should remain strong, so we can expect strong economic expansion in the second quarter as well. Eurozone numbers are likewise pointing to expansion, as reflected in the manufacturing sector. Eurozone Manufacturing PMI also impressed at 57.0, the ninth straight month that is has improved.
EU finance ministers met on Monday, and a key issue was debt relief for Greece. However, the ministers could not reach an agreement, and opted to try and hammer out an agreement at the June meeting. The uncertainty caused by the delay will only exacerbate concerns about the fragile Greek economy. Greece has undergone a severe austerity plan and understandably, the Greek government is reluctant to adopt further painful measures. However, Greece could be headed on a collision course with the EU, if the latter insists that the further reforms are needed. German Finance Minister Wolfgang Schaeuble praised the reforms implemented by Greece as “remarkable”, but insisted that Greece must take further steps before the EU provides further financial aid. Greek's debt woes once resulted in the country almost leaving the eurozone, and if the EU holds up aid, the euro could lose ground.
GOLD Medium-Term Bullish, SILVER Short-Term Bullish, CRUDE OIL Positive Technical Structure.
GOLD Medium-term bullish
Gold seems on its way back up. Hourly support is located at 1246 (18/05/2017 low). Stronger support is given at 1195 (10/03/2017 low). Expected to show further upside pressures.
In the long-term, the technical structure suggests that there is a growing upside momentum. A break of 1392 (17/03/2014) is necessary ton confirm it, A major support can be found at 1045 (05/02/2010 low).
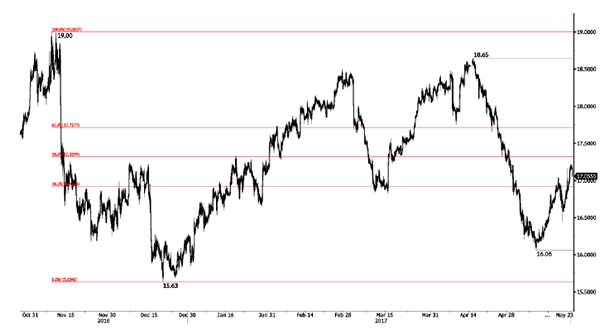
SILVER Short-term bullish.
Silver increases. Strong support is given at 15.63 (20/12/2017 low). Closest support is given at 16.20 (04/05/2017 low). Key resistance is given at a distance at 19.00 (09/11/2017 high). Expected ton increase until 50% Fibonacci retracement around 17.30.
In the long-term, the death cross indicates that further downsides are very likely. Resistance is located at 25.11 (28/08/2013 high). Strong support can be found at 11.75 (20/04/2009).
CRUDE OIL Positive technical structure.
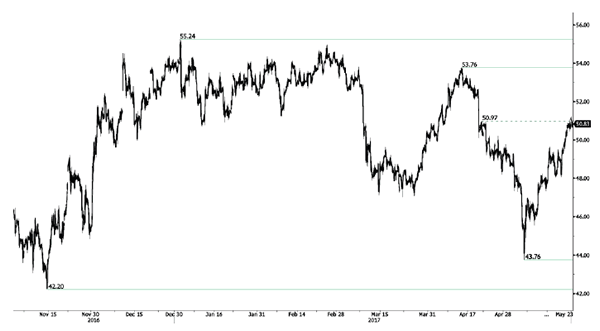
Crude oil continues to bounce on shortsqueeze move. Support is given at a distance 43.76 (05/05/2017 low). Demand is very strong and the road is wide-open for further increase.
In the long-term, crude oil has recovered after its sharp decline last year. However, we consider that further weakness are very likely. Strong support lies at 24.82 (13/11/2002) while resistance can now be found at 55.24 (03/01/2017 high).