
Sample Category Title
Trade Idea Wrap-up: USD/CHF – Sell at 0.9870
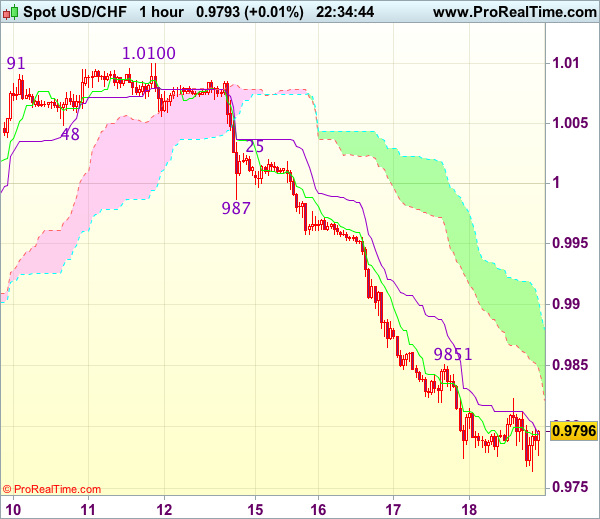
USD/CHF - 0.9796
Most recent candlesticks pattern : N/A
Trend : Near term down
Tenkan-Sen level : 0.9794
Kijun-Sen level : 0.9794
Ichimoku cloud top : 0.9903
Ichimoku cloud bottom : 0.9848
Original strategy :
Sell at 0.9870, Target: 0.9770, Stop: 0.9905
Position : -
Target : -
Stop : -
New strategy :
Sell at 0.9870, Target: 0.9770, Stop: 0.9905
Position : -
Target : -
Stop : -
As dollar has recovered after intra-day marginal fall to 0.9764, suggesting minor consolidation above this level would be seen and recovery to 0.9850 cannot be ruled out, however, reckon 0.9870 would limit upside and bring another decline later, below said support at 0.9774 would extend early selloff from 1.0344 top towards 0.9735-40 (76.4% retracement of 0.9550-1.0344), however, near term oversold condition should prevent sharp fall below 0.9700, risk from there is seen for a rebound to take place later.
In view of this, would not chase this fall here and would be prudent to sell dollar on recovery as 0.9870 should limit upside. Above 0.9900 would defer and risk rebound to 0.9925-30 but upside should be limited to 0.9950 and price should falter well below previous support at 0.9987, bring another decline.
Trade Idea Wrap-up: GBP/USD – Buy at 1.2945
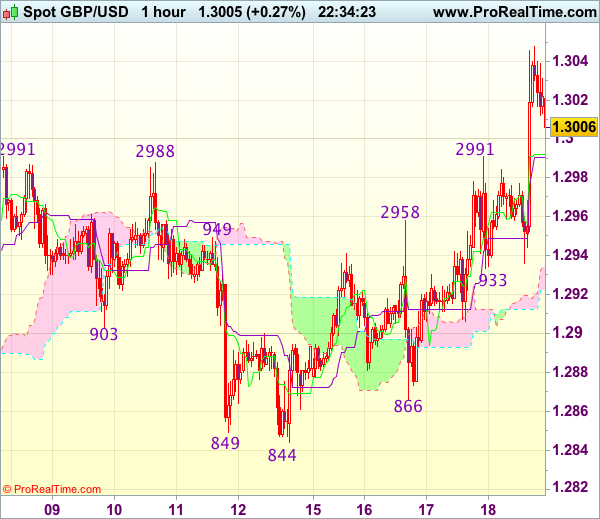
GBP/USD - 1.3006
Most recent candlesticks pattern : N/A
Trend : Near term up
Tenkan-Sen level : 1.2992
Kijun-Sen level : 1.2991
Ichimoku cloud top : 1.2934
Ichimoku cloud bottom : 1.2922
Original strategy :
Buy at 1.2945, Target: 1.3045, Stop: 1.2910
Position : -
Target : -
Stop : -
New strategy :
Buy at 1.2945, Target: 1.3045, Stop: 1.2910
Position : -
Target : -
Stop : -
Cable’s intra-day rally above indicated psychological resistance at 1.3000 confirms recent upmove has resumed and bullishness is seen for further gain to 1.3050, then 1.3075-80, however, near term overbought condition should prevent sharp move beyond 1.3100-10, risk from there has increased for a retreat to take place later.
In view of this, would not chase this rise here and would be prudent to buy cable on pullback as support at 1.2933 should limit downside and bring another upmove. Below 1.2900-10 would abort and signal top is formed instead, bring weakness towards support at 1.2866, however, price should stay above said support at 1.2844.
Trade Idea Wrap-up: EUR/USD – Buy at 1.1055
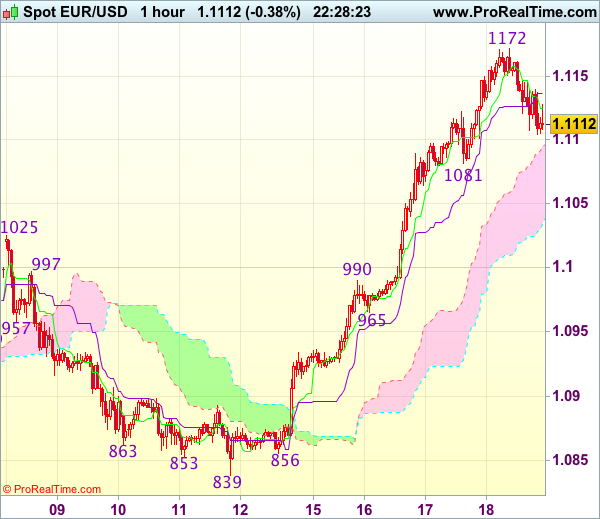
EUR/USD - 1.1112
Most recent candlesticks pattern : N/A
Trend : Near term up
Tenkan-Sen level : 1.1125
Kijun-Sen level : 1.1137
Ichimoku cloud top : 1.1095
Ichimoku cloud bottom : 1.1035
Original strategy :
Buy at 1.1065, Target: 1.1185, Stop: 1.1030
Position : -
Target : -
Stop : -
New strategy :
Buy at 1.1055, Target: 1.1155, Stop: 1.1020
Position : -
Target : -
Stop : -
As the single currency has eased after rising to 1.1172, suggesting minor consolidation would be seen and pullback to 1.1100 and possibly support at 1.1081 cannot be ruled out, however, reckon 1.1055-65 would limit downside and bring another rise later, above said resistance at 1.1172 would extend recent rise towards 1.1205-10 (1.618 times projection) but reckon 1.1250 would hold from here, bring retreat later.
In view of this, would not chase this rise here and we are looking to buy euro on pullback as 1.1065-70 should limit downside. Below previous resistance at 1.1025 (now support) would defer and suggest top is possibly formed instead, risk test of another previous resistance at 1.0990 first.
Trade Idea : USD/JPY – Sell at 112.05
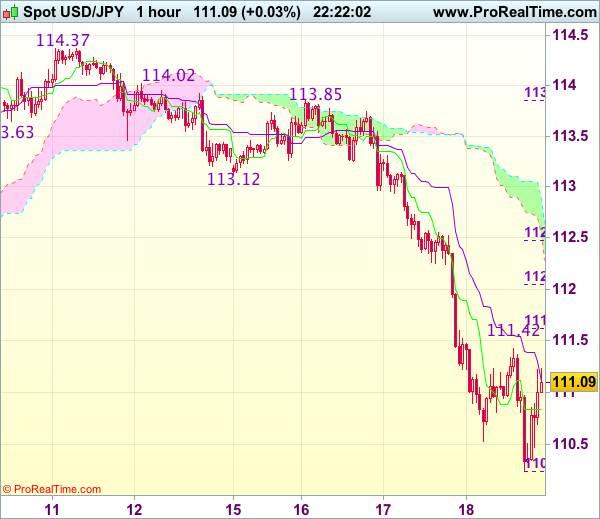
USD/JPY - 111.27
Most recent candlesticks pattern : N/A
Trend : Near term down
Tenkan-Sen level : 110.83
Kijun-Sen level : 111.10
Ichimoku cloud top : 112.89
Ichimoku cloud bottom : 112.54
Original strategy :
Sell at 111.85, Target: 110.45, Stop: 112.20
Position : -
Target : -
Stop : -
New strategy :
Sell at 112.05, Target: 110.85, Stop: 112.40
Position : -
Target : -
Stop : -
As the greenback has recovered again after falling to 110.24, suggesting consolidation above this level would be seen and test of resistance at 111.42 cannot be ruled out, however, reckon upside would be limited to 111.75-85 and renewed selling interest should emerge around 112.05 (50% Fibonacci retracement of 113.85-110.24), bring another decline, below said support at 110.24 would extend selloff from 114.37 top to 110.00 but loss of near term downward momentum should prevent sharp fall below 109.70-75, bring rebound later.
In view of this, would not chase this fall here and would be prudent to sell dollar on subsequent recovery as 112.05-10 should limit upside and bring another decline. Above 112.35-40 would defer and signal low is formed instead, risk a stronger rebound to 112.65-70.
Dollar More Resilient Even if Sentiment Remains Fragile
The European equity sell-off resumed at today's opening, but found a bottom around noon. There was a tentative attempt to fight back going into the US session, but the outcome is still uncertain. US equities open marginally negative.
Warmer weather and a late Easter encouraged UK shoppers to return to the high street in April, with retail sales rebounding strongly. Total retail sales excl. auto fuel increased by 2% M/M and 4.5% Y/Y. The results were much better than economists had forecast – analysts had expected a monthly increase of 1%.
ECB chief economist Peter Praet warned his colleagues to tread with caution when publicly discussing plans the bank has to wind down its stimulus measures, according to the minutes of the latest ECB meeting. "Any substantial change in communication needed to be motivated by some more evidence that the present indications of acceleration of activity found confirmation in hard data and fed through to an adjustment in inflation."
The UK Conservatives' lead over the Labour party has fallen to its lowest level of the election campaign so far, according to the first major poll carried out since Labour launched its manifesto this week. The Conservatives were still comfortably ahead, however, with 49% of respondents supporting May's party.
News of a bribery scandal engulfing Brazilian president Michel Temer last night hit the country's assets, as investors take cover against a fresh corruption crisis which threatens to pierce the country's tentative return to political stability. The Brazilian real suffers a 8% blow against the dollar.
US initial claims fell to 232K from 236K previously, defying expectations for a rise. It is one of the lowest observations of the past decades and suggests ongoing labour market strength. The Philly Fed business survey defied expectations for a deterioration of conditions. The headline rebounded to a very high 38.8 from 22 previously, re-approaching the 30-yr high reached in February (43.30).
Rates
Core bond rally slows, as no new info is available.
Global core bonds continue to profit from the risk aversion which continued to dominate trading today, even if the movements slowed. European equities declined mainly in the morning session. In the afternoon, Bunds traded sideways, as equities bottomed and even regained some slight ground ahead of the US open. There was evidence of various contacts between Trump's campaign team and Russia, but no evidence yet about wrongdoing according to some officials. That wasn't enough for bonds to keep yesterday's strong pace of advance intact though.
At the time of writing, US yields are narrowly mixed between +1.4 bps (2-yr) and -3.1 bps (30-yr) flattening the curve. The German yield curve bull flattens with yields 0.6 bps (2-yr) to 3.6 bps (30-yr) lower. On intra-EMU bond markets, 10-yr peripheral yield spreads versus Germany widened by 2 to 4 bps, with Greece underperforming (+11bps).
Intraday, the Bund opened strong and rallied once equities resumed their sell-off after the European open. French labour market data were surprisingly strong (Q1), confirming the catching up the French economy is making since a few quarters. However, core bonds were driven not by data, but by risk sentiment. Once equities bottomed at noon, Bunds topped and started trading sideways. US Treasuries followed Bunds higher in the European morning session, but eased in early US trading, which was reinforced by the strong data. Initial claims dropped instead of the expected increase and the Philly Fed business confidence printed very strong. US Treasuries finally settled around yesterday's closing levels.
Currencies
Dollar more resilient even if sentiment remains fragile
Global markets stayed in risk-off mode today as the Trump correction continued. However, the risk-off trade had no additional negative impact on the dollar. Interest rate differentials turned slightly in favour of USD. The US eco data were better than expected. EUR/USD traded off the overnight top and hovers in the low 1.11 area. USD/JPY rebounds to the 110.50/111.00 area even as US equities struggle to prevent further losses.
Overnight, Asian equity losses were modest given yesterday's sharp decline in the US. USD/JPY touched a correction low near 110.55, but rebounded to the 11.20 area at the start in Europe. EUR/USD showed a similar picture. The pair touched a minor top around 1.1172, but returned to the 1.1150 area.
With few eco data on the agenda in Europe, the only relevant question for global trading was whether the risk-off trade would continue. European equities opened only marginally lower despite a poor close in the US yesterday. However, the selling of risky assets resumed and European equity indices soon showed additional losses of around 1%. Contrary to what was the case yesterday, the dollar stayed away from the overnight lows against the euro and the yen. Interest rate differentials between the dollar and the euro settled north of yesterday's lows, giving the US currency some downside protection. EUR/USD hovered sideways in the lower half of the 1.11 big figure. USD/JPY stabilized in the mid 110 area. The dollar entered calmer waters.
The US jobless claims and the Philly Fed survey were strong. Especially the Philly Fed survey printed at a historically very high level, easing concerns on an imminent slowdown in the US. The dollar gained slightly further ground after the publication of the release. This afternoon, there were also plenty of headlines on the political crisis in Brazil. Of late, the dollar wasn't in a very good position to play a safe haven role. However a crisis in Brazil maybe still cause some buying interest for the US currency in the American region. Whatever the reason, risk sentiment remains very fragile but the dollar was much more resilient than yesterday. EUR/USD trades currently in the 1.1110 area. USD/JPY changes hands in the 111 area.
Sterling rebounds on impressive retail sales
Sterling didn't profit from a good labour market report yesterday. Today's reaction to the April retail sales was different. The rebound in April sales was much bigger than expected at 2.3% M/M and 4.0% Y/Y. March sales were also less negative than initially reported. The report eased recent fears (which were also mentioned by the BoE) that a decline in real income due to higher inflation could weigh on domestic spending. The report was a good reason for markets to rectify the recent sterling underperformance. EUR/GBP dropped from the 0.86 area to fill bids around 0.8525. Cable finally cleared the 1.30 barrier and came close to the 1.3050 area. The pair trades currently in the 1.3020 area as pressure on the dollar is slightly easing. ST consolidation in EUR/USD currently prevents an intraday rebound in EUR/GBP. The pair holds in the 0.8540 area.
Technical Outlook: FTSE Remains Firmly in Red
FTSE remains firmly in red for the second consecutive day on Thursday and extends pullback from all-time high at 7497 which FTSE contract for June delivery hit on Tuesday after nine straight days of rally. Political crisis that broke in the US weighed on UK's benchmark index which dipped to 7371 on Thursday, finding temporary footstep just above strong support at 7365, provided by rising daily Tenkan-se and Fibo 38.2% of 7143/7497 bull-leg). Pullback should be ideally contained here, according to the wave principles, as the price is currently riding on the fourth, corrective wave of five-wave ascend from 7032 (19 Apr low). However, deeper correction cannot be ruled out as daily RSI and slow stochastic reversed from overbought territory and show plenty of room at the downside. Loss of 7365 support could extend correction towards next supports at 7320 and 7280 (Fibo 50% and 61.8% of 7143/7497 rally) respectively.
Res: 7419; 7443; 7460; 7497
Sup: 7365; 7320; 7280; 7267
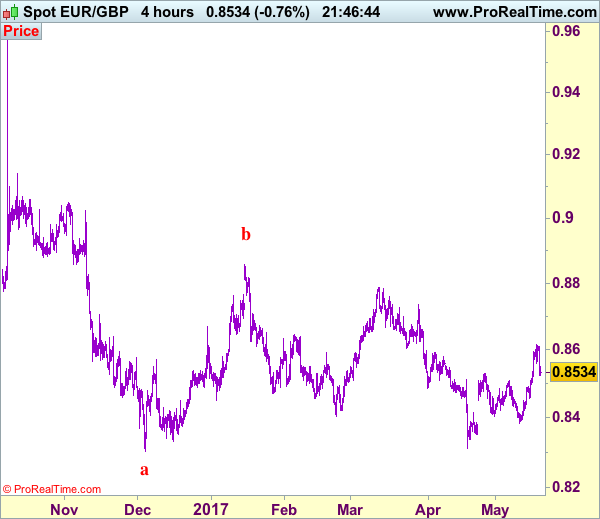
Trade Idea: EUR/GBP – Hold long entered at 0.8530
EUR/GBP - 0.8533
Recent wave: Major double three (A)-(B)-(C)-(X)-(A)-(B)-(C) is unfolding and 2nd (A) has possibly ended at 0.6936.
Trend: Near term down
Original strategy :
Bought at 0.8530, Target: 0.8630, Stop: 0.8490
Position : - Long at 0.8530
Target : - 0.8630
Stop : - 0.8490
New strategy :
Hold long entered at 0.8530, Target: 0.8630, Stop: 0.8490
Position : - Long at 0.8530
Target : - 0.8630
Stop : - 0.8490
Although the single currency has retreated after rising to 0.8615 yesterday and consolidation below this level would be seen, reckon downside would be limited to 0.8505-10 and bring rebound later, above 0.8595 would bring retest of 0.8615, break there would signal the erratic rise from 0.8312 low has resumed and extend gain to 0.8630, having said that, as this move is viewed as retracement of recent decline, reckon upside would be limited to 0.8650-60, risk from there is seen for a retreat later.
In view of this, we are holding on to our short position entered at 0.8530. Below 0.8500-05 would defer and suggest top is possibly formed, bring weakness to support at 0.8457 but break of previous resistance at 0.8452 is needed to confirm and bring test of support at 0.8423 first.
Our preferred count is that, after forming a major top at 0.9805 (wave V), (A)-(B)-(C) correction is unfolding with (A) leg ended at 0.8400 (A: 0.8637, B: 0.9491 and 5-waver C ended at 0.8400. Wave (B) has ended at 0.9413 and impulsive wave (C) has either ended at 0.8067 or may extend one more fall to 0.8000 before prospect of another rally. Current breach of indicated resistance at 0.9043 confirms our view that the (C) leg has ended and bring stronger rebound towards 0.9150/54, then towards 0.9240/50.
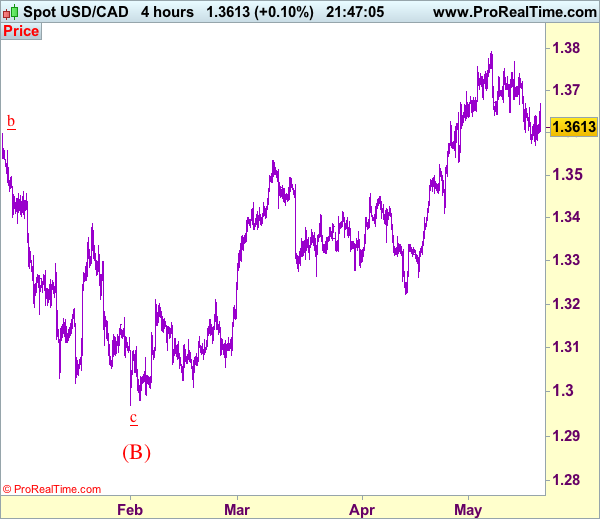
Trade Idea: USD/CAD – Buy at 1.3535
USD/CAD - 1.3615
Recent wave: Only wave v of c has ended at 0.9407 and wave C of major A-B-C correction is underway for headway to 1.4700
Trend: Near term up
Original strategy :
Buy at 1.3535, Target: 1.3735, Stop: 1.3475
Position: -
Target: -
Stop: -
New strategy :
Buy at 1.3535, Target: 1.3735, Stop: 1.3475
Position: -
Target: -
Stop:-
As the greenback has retreated after meeting resistance at 1.3670, retaining our view that further sideways trading would be seen and near term downside risk remains for the fall from 1.3794 top to bring retracement of recent rise, hence weakness to 1.3570 is likely, however, reckon downside would be limited to support at 1.3530 and bring rebound later, above 1.3670 would bring another bounce to 1.3700 but break of 1.3740-45 is needed to signal the pullback from recent high at 1.3794 has ended, bring test of 1.3770 resistance first, then towards 1.3794. Looking ahead, only a break above there would confirm recent upmove has resumed and extend further gain to 1.3840-50, then towards 1.3900.
In view of this, would not chase this rise here and would be prudent to buy again on pullback as 1.3530-35 should limit downside and bring another rise later. A firm break below 1.3530 would abort and suggest a temporary top is formed, bring retracement of recent upmove to 1.3500 and later towards 1.3450-60 but support at 1.3411 should remain intact, bring another upmove later.
To recap, wave B from 1.3066 is unfolding as an a-b-c and is sub-divided as a: 1.2192, b: 1.2716 and wave c is a 5-waver with i: 1.1983, ii: 1.2506, extended wave iii with minor iii at 1.0206, wave iv ended at 1.0781 and wave v as well as wave iii has ended at 0.9931, hence the subsequent choppy trading is the wave iv which is unfolding as (a)-(b)-(c) with (a) leg of iv ended at 1.0854, followed by (b) leg at 1.0108 and (c) leg as well as the wave iv ended at 1.0674. The wave v is sub-divided by minor wave (i): 0.9980, (ii): 1.0374, (iii): 0.9446, (iv): 0.9913 and (v) as well as v has possibly ended at 0.9407, therefore, consolidation with upside bias is seen for major correction, indicated target at 1.3700 and 1.4000 had been met and further gain to 1.4700 would be seen later.
NZD/USD Tests Downtrend Line Resistance
NZD/USD has seen a substantial 6.22% retracement since February 7.
Since the end of April, the downtrend has held above a significant support line at 0.6800, suggesting the bearish momentum has been waning.
The price further broke the next psychological level at 0.6900 on Wednesday, as a result of the weakening of USD caused by Trump's Russia leak scandal.
On the daily chart, NZD/USD bulls are currently testing the mid-term major downtrend line resistance.
If the trend line is broken, we can expect that the price will go further up.
Conversely, if the bulls fail to break the resistance, we will likely see a pullback.
The resistance level is at 0.6950, followed by 0.6970 and 0.7000.
The support line is at 0.6900, followed by 0.6870 and 0.6840.
CAC Slips as Trump’s Troubles Cast Pall on Markets
The CAC index has headed lower in the Thursday session. Currently, the CAC is trading at 5264.50, down 1.11 percent. It's a quiet day on the release front, with no French or eurozone events on the schedule. The president of the ECB, Mario Draghi, will speak at an event at the University of Tel Aviv. On Friday, the eurozone publishes current account and consumer confidence.
The political uncertainty which has gripped Washington seems to be growing by the hour, and predictably, global stock markets have responded to the crisis with losses. Faced with mounting criticism from Democrats and even some Republicans, the Justice Department has agreed to appoint a former FBI director as independent counsel to investigate possible Russian involvement in the US presidential election as well as any connection between Trump and the Russians during the election campaign. The Trump administration is in damage control mode, as the media is having a field day with bombshell reports. On Tuesday, reports surfaced that Trump had asked former FBI director James Comey to close an investigation into ties between Russia and Trump's former security adviser, Michael Flynn, leading some lawmakers to question whether Trump had committed obstruction of justice. As if this wasn't enough for Trump's aides to deal with, the president is under fire for passing classified intelligence to the Russian foreign minister. Trump initially denied the claim, but has since admitted that he did share intelligence with the Russians, arguing that he had acted within his rights. With the Trump administration frantically trying to douse political fires, investors are concerned that Trump will have more difficulty passing into law his plans for increased stimulus and tax reform.
The markets were on the money in their predictions of Eurozone GDP and and CPI data. Final CPI matched the forecast with a strong gain of 1.9% in April, considerably higher than last month's gain of 1.5%. Eurozone inflation is closing in on the ECB's target of 2.0%, which could increase pressure on the ECB to consider tapering its ultra-loose monetary policy. Germany, for one, is not pleased with the ECB's ultra-loose monetary stance, which it says is not suited to the strong economic conditions in the country. On Tuesday, Eurozone Flash GDP was unrevised from the April forecast, posting a gain of 0.5% in the first quarter. The eurozone continues to show improved numbers in 2017, boosted in no small part by the German economy, which expanded 0.6% in the first quarter.