Sample Category Title
DAX Slides On Concerns Over Fed’s Rate Projection
The DAX Index is steady in the Wednesday session, after considerable losses on Tuesday. Currently, the DAX is at 11,896.50. On the release front, there are no major economic indicators out of Europe. On Thursday, Germany publishes GfK Consumer Climate and the Eurozone releases Consumer Confidence.
European and US stock markets headed south on Tuesday, as investors have given a thumb-downs to the Federal Reserve, which has indicated that it plans to raise rates just two more times in 2017. This was apparent in the Fed's dot point plot as well as last week's rate statement. On Monday, FOMC member Charles Evans reiterated this stance, saying that he expected another two more rate hikes this year. Although three rate hikes in 2017 would be no mean feat, the markets would prefer four hikes, given the strong performance of the US economy. The Fed's cautious approach sent the DAX lower on Tuesday, but the euro took the opposite direction, punching above the 1.08 line and hitting 7-week highs against the dollar. With a lack of key fundamentals this week, the markets are focusing on comments from FOMC members who will be speaking this week, including Fed Chair Janet Yellen on Thursday.
In the Netherlands, Prime Minister Mark Rutte comfortably won last week's election, defeating far-right candidate Geert Wilders, a euro-sceptic. Next stop on the election train is France, which holds presidential elections next month. Polls have far rightist Marine Le Pen and centrist Emmanuel Macron running neck-and-neck in the first round of the presidential election on April 23. Still, Macron is expected to win in the second-round vote in May. In a highly-anticipated television debate on Monday, Macron and Le Pen had a chance to hawk their wares, and a survey found that Macron won the debate. Le Pen, leader of the far-right, has pledged to take France out of the eurozone and hold a referendum on EU membership. Macron's strong showing in the debate has improved market sentiment and helped boost the euro on Tuesday. France boasts the number two economy in the eurozone, so we can expect more volatility from the euro as we get closer to Election Day.
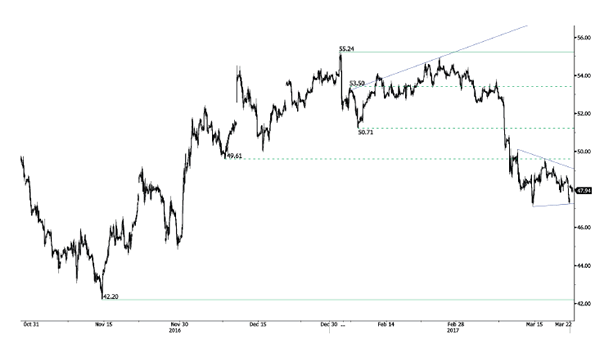
CRUDE OIL – Weakens, Extends Bear Pressure
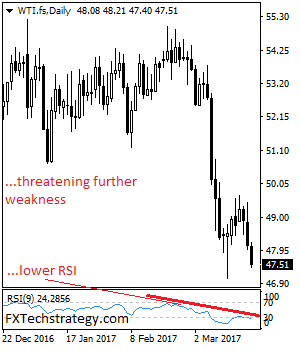
CRUDE OIL - The commodity extend its Tuesday losses on Wednesday opening the door for more declines. On the downside, support resides at the 47.00 level where a break will expose the 46.00 level. A cut through here will set the stage for a run at the 45.00 level. Further down, support resides at the 44.00 level. Its daily RSI is bearish and pointing lower supporting this view. On the upside, resistance resides at the 48.00 level. Further out, resistance comes in at the 49.00 level. A break above here will aim at the 50.00 level and then the 51.00 level followed by the 52.00 level. All in all, CRUDE OIL remains biased to the downside short term.
EUR/USD – Euro Slips On Soft Current Account
.
EUR/USD has lost ground on Wednesday, paring the strong gains which marked the Tuesday session. Currently, the pair is trading at the 1.0760. On the release front, there are no major economic indicators out of Europe or the US. In the eurozone, January’s current account surplus slipped to EUR 24.1 billion, well off the forecast of EUR 29.3 billion. This marked the lowest surplus since July 2016. In the US, today’ highlight is Existing Home Sales, which is forecast to drop to 5.59 million. On Thursday, the US releases Unemployment Claims, and Fed Chair Janet Yellen will speak at an event in Washington, D.C.
With a lack of key fundamentals this week, the markets are focusing on comments from FOMC members who will be speaking this week, including Fed Chair Janet Yellen on Thursday. On Monday, Chicago Fed President Charles Evans said he expects the Fed to raise rates two more times this year. This echoes the Fed’s dot point plot as well as last week’s rate statement. Although three rate hikes in 2017 would be no mean feat, the markets would like four hikes, given the strong performance of the US economy. The Fed’s cautious approach disappointed the markets, as the US dollar has posted broad losses since last week. The euro has taken full advantage, as EUR/USD punched above the 1.08 line on Tuesday and hit 7-week highs.
In the Netherlands, Prime Minister Mark Rutte comfortably won last week’s election, defeating far-right candidate Geert Wilders, a euro-sceptic. Next stop on the election train is France, which holds presidential elections next month. Polls have far rightist Marine Le Pen and centrist Emmanuel Macron running neck-and-neck in the first round of the presidential election on April 23. Still, Macron is expected to win in the second-round vote in May. In a highly-anticipated television debate on Monday, Macron and Le Pen had a chance to hawk their wares, and a survey found that Macron won the debate. Le Pen, leader of the far-right, has pledged to take France out of the eurozone and hold a referendum on EU membership. Macron’s strong showing in the debate has improved market sentiment and helped boost the euro on Tuesday. France boasts the number two economy in the eurozone, so we can expect more volatility from the euro as we get closer to Election Day.
Gold Continued Increase, Silver Consolidating After Friday Gains, Crude Oil Bearish Momentum
Gold Continued increase.
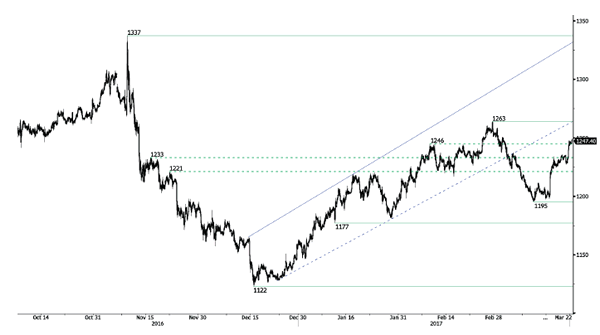
Gold has risen sharply, nearly invalidating the bearish short-term outlook. The momentum seems back to bullish. Key resistance is located at 1263 (27/02/2017 high). Hourly support can be found at 1224.10 (16/03/2017 low).
In the long-term, the technical structure suggests that there is a growing upside momentum. A break of 1392 (17/03/2014) is necessary ton confirm it, A major support can be found at 1045 (05/02/2010 low).
Silver Consolidating after Friday gains..
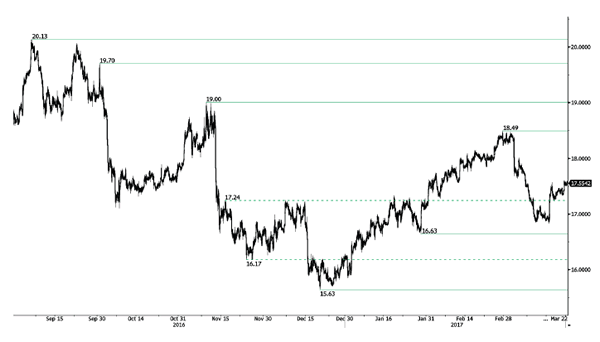
Silver rose sharply Friday, invalidating the bearish outlook linked to the previous bearish pause. Correct pullback has failed to find seller indicating test of 17.56 resistance (16/03/2017 high). Strong support is given at 16.84 (27/01/2016 low).
In the long-term, the death cross indicates that further downsides are very likely. Resistance is located at 25.11 (28/08/2013 high). Strong support can be found at 11.75 (20/04/2009).
Crude oil Bearish momentum.
Crude oil's bearish pressures continues despite correct bounce due to a short-squeeze. The commodity had been unable to mount a serious challenge to resistance at 49.61 (08/12/2017 low) hourly support given at 47.09 (016/03/2017 low) Expected to see deeper selling pressures.
In the long-term, crude oil has recovered after its sharp decline last year. However, we consider that further weakness are very likely. Strong support lies at 24.82 (13/11/2002) while resistance can now be found at 55.24 (03/01/2017 high).
EUR/CHF Selling Pressures Are Lively, EUR/JPY Back To Bearish, EUR/GBP Continued Weakness But…
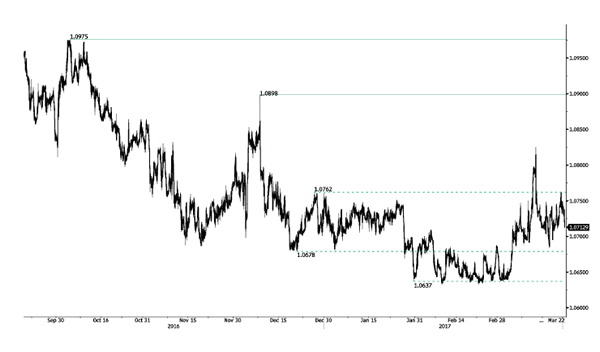
EUR/CHF Selling pressures are lively.
EUR/CHF's is moving up and down. The medium-term pattern suggests us to see continued bearish pressures towards key support that can be found at 1.0623 (24/06/2016 low).
In the longer term, the technical structure is mixed. Resistance can be found at 1.1200 (04/02/2015 high). Yet,the ECB's QE programme is likely to cause persistent selling pressures on the euro, which should weigh on EUR/CHF. Supports can be found at 1.0184 (28/01/2015 low) and 1.0082 (27/01/2015 low).
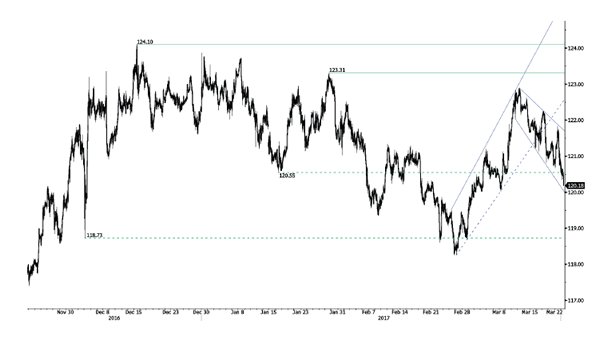
EUR/JPY Back to bearish.
EUR/JPY rejection at 122.88 has triggered a correction. Yet, the pair is very volatile. Hourly support at 120.55 (17/01/2017 low) has been broken. Another support lies at 120.02 (08/03/2017 low). Resistance stands at 122.88 (13/03/0217 high).
In the longer term, the technical structure validates a medium-term succession of lower highs and lower lows. As a result, the resistance at 149.78 (08/12/2014 high) has likely marked the end of the rise that started in July 2012. Strong support at 94.12 (24/07/2012 low) looks nonetheless far away.
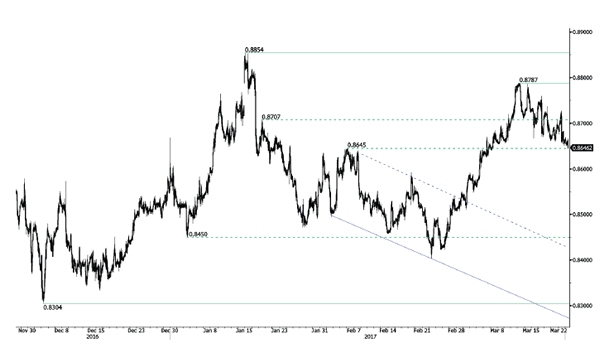
EUR/GBP Continued weakness but...
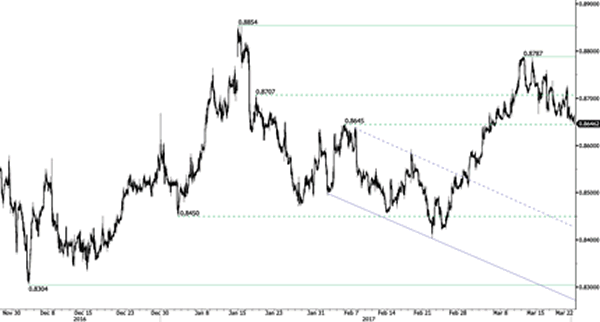
EUR/GBP is correcting lower. Yet there is the formation of a bullish flag which suggests reversal of current weakness targeting 0.9000. Key resistance is given at 0.8854 (15/01/2017 high) and other resistance can be found at 0.8787 (13/03/20167 high). Support is located at 0.8645( 05/02/2017 low).
In the long-term, the pair has largely recovered from recent lows in 2015. The technical structure suggests a growing upside momentum. The pair is trading above from its 200 DMA. Strong resistance can be found at 0.9500 psychological level.
USD/CHF Continued Decline, USD/CAD Stalling Below 1.3400, AUD/USD Failed To Test Key Resistance At 0.7778.
USD/CHF Continued decline.
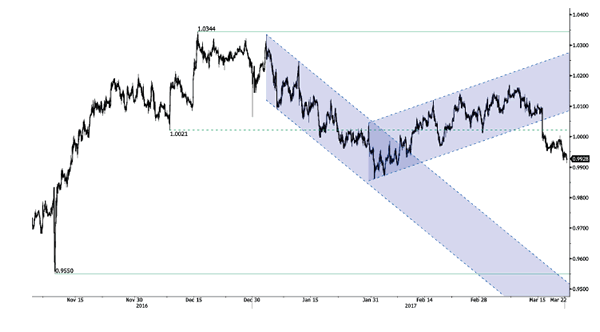
USD/CHF is declining. Hourly support is given at 0.9862 (31/01/2017 low). Key resistance can be found at a distance at 1.0344 (15/12/2016 high). Expected to show continued weakness.
In the long-term, the pair is still trading in range since 2011 despite some turmoil when the SNB unpegged the CHF. Key support can be found 0.8986 (30/01/2015 low). The technical structure favours nonetheless a long term bullish bias since the unpeg in January 2015.
USD/CAD Stalling below 1.3400.
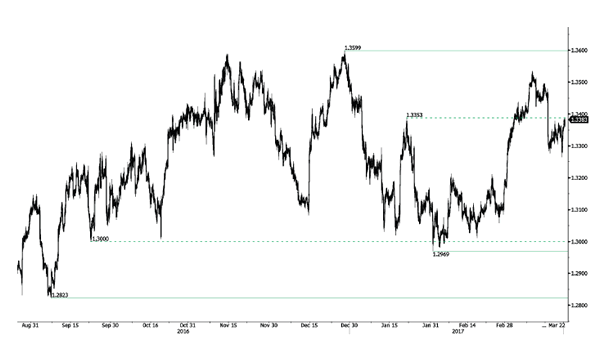
USD/CAD is bouncing. However a break of resistance area around 1.3400 is needed to invalidate the current short term bearish technical structure. The road seems still wideopen for larger decline. Key support is given at 1.2969 (31/01/2017 low).
In the longer term, there is a golden cross with the 50 dma crossing the 200 dma indicating further upside pressures. Strong resistance is given at 1.4690 (22/01/2016 high). Long-term support can be found at 1.2461 (16/03/2015 low).
AUD/USD Failed to test key resistance at 0.7778.
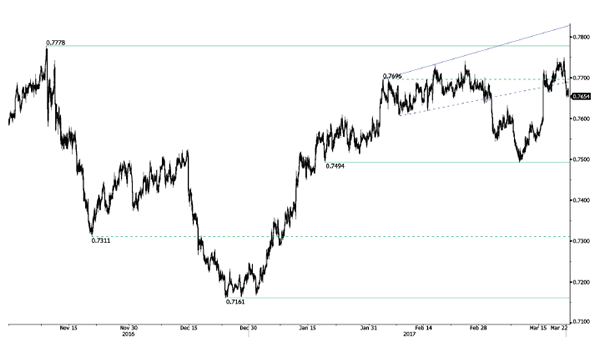
AUD/USD has failed to test the key resistance at 0.7778 (08/11/2016 high). Hourly support at 0.7664 (16/03/2017 low) has been broken.
In the long-term, we are waiting for further signs that the current downtrend is ending. Key supports stand at 0.6009 (31/10/2008 low) . A break of the key resistance at 0.8295 (15/01/2015 high) is needed to invalidate our long-term bearish view.
EUR/USD Pausing Around 1.0800, GBP/USD Bullish Breakout, USD/JPY Strong Support Has Been Broken.
EUR/USD Pausing around 1.0800.
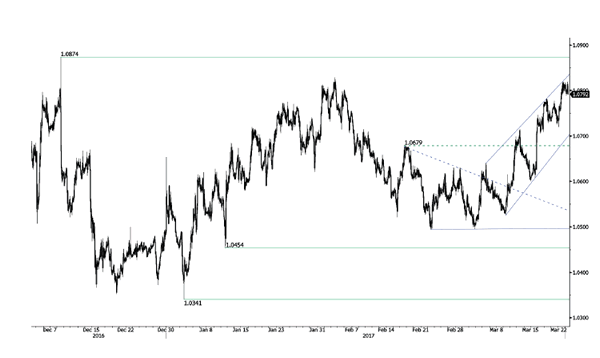
EUR/USD keeps on pushing higher, even though the pair is now pausing around 1.0800. A break of the upside channel would signal persistent buying pressures. Key resistance is given at a distance 1.0874 (08/12/2017 high). Strong support can be found at 1.0493 (22/02/2017 low). The technical structure suggests deeper increase towards resistance at 1.0874.
In the longer term, the death cross late October indicated a further bearish bias. The pair has broken key support given at 1.0458 (16/03/2015 low). Key resistance holds at 1.1714 (24/08/2015 high). Expected to head towards parity.
GBP/USD Bullish breakout.
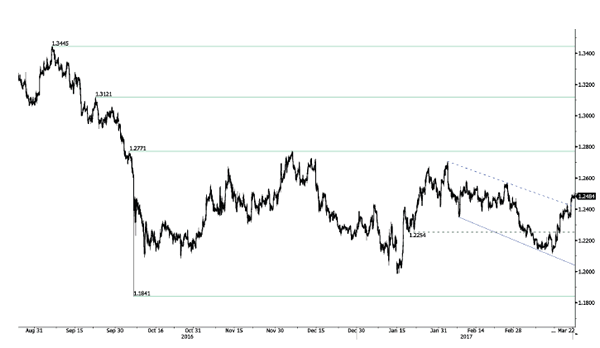
GBP/USD has broken bearish downtrend channel. The pair has broken resistance at 1.2429 and there are rooms for further strength. Key resistance can be located at 1.2570 (24/02/2017 high). Hourly support is given at 1.2324 (03/17/2017 low).
The long-term technical pattern is even more negative since the Brexit vote has paved the way for further decline. Long-term support given at 1.0520 (01/03/85) represents a decent target. Long-term resistance is given at 1.5018 (24/06/2015) and would indicate a long-term reversal in the negative trend. Yet, it is very unlikely at the moment
USD/JPY Strong support has been broken.
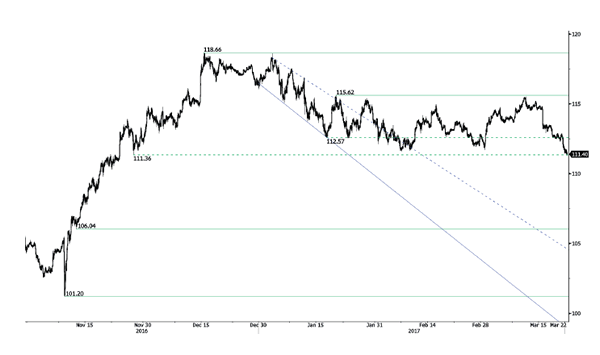
USD/JPY has failed to break key resistance given at 115.62 (19/01/2016 high) confirming persistent selling pressure. The pair has broken strong support at 111.36 (28/11/2016 low). Hourly resistance can be located at 113.57 (16/03/2017 high).
We favor a long-term bearish bias. Support is now given at 96.57 (10/08/2013 low). A gradual rise towards the major resistance at 135.15 (01/02/2002 high) seems absolutely unlikely. Expected to decline further support at 93.79 (13/06/2013 low).
Trade Idea Update: USD/CHF – Sell at 1.0000
USD/CHF - 0.9930
Original strategy :
Sell at 1.0000, Target: 0.9900, Stop: 1.0035
Position : -
Target : -
Stop : -
New strategy :
Sell at 1.0000, Target: 0.9900, Stop: 1.0035
Position : -
Target : -
Stop : -
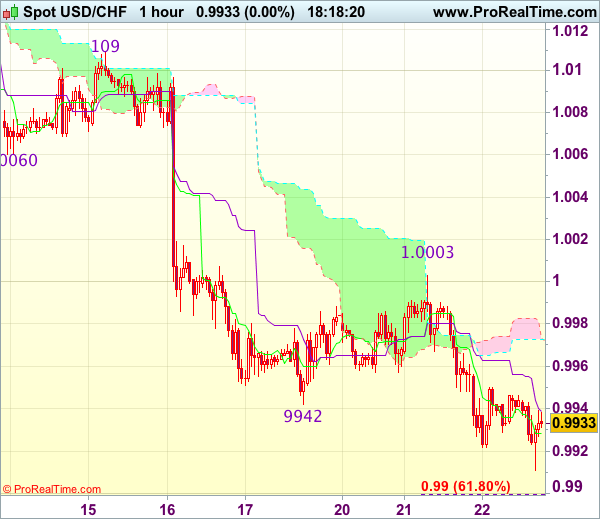
Yesterday’s selloff after meeting renewed selling interest at 1.0003 adds credence to our view that recent decline from 1.0171 is still in progress and may extend weakness to 0.9900 (61.8% projection of 1.0109-0.9942 measuring from 1.0003), however, loss of downward momentum should prevent sharp fall below 0.9870-75 and reckon 0.9850 would hold from here, risk from there has increased for a rebound later.
In view of this, would not chase this fall here and would be prudent to sell dollar on recovery as 1.0000-05 should limit upside and bring another decline. Only above previous support at 1.0060 (now resistance) would abort and signal low is formed instead, risk rebound to 1.0090-95 first.
Gold Spikes As Equities Tumble, RBNZ Meeting In Focus
News and Events:
NZD consolidates ahead of RBNZ meeting
The New Zealand dollar, like most commodity currencies, has performed relatively poorly over the last few days as it failed to attract investors' attention in spite of the broad based USD sell-off. The last RBNZ meeting drenched investors like a cold shower as Graeme Wheeler baffled investors with his surprisingly changed dovish tone on forward guidance. We can see how the RBNZ's decision could be viewed as confusing, especially against the backdrop of the improving inflationary outlook. However, we think that the central bank is betting on the Fed having to hike rates to control rising inflation pressures caused by the'Trumponomics' effect.
Unfortunately for the RBNZ, investors are currently unwinding the so-called reflation trade. In short, equities and the USD fell off a cliff yesterday and the trend is set to continue today. Against this backdrop, we would not be surprised if the Fed slows the pace of tightening and waits to see the actual effects of Trump's upcoming policy changes.
The RBNZ is holding its March meeting this evening and we do not expect Governor Wheeler to change his stance, neither to lift the OCR. The institution will however have to justify its dovish stance especially against the backdrop of mounting inflationary pressure. We favour long NZD positions, especially against the Australian dollar. NZD/USD has room for appreciation, even though the risk-off sentiment will limit risk appetite.
Trump Presidency to face serious litmus test
Is there really any language sweeter in an analyst's world than 'we told you so'?
The central theme expressed in our 2017 Market Outlook was that US President Trump would underperform expectations, unable to deliver the pro-growth, market driving policies he so fervently promised on the campaign trail. Yet, markets were too swept up in the hype of fiscal spending and tax reform to really examine the probability of success. Tomorrow's vote on the Obamacare repeal bill should be viewed as a defining moment for the inexperienced Trump presidency. With Republicans currently holding 237 to 193 majority in the House and 52 to 48 majority in the Senate, the inability to pass his hallmark legislation will be a massive political blow (especially following the debacle of his executive order travel ban). Polling indicates a tight vote, forcing Trump himself to make the round to drum up support for the bill. Trump has stated healthcare as a first priority followed by his proposed tax reform, so a defeat will only push strong pro-growth policy further from the market's reach. US cyclical and financial stocks have already come under significant pressure as optimism evaporates, pushing the global equity market broadly lower. Commodities (metals and energy) with the exception of precision metals are falling as the pace of US economic acceleration is being brought into question. A rejected bill will further zap risk-taking sentiment from investors, sending US yields and stocks lower. However, we doubt the current pullback will spiral into a full-blown correction. First, US economic data remains healthy, led by consumer and business optimism (however not accelerating to the point where the Fed needs to slam on the brakes). Second, should faith in Trump's ability to swiftly move forward on tax reform and other pro-growth policy, expectations for Fed hikes will reduce, likely triggering a resumption of risk-taking behavior. Interestingly, the market's reaction to hawkish comments by George and Mester was to largely ignore. In the current environment with rising global demand, accommodating monetary policy and low volatility we continue to advocate selling USD and rotating in higher yielding EM currencies. In the US, existing homes sales will provide a clear area where US optimism is translating into hard data (followed by Friday's durable goods orders).
Gold spikes one week after Fed rate hike
Curiously, gold is surging a week following the Fed's rate hike, flying in the face of the conventional way of thinking that the commodity should normally take a hit on the back of increased rates. Last week, the metal was struggling and took a hit but this week, it is largely recovering. Why?
It is clear to us that markets were overly optimistic about Trump's election and almost naive concerning the promised massive fiscal and spending plan. Now markets fears have come flooding back with no one really knowing what the outcome of Trump's presidency will truly be. The stock market has even begun to correct with the S&P losing almost 30 points, dropping to 2344 yesterday as the Trump administration desperately scrambles to pull together a plan to deliver its program.
Interestingly, though interest rates remain very low in the US, this is a trend we are seeing the world over. This is likely because markets are holding out for more insight on Trump's next moves before selling back their gold. If this is the case, then gold's rise is far from over.
Today's Key Issues (time in GMT):
- Jan Leading Indicator, last 96,3, rev 96,2 ZAR / 07:00
- Jan Unemployment Rate AKU, exp 4,50%, last 4,40% NOK / 07:00
- Feb Retail Sales MoM, last 0,20% DKK / 08:00
- Feb Retail Sales YoY, last -1,30% DKK / 08:00
- Feb CPI YoY, exp 6,30%, last 6,60% ZAR / 08:00
- Feb CPI Core MoM, exp 1,20%, last 0,30% ZAR / 08:00
- Feb CPI Core YoY, exp 5,40%, last 5,50% ZAR / 08:00
- Feb CPI MoM, exp 1,20%, last 0,60% ZAR / 08:00
- 4Q Current Account as a % GDP, exp -3,20%, last -4,10%, rev -3,80% ZAR / 08:00
- 4Q Current Account Balance, exp -147b, last -176b, rev -166b ZAR / 08:00
- ECB's Villeroy Speaks in Frankfurt EUR / 08:30
- Jan Current Account NSA, last 47.0b, rev 46.9b EUR / 09:00
- Jan ECB Current Account SA, last 31.0b, rev 30.8b EUR / 09:00
- Jan Current Account Balance, last 5535m EUR / 09:30
- mars.17 MBA Mortgage Applications, last 3,10% USD / 11:00
- ECB's Lautenschlaeger speaks in Frankfurt EUR / 11:30
- Mar IBGE Inflation IPCA-15 MoM, exp 0,14%, last 0,54% BRL / 12:00
- Mar IBGE Inflation IPCA-15 YoY, exp 4,73%, last 5,02% BRL / 12:00
- mars.20 CPI WoW, last 0,10% RUB / 13:00
- mars.20 CPI Weekly YTD, last 0,90% RUB / 13:00
- Jan FHFA House Price Index MoM, exp 0,40%, last 0,40% USD / 13:00
- Feb Existing Home Sales, exp 5.55m, last 5.69m USD / 14:00
- Feb Existing Home Sales MoM, exp -2,50%, last 3,30% USD / 14:00
- mars.17 DOE U.S. Crude Oil Inventories, exp 3000k, last -237k USD / 14:30
- mars.17 DOE Cushing OK Crude Inventory, exp 1100k, last 2130k USD / 14:30
- Currency Flows Weekly BRL / 15:30
- mars.23 RBNZ Official Cash Rate, exp 1,75%, last 1,75% NZD / 20:00
- 4Q BoP Current Account Balance, exp -$12.00b, last -$3.40b INR / 22:00
- Feb Tax Collections, exp 93000m, last 137392m BRL / 23:00
The Risk Today:
EUR/USD keeps on pushing higher, even though the pair is now pausing around 1.0800. A break of the upside channel would signal persistent buying pressures. Key resistance is given at a distance 1.0874 (08/12/2017 high). Strong support can be found at 1.0493 (22/02/2017 low). The technical structure suggests deeper increase towards resistance at 1.0874. In the longer term, the death cross late October indicated a further bearish bias. The pair has broken key support given at 1.0458 (16/03/2015 low). Key resistance holds at 1.1714 (24/08/2015 high). Expected to head towards parity.
GBP/USD has broken bearish downtrend channel. The pair has broken resistance at 1.2429 and there are rooms for further strength. Key resistance can be located at 1.2570 (24/02/2017 high). Hourly support is given at 1.2324 (03/17/2017 low). The long-term technical pattern is even more negative since the Brexit vote has paved the way for further decline. Long-term support given at 1.0520 (01/03/85) represents a decent target. Long-term resistance is given at 1.5018 (24/06/2015) and would indicate a long-term reversal in the negative trend. Yet, it is very unlikely at the moment.
USD/JPY has failed to break key resistance given at 115.62 (19/01/2016 high) confirming persistent selling pressure. The pair has broken strong support at 111.36 (28/11/2016 low). Hourly resistance can be located at 113.57 (16/03/2017 high). We favor a long-term bearish bias. Support is now given at 96.57 (10/08/2013 low). A gradual rise towards the major resistance at 135.15 (01/02/2002 high) seems absolutely unlikely. Expected to decline further support at 93.79 (13/06/2013 low).
USD/CHF is declining. Hourly support is given at 0.9862 (31/01/2017 low). Key resistance can be found at a distance at 1.0344 (15/12/2016 high). Expected to show continued weakness. In the long-term, the pair is still trading in range since 2011 despite some turmoil when the SNB unpegged the CHF. Key support can be found 0.8986 (30/01/2015 low). The technical structure favours nonetheless a long term bullish bias since the unpeg in January 2015.
| EURUSD | GBPUSD | USDCHF | USDJPY |
| 1.1300 | 1.3445 | 1.0652 | 121.69 |
| 1.0954 | 1.3121 | 1.0344 | 118.66 |
| 1.0874 | 1.2771 | 1.0171 | 115.62 |
| 1.0787 | 1.2469 | 0.9936 | 111.31 |
| 1.0454 | 1.1986 | 0.9862 | 106.57 |
| 1.0341 | 1.1841 | 0.9550 | 106.04 |
| 1.0000 | 1.0520 | 0.9444 | 101.20 |
Trade Idea Update: GBP/USD – Buy at 1.2400
GBP/USD - 1.2468
Original strategy :
Buy at 1.2400, Target: 1.2500, Stop: 1.2365
Position : -
Target : -
Stop : -
New strategy :
Buy at 1.2400, Target: 1.2500, Stop: 1.2365
Position : -
Target : -
Stop : -
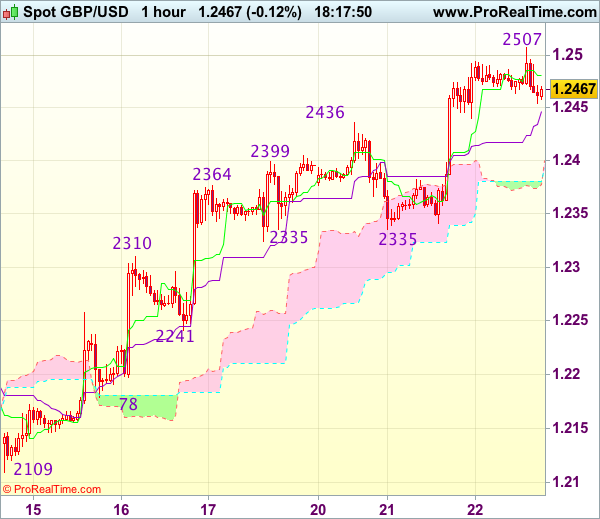
As cable has continued trading with a firm undertone after yesterday’s rally above previous resistance at 1.2436, adding credence to our bullish view that the rise from 1.2109 has resumed and bullishness remains for further gain to 1.2500 (approx. 50% projection of 1.2109-1.2436 measuring from 1.2335), however, near term overbought condition should prevent sharp move beyond 1.2540-50 and price should falter below previous chart resistance at 1.2570, risk from there has increased for a retreat to take place later.
In view of this, would not chase this move from here and we are looking to buy cable on pullback as 1.2400-10 should limit downside. Below 1.2380-85 would defer and risk correction to 1.2350 but support at 1.2335 should remain intact.