Sample Category Title
(RBNZ) Official Cash Rate Unchanged at 1.75 percent
The Reserve Bank today left the Official Cash Rate (OCR) unchanged at 1.75 percent.
Macroeconomic indicators in advanced economies have been positive over the past two months. However, major challenges remain with on-going surplus capacity in the global economy and extensive geo-political uncertainty.
Global headline inflation has increased, partly due to a rise in commodity prices, although oil prices have fallen more recently. Core inflation has been low and stable. Monetary policy is expected to remain stimulatory, but less so going forward, particularly in the US.
The trade-weighted exchange rate has fallen 4 percent since February, partly in response to weaker dairy prices and reduced interest rate differentials. This is an encouraging move, but further depreciation is needed to achieve more balanced growth.
Quarterly GDP was weaker than expected in the December quarter, but some of this is considered to be due to temporary factors. The growth outlook remains positive, supported by on-going accommodative monetary policy, strong population growth, and high levels of household spending and construction activity. Dairy prices have been volatile in recent auctions and uncertainty remains around future outcomes.
House price inflation has moderated, and in part reflects loan-to-value ratio restrictions and tighter lending conditions. It is uncertain whether this moderation will be sustained given the continued imbalance between supply and demand.
Headline inflation has returned to the target band as past declines in oil prices dropped out of the annual calculation. Headline CPI will be variable over the next 12 months due to one-off effects from recent food and import price movements, but is expected to return to the midpoint of the target band over the medium term. Longer-term inflation expectations remain well-anchored at around 2 percent.
Monetary policy will remain accommodative for a considerable period. Numerous uncertainties remain, particularly in respect of the international outlook, and policy may need to adjust accordingly.
Existing Home Sales Decline Modestly in February
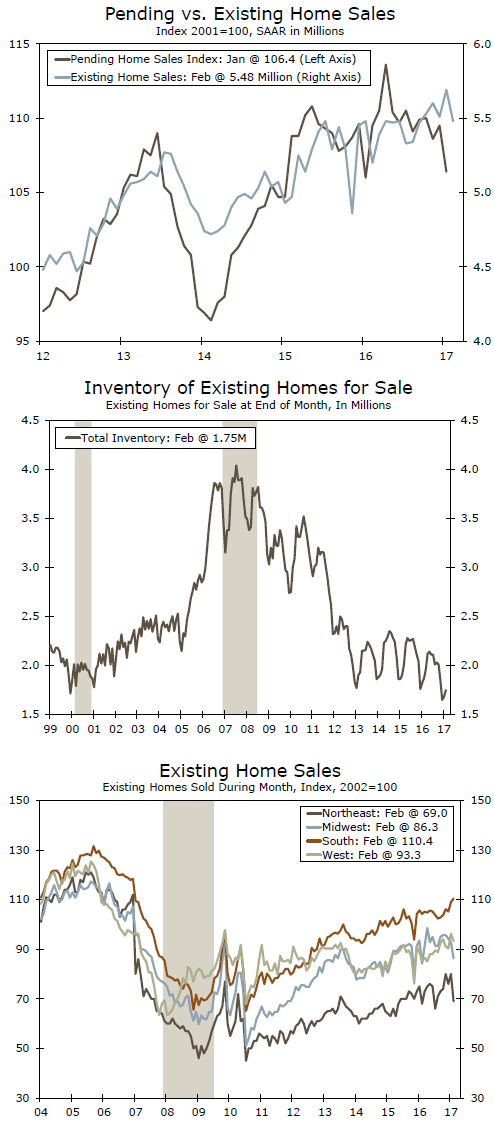
Existing homes sales fell 3.7 percent in February to a 5.48-million unit pace. Home sales are now more in line with pending sales, which had fallen in recent months. Inventories rose slightly but remain unusually lean.
Home Sales Are Still Off to a Strong Start
Existing home sales slipped 3.7 percent in February but are still off to a strong start to the year. The decline was somewhat expected following January's surprisingly strong 3.3 percent increase but February's report did come in slightly below the consensus estimate and our own lower call. Sales have averaged a 5.56-million unit pace over the past three months and remain above their year ago levels nationally and at all four regional levels.
We were expecting sales to come in below consensus, largely due to recent declines in pending home sales, which are contracts for the purchase of an existing home. Pending sales do a reasonably good job of anticipating the future direction of existing home sales but tend to overstate the magnitude of swings, particularly when you get a big down month like we did in January, when pending home sales tumbled 2.8 percent. Most of the drop in pending sales was in the West, which tumbled 9.8 percent, and the Midwest, which fell 5.0 percent. Both areas saw the return of more typical winter weather following milder weather in January. We do not expect existing home sales to precisely follow pending sales lower, just as they did not precisely follow them higher when pending sales spiked early last year.
Lean Inventories Make This a Sellers' Market
February's dip in home sales allowed inventories to rebound somewhat. For-sale inventories rose 4.2 percent to 1.75 million homes. But even with the gain, the number of homes available for sale remains 6.4 percent lower than it was one year ago, continuing a string of year-to-year drops that stretches back 21 months. Relative to sales, there is now a 3.8-month supply of homes available for sale. A balanced market would have around a 5.5-month supply.
With overall inventories as low as they are, sellers are selling their homes very quickly. The typical home sold in February was on the market for just 45 days, which compares to 59 days one year ago. Moreover, 42 percent of the homes sold in February were on the market for one month or less. The hottest markets remain mostly in the West, including San Francisco, Seattle and Denver, where strong job growth in the tech sector and limited new construction has kept inventories incredibly lean.
By region, sales tumbled 13.8 percent in Northeast, fell 7.0 percent in the Midwest and declined 3.1 percent in the West. The South, which is by far the largest region for existing home sales, saw sales rise 1.3 percent, likely reflecting strong demand in Florida, Texas, Georgia and the Carolinas.
The median price of an existing home rose 7.7 percent over the past year. Prices are up the most in the West and South, where they are 9.6 percent higher than one year ago. By contrast, the median price of a home is up 6.1 percent over the past year in the Midwest and 4.1 percent in the Northeast.
Elliott Wave Analysis: EURAUD Looking For More Upside
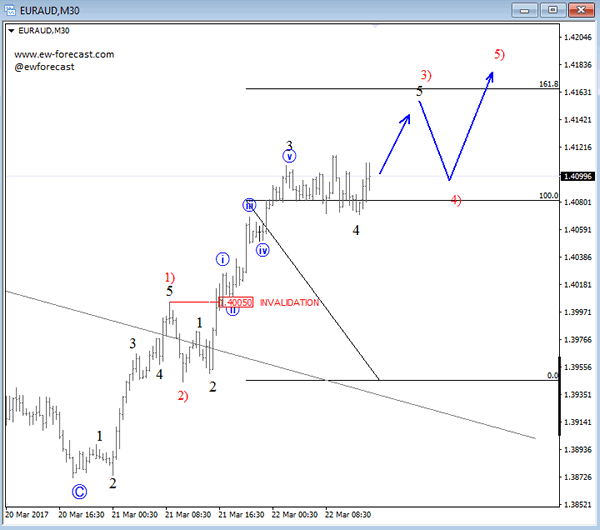
EURAUD just broke to a new high ideally now in fifth wave up trying to push prices towards 1.4150/60 area for an extended red wave 3).
EURAUD, 1H
What’s Next for the Dollar, Gold & Stocks?
Two rate hikes since last year have weakened the dollar. Why is that, and what's ahead for dollar, currencies & gold? And while we are at it, we'll chime in on what may be in store for the stock market...
Stocks...
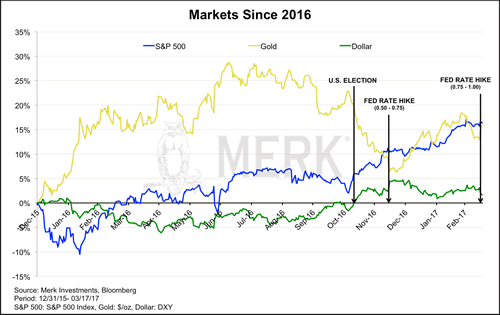
The chart above shows the S&P 500, the price of gold and the U.S. dollar index since the beginning of 2016. The year 2016 started with a rout in the equity markets which was soon forgotten, allowing the multi-year bull market to continue. After last November's election we have had the onset of what some refer to as the Trump rally. Volatility in the stock market has come down to what may be historic lows. Of late, many trading days appear to start on a down note, although late day rallies (possibly due to retail money flowing into index funds) are quite common.
Where do stocks go from here? Of late, we have heard outspoken money manager Jeff Gundlach suggests that bear markets only happen if the economy turns down; and that his indicators suggest that there's no recession in sight. We agree that bear markets are more commonly associated with recessions, but with due respect to Mr. Gundlach, the October 1987 crash is a notable exception. The 1987 crash was an environment that suffered mostly from valuations that had gotten too high; an environment where nothing could possibly go wrong: the concept of "portfolio insurance" was en vogue at the time. Without going into detail of how portfolio insurance worked, let it be said that it relied on market liquidity. The market took a serious nosedive when the linkage between the S&P futures markets and their underlying stocks broke down.
I mention these as I see many parallels to 1987, including what I would call an outsized reliance on market liquidity ensuring that this bull market continues its rise without being disrupted by a flash crash or some a type of crash awaiting to get a label. Mind you, it's extraordinarily difficult to get the timing right on a crash; that doesn't mean one shouldn't prepare for the risk.
Bonds...
If I don't like stocks, what about bonds. While short-term rates have been moving higher, longer-term rates have been trading in a narrow trading range for quite some time, frustrating both bulls and bears. Bonds are often said to perform well when stock prices plunge, but don't count on it: first, even the historic correlation is not stable. But more importantly, when we talk with investors, many of them have been reaching for yield. We see sophisticated investors, including institutional investors, provide direct lending services to a variety of groups. What they all have in common is that yields are higher than what you would get in a traditional bond investment. While the pitches for those investments are compelling, it doesn't change the fact that high yield investments, in our analysis, tend to be more correlated with risk assets, i.e. with equities, especially in an equity bear market. Differently said: don't call yourself diversified if your portfolio consists of stocks and high yielding junk bonds. I gather that readers investing in such bonds think it doesn't affect them; let me try to caution them that some master-limited partnership investments in the oil sector didn't work out so well, either.
Gold...
I have argued for some time that the main competitor to the price of gold is cash that pays a high real rate of return. That is, if investors get compensated for holding cash, they may not have the need for a brick that has no income and costs a bit to hold.
After the election, we believe the price of gold came down as the market priced in higher real interest rates in anticipation of lower regulations. We indicated that this euphoria will cede to realism, meaning that regulations might not be cut quite as much. We also suggested that any fiscal stimulus on the backdrop of low employment may be inflationary. That is, expectations of higher real rates might be replaced with expectations of higher nominal rates; net, bonds might not change all that much, but the price of gold may well rise in that environment.
Add the Fed to the picture, having raised rates twice now since the election. We have argued that the Fed is and continues to be 'behind the curve,' i.e. is raising rates more slowly than inflationary pressures are building. We believe the Fed is petrified that they might have to go down back to QE when the next recession comes and, as a result, has been very slow in raising rates. Indeed, we believe the Fed will only raise rates if the market delivers a rate hike on a silver platter, i.e. the markets are "behaving" (no taper tantrum). As such, let me make this prediction: if the S&P 500 is up 20% from current levels this October, odds are we will get more rate hikes than are currently priced in; conversely, if the S&P 500 is down 20% from current levels this October, odds are we will get fewer rate hikes than are currently priced in. If you are rolling your eyes that this isn't too ingenious, I would like to remind readers that this isn't supposed to be the yard stick the Fed should be using. We believe the Fed is a hostage of the market. Paraphrasing a former Fed official who shall remain unnamed, he indicated to me that the Fed wouldn't care how the S&P reacts to an FOMC decision, unless, they created a bubble.
The Dollar...
What about the greenback? The dollar index (DXY) was up four years in a row. Year-to-date, however, the index is down despite the recent rate hikes. It shows that everything is relative to what is priced in already. A key reason we believe the dollar may have seen its peak is because of the Fed's unwillingness to get 'ahead of the curve'. Not with Janet Yellen, at least. Her term as Chair is running out next January; we wouldn't be surprised if she is replaced with Kevin Warsh. He was a Fed governor during the financial crisis; he has since published a variety of OpEds, criticizing the Fed. He has also been on one of President Trump's economic round tables. If he indeed succeeds Yellen (there are other names being mentioned; we just happen to think that at this stage, he best fits the profile of what Trump may be looking for), he has indicated that the reason why Fed officials are appointed for many years is so they don't have to worry how markets react to policy decisions. That's a stoic attitude, but reality (called "deteriorating financial conditions") may well change his mind should he become Fed Chair and try to raise rates more aggressively.
Aside from real interest rates, when it comes to the dollar, it is worth paying attention to trade policy. So-called experts had predicted a 20% surge in the dollar based on the "border adjustment tax" in the GOP House tax plan. Except that surge hasn't happened. Maybe the plan is dead. Maybe the plan's market impact will be different. Our take is: if you introduce barriers to trade, we believe currencies of countries with current account deficits tend to suffer. The greenback qualifies, and the recent decline coincides with more protectionist talk coming from the Trump administration.
The Sterling...
Talking about the greenback, there's always another currency at the other side of the trade. The sterling is one of those currencies that has suffered as trade barriers have been raised (a "Brexit" is akin to increasing trade barriers); the Brits also have a current account deficit. And we think those trade barriers will become ever more apparent as the odds of the UK and the EU coming to a prudent trade agreement appear rather dim. We come to that assessment because of the EU's institutional setup requiring unanimity for new trade deals on the one hand, but a hard deadline on the other hand to leave the EU once Article 50 (the 'exit' article) is triggered.
What gets us really negative about the sterling, though, is their fiscal situation. Sure, there may well be a short squeeze at some point because others don't like the currency but medium to long-term, we believe the Brits may well go down what we call the "Italian road." That is, we believe they'll finance substantial deficits with monetary policy that's too loose, leading to a currency that will cascade lower over time. That's because we don't see how the Brits can finance their budgets. When the Brits had their austerity budgets, their finances had moved from what we would call horrible to bad. Now they may well drift back to horrible as government spending increases to cushion the blow from Brexit.
The Euro...
What about the currency investors love to hate? Let me remind readers that everything is relative to what is being priced in. The euro has done well year to date because, we believe investors are increasingly realizing that the lows in rates may have been reached. The dollar started to surge at the first talk of tapering, even as the first actual rate hike was far, far, off. Similarly, the euro may well start appreciating well before rates will actually go up again in the Eurozone.
Recently, European Central Bank (ECB) head Draghi gave an upbeat presentation at a press conference, suggesting (and I'm putting words into his mouth here) we shouldn't be overly worried about the various upcoming risk events (Dutch election at the time; the French election, etc.), as there isn't much as we can do about them anyway; and if something bad were to happen, well, he'll do whatever it takes. Then the Dutch rejected populism. Then the rumor came up that the ECB may hike rates before ending the purchases of securities; this rumor was given credence as the Austrian ECB member of the governing counsel suggested that there are many different rates and, yes, some could be raised before the bond purchases are done.
Separately, we believe the euro has increasingly become a so-called funding currency. Amongst others because rates are so low, speculators are borrowing in euros to buy higher yielding assets. If we have a risk off event, e.g. a sharper decline in stocks, those speculators might have to reduce their bets and, as part of that, buy back the euro. Short covering may not lead to sustainable rallies in the euro, but it's a piece of the puzzle worth watching.
EM currencies...
Emerging market (EM) currencies tend to be proxies for risk assets, i.e. they tend to do just fine when times are good, but in the case of severe selloffs, our analysis shows they also tend to suffer. We don't think they are as vulnerable as they have been at other times when investors have been chasing yield (remember, in EM markets, higher yielding bonds tend to be available), but any investors exposed to them should keep those risks in mind in the context of an overall portfolio allocation.
Make your portfolio great again...
Before you contemplate how to rebalance your portfolio, think about how institutional investors might be rebalancing their portfolio. U.S. markets have been outperforming, the dollar has been rising. As such, we would think institutional investors might shift assets overseas to rebalance their portfolios, thereby favoring international equities and putting downward pressure on the dollar.
As you might have gathered, I believe most investors are over-exposed to US equities. Equities have performed so well that it's difficult to get anyone to listen to this concern. And that's exactly the type of environment that is a fertile ground for bubbles.
Existing Home Sales Pull Back from 10-Year High in February
After rising to the highest level since 2007 in January, existing home sales fell by 3.7% m/m to 5.48 million (annualized) in February. The headline print was slightly weaker than market expectations which called for a 2.5% drop to 5.55 million.
The decline was concentrated in the single family segment where transactions fell by 3.0% to 4.89 million. Sales in the smaller condo/co-op segment retreated by a sharper 9.2% to 590 thousand.
On a regional basis, sales activity declined across most regions, pulling back in the Northeast (-13.8%), Midwest (-7.0%) and West (-3.1%), while a modest gain was recorded in the South (1.3%). Despite the pull back, activity remained higher than year-ago levels across the board.
The inventory of homes available for sale, while increasing 4.2% to 1.75 million on the month, remained 6.4% below year-ago level. The low supply of homes is pressuring up home prices, with the median home price accelerating to 7.7% y/y in February from 6.4% in the prior month.
First time homebuyers accounted for 32% of sales - down 1 percentage point from last month but up 3pp from year-ago.
Key Implications
While the pullback in activity is disappointing, it was not a surprise. The post-election rise in interest rates pulled forward some contract-signing and was bound to eventually weigh on sales activity as the initial rush dissipated. Demand for homes in February was also tempered by robust home price growth and very-low inventory levels - the latter being at a multiyear low, having fallen for nearly two years.
Sales activity is likely to remain relatively flat over the near-term, as the aforementioned factors continue to weigh on the housing market - a narrative corroborated by falling pending home sales data.
Still, the story is brighter over the longer-run as increasingly solid fundamentals - highlighted by robust job gains and rising wage growth which are both pulling more workers from the sidelines - should continue to buoy demand. Additional supply from rising new home building as well that of existing homes - as current owners increasingly believe it is a good time to sell a home to cash in on past price gains - will also help boost activity and alleviate some of the price pressures on existing home prices over the medium term.
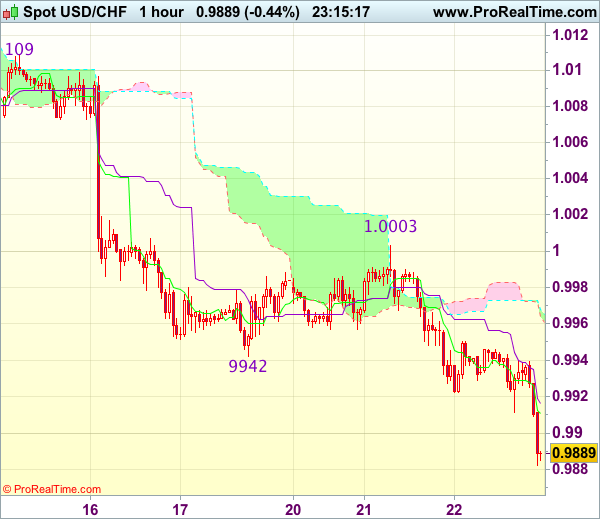
Trade Idea Wrap-up: USD/CHF – Sell at 1.0000
USD/CHF - 0.9897
Most recent candlesticks pattern : N/A
Trend : Near term down
Tenkan-Sen level : 0.9911
Kijun-Sen level : 0.9916
Ichimoku cloud top : 0.9973
Ichimoku cloud bottom : 0.9972
Original strategy :
Sell at 1.0000, Target: 0.9900, Stop: 1.0035
Position : -
Target : -
Stop : -
New strategy :
Sell at 1.0000, Target: 0.9900, Stop: 1.0035
Position : -
Target : -
Stop : -
Yesterday’s selloff after meeting renewed selling interest at 1.0003 adds credence to our view that recent decline from 1.0171 is still in progress and may extend weakness to 0.9875-80, however, loss of downward momentum should prevent sharp fall below 0.9850 and reckon 0.9825-30 would hold from here, risk from there has increased for a rebound later.
In view of this, would not chase this fall here and would be prudent to sell dollar on recovery as 1.0000-05 should limit upside and bring another decline. Only above previous support at 1.0060 (now resistance) would abort and signal low is formed instead, risk rebound to 1.0090-95 first.
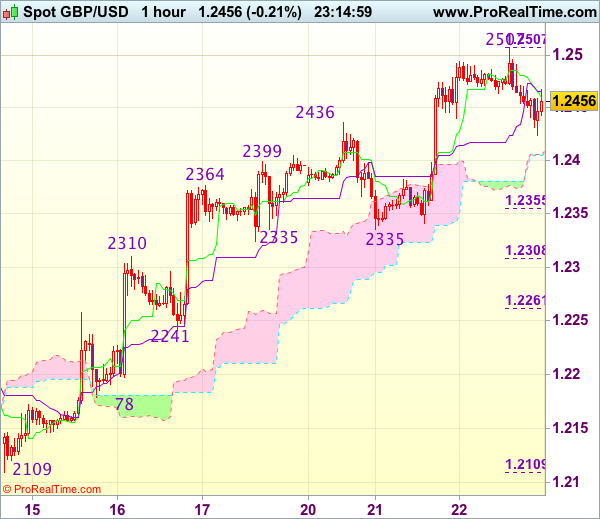
Trade Idea Wrap-up: GBP/USD – Buy at 1.2355
GBP/USD - 1.2466
Most recent candlesticks pattern : N/A
Trend : Near term up
Tenkan-Sen level : 1.2460
Kijun-Sen level : 1.2466
Ichimoku cloud top : 1.2406
Ichimoku cloud bottom : 1.2405
Original strategy :
Buy at 1.2355, Target: 1.2500, Stop: 1.2320
Position : -
Target : -
Stop : -
New strategy :
Buy at 1.2355, Target: 1.2500, Stop: 1.2320
Position : -
Target : -
Stop : -
As cable has retreated after intra-day brief rise to 1.2507, suggesting consolidation below this level would be seen and pullback to 1.2400-10 is likely, however, reckon downside would be limited to 1.2350-55 (38.2% Fibonacci retracement of 1.2109-1.2507) and bring rebound later, above said resistance at 1.2507 would signal the rise from 1.2109 has resumed and extend gain to 1.2540-50 but loss of upward momentum would limit upside and price should falter below previous chart resistance at 1.2570.
In view of this, would not chase this move from here and we are looking to buy cable on subsequent pullback as 1.2350-55 should limit downside. Below strong support at 1.2335 would abort and signal top is formed instead, risk correction to 1.2305-10 (50% Fibonacci retracement of 1.2109-1.2507) first.
Yen Climbs on Strong Japanese Trade Surplus, Soft US Housing Report
The Japanese yen continues to make inroads against the US dollar in Wednesday trading. In the North American session, USD/JPY is trading at the 111 line, as the yen hit a 4-month high earlier in the day. On the release front, Japan's trade surplus soared to JPY 0.68 trillion, well above the forecast of JPY 0.55 trillion. As well, the BoJ released the minutes of its January policy meeting. In the US, housing and inflation data was a disappointment. Existing Home Sales dropped to 5.48 million, missing the forecast of 5.59 million. As well, the House Price Index fell to a flat 0.0%, short of the estimate of 0.4%. On Thursday, the US releases unemployment claims.
With little in the way of key fundamentals this week, the markets are focusing on comments from FOMC members who will be speaking this week, including Fed Chair Janet Yellen on Thursday. On Monday, Chicago Fed President Charles Evans said he expects the Fed to raise rates two more times this year. This echoes the Fed's dot point plot as well as last week's rate statement. Although three rate hikes in 2017 would be no mean feat, the markets would like four hikes, given the strong performance of the US economy. The Fed's cautious approach has disappointed the markets, as the US dollar continues to post broad losses. The yen has taken full advantage, gaining 3.3 percent against the dollar since the Fed policy meeting last week.
Donald Trump continues to trumpet his "America first" slogan, and the US president's protectionist stance has sent off alarm bells in Japan, which is heavily dependent on free trade. Immediately after taking office, Trump pulled the US out of the Trans-Pacific Partnership deal, an enormous free-trade agreement which Japan had enthusiastically supported. Japan has embarked on finding other trading partners in order to lessen its dependence on the US. Japanese Prime Minister Shinzo Abe met with EU President Donald Tusk on Tuesday, and the two discussed the Japanese-EU trade agreement, which was supposed to be finalized in 2015. With Europe still fuming over the 'Brexit burn' delivered by Britain, there is likely more appetite on the part of the EU to conclude an agreement with Japan, the world's third largest economy.
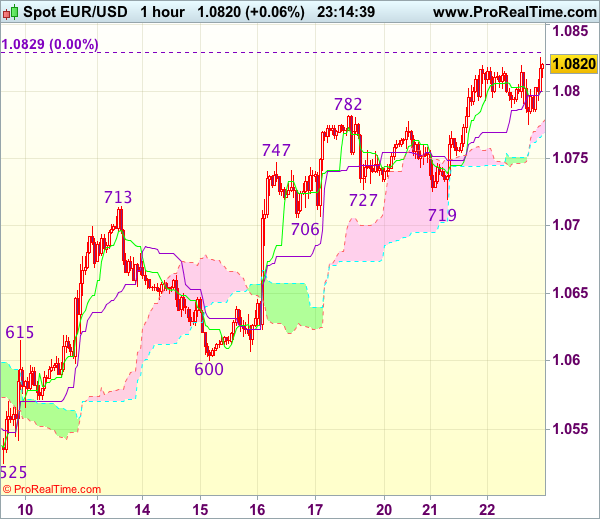
Trade Idea Wrap-up: EUR/USD – Buy at 1.0725
EUR/USD - 1.0810
Most recent candlesticks pattern : N/A
Trend : Near term up
Tenkan-Sen level : 1.0800
Kijun-Sen level : 1.0800
Ichimoku cloud top : 1.0776
Ichimoku cloud bottom : 1.0768
Original strategy :
Buy at 1.0725, Target: 1.0840, Stop: 1.0690
Position : -
Target : -
Stop : -
New strategy :
Buy at 1.0725, Target: 1.0840, Stop: 1.0690
Position : -
Target : -
Stop : -
As the single currency has maintained a firm bias after surging again yesterday, suggesting recent erratic upmove from 1.0493 low is still in progress and may extend further gain to previous chart resistance at 1.0829, however, loss of near term upward momentum should prevent sharp move beyond 1.0850-60 and price should falter well below 1.0890-00, risk from there has increased for a retreat to take place later.
In view of this, would not chase this rise here and we are looking to buy euro on subsequent pullback as 1.0706 support should limit downside and bring another rise later. Below 1.0675-80 would defer and suggest top is possibly formed, risk weakness to 1.0640 (previous resistance now support) but still reckon indicated support at 1.0600 would remain intact.
Trade Idea Wrap-up: USD/JPY – Sell at 112.00
USD/JPY - 111.14
Most recent candlesticks pattern : N/A
Trend : Near term down
Tenkan-Sen level : 111.20
Kijun-Sen level : 111.60
Ichimoku cloud top : 112.75
Ichimoku cloud bottom : 112.61
Original strategy :
Sell at 111.70, Target: 110.60, Stop: 112.05
Position : -
Target : -
Stop : -
New strategy :
Sell at 112.00, Target: 110.80, Stop: 112.35
Position : -
Target : -
Stop : -
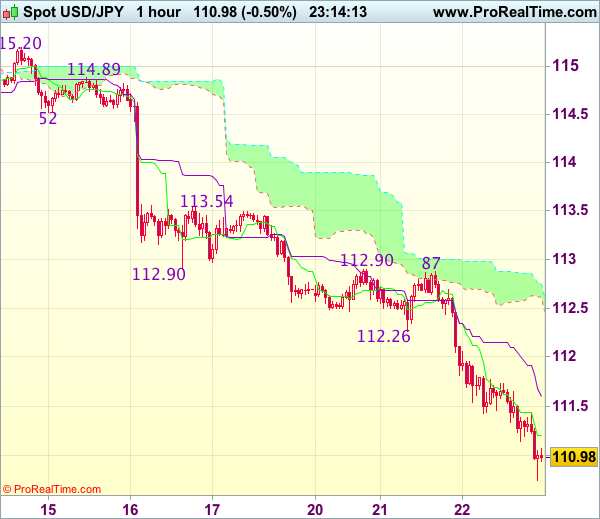
As the greenback has dropped again in US morning, adding credence to our view that recent decline is still in progress and may extend further fall to 110.50-55, however, near term oversold condition should prevent sharp fall below 110.20-25 and reckon 110.00 would hold from here, risk from there is seen for a rebound to take place later.
In view of this, would not chase this fall here and would be prudent to sell cable on recovery as 112.00 should limit upside. Only above indicated previous support at 112.26 would abort and signal low is formed instead, bring a stronger rebound to 112,59 but resistance at 112,87-90 should cap upside.