

Sample Category Title
EUR/USD Mid-Day Outlook
Daily Pivots: (S1) 1.0716; (P) 1.0747 (R1) 1.0769; More.....
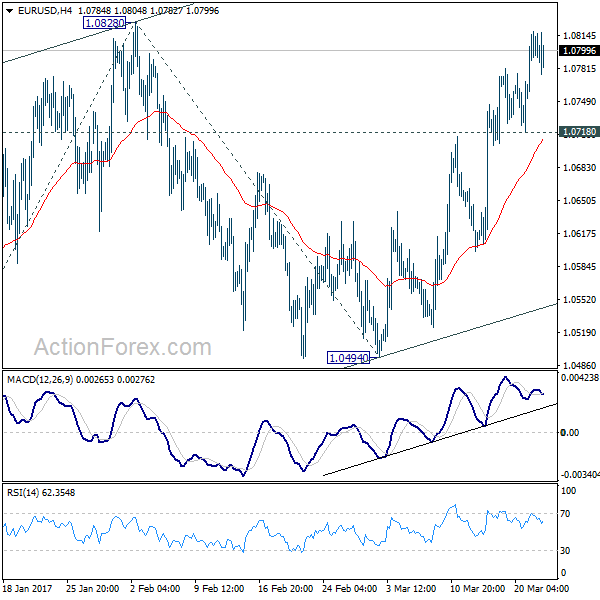
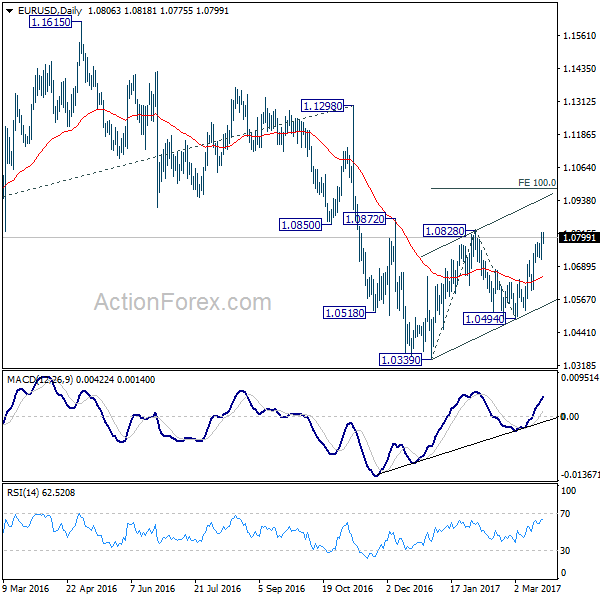
With 1.0718 minor support intact, intraday bias in EUR/USD remains on the upside for 1.0828 resistance. Break there will target 100% projection of 1.0339 to 1.0828 from 1.0494 at 1.0983. However, as rise from 1.0339 is seen as a corrective move. We'd expect upside to be limited by 1.0983 to complete the correction. On the downside, break of 1.0718 minor support will turn bias to the downside for 1.0494 support first.
In the bigger picture, as long as 1.1298 key resistance holds, whole down trend from 1.6039 (2008 high) is still expected to resume later. Break of 1.0339 low will send EUR/USD through parity to 61.8% projection of 1.3993 to 1.0461 from 1.1298 at 0.9115.
GBP/USD Mid-Day Outlook
Daily Pivots: (S1) 1.2381; (P) 1.2437; (R1) 1.2535; More...
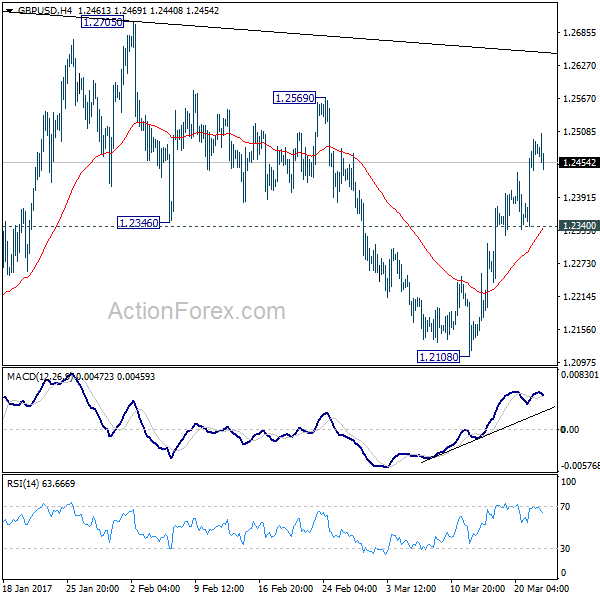
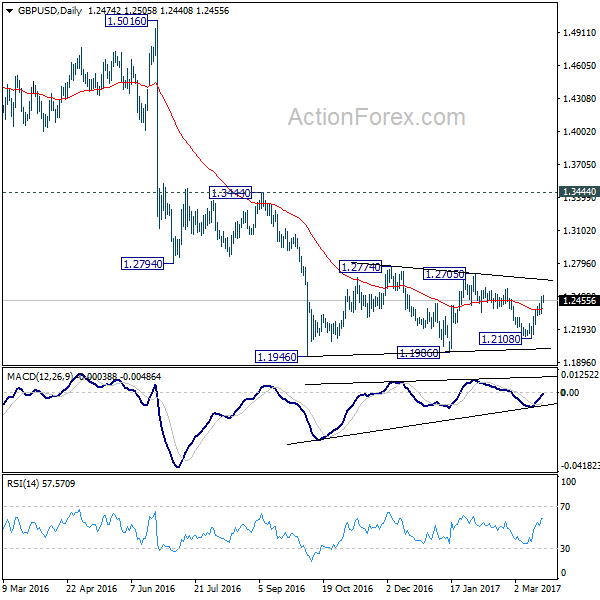
Intraday bias in GBP/USD remains on the upside as rise from 1.2108 continues. Their pair would target 1.2569 resistance first and break will target 1.2705/74 resistance zone. But still, price actions from 1.1946 are seen as a consolidation pattern. Hence, we'd expect strong resistance from 1.2705/2774 to limit upside and bring down trend resumption. On the downside, break of 1.2340 support will turn bias back to the downside for 1.2108 support. Though, sustained break of 1.2774 will extend the rise towards 1.3444 key resistance level.
In the bigger picture, fall from 1.7190 is seen as part of the down trend from 2.1161. There is no sign of medium term bottoming yet. Sustained trading below 61.8% projection of 2.1161 to 1.3503 from 1.7190 at 1.2457 will target 100% projection at 0.9532. Overall, break of 1.3444 resistance is needed to confirm medium term bottoming. Otherwise, outlook will remain bearish.
USD/CHF Mid-Day Outlook
Daily Pivots: (S1) 0.9905; (P) 0.9953; (R1) 0.9985; More.....
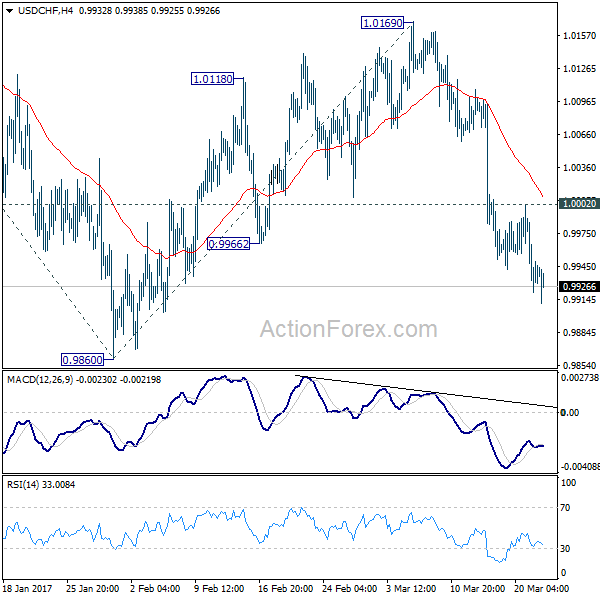
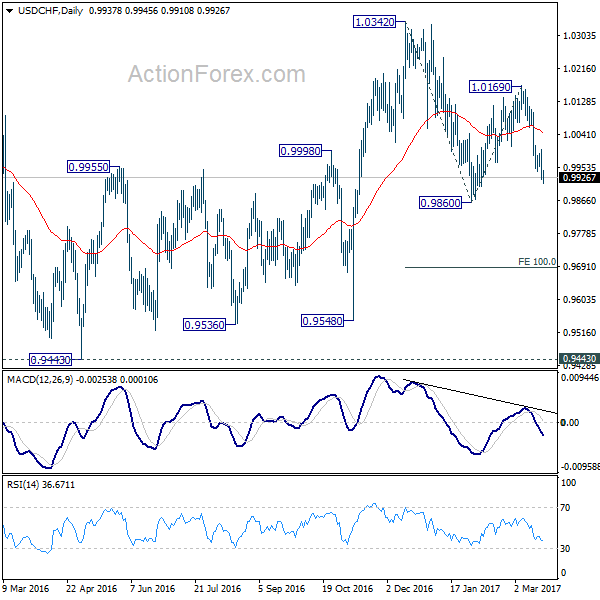
Intraday bias in USD/CHF remains on the downside and fall from 1.0169 should target 0.9860 support next. Whole decline from 1.0342 is likely resuming and break of 0.9860 will target 100% projection of 1.0342 to 0.9860 from 1.0169 at 0.9687. Nonetheless, on the upside, break of 1.0002 minor resistance will turn bias back to the upside for 1.0169 resistance instead.
In the bigger picture, USD/CHF is staying in medium term sideway pattern between 0.9443/1.0342. In any case, decisive break of 1.0342 resistance is needed to confirm underlying strength. Otherwise, we'll stay neutral in the pair first. In case of another fall, we'd expect strong support from 0.9443/9548 support zone.
USD/JPY Mid-Day Outlook
Daily Pivots: (S1) 111.21; (P) 112.03; (R1) 112.54; More...
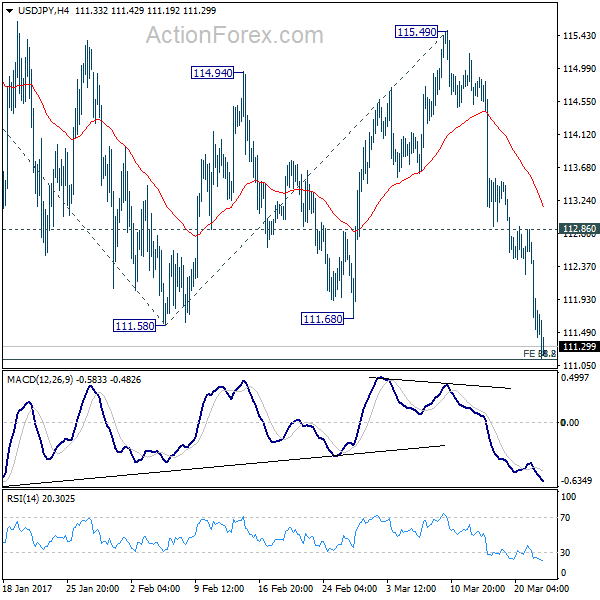
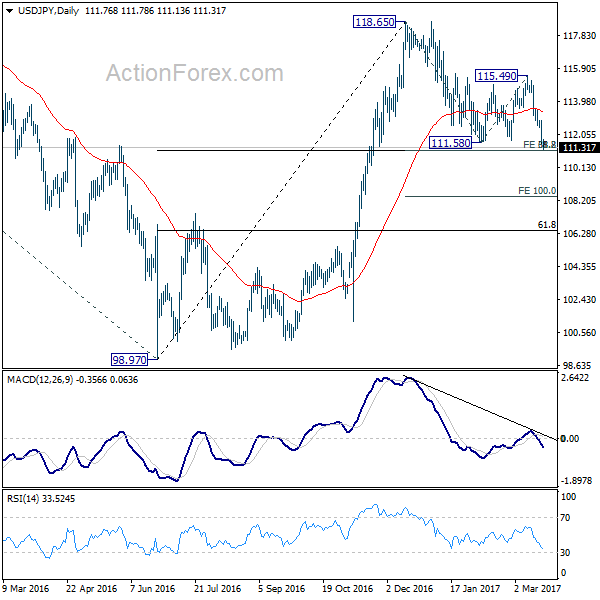
USD/JPY drops to as low as 111.13 so far today and is pressing 111.12/13 cluster support. Such support level represents 61.8% projection of 118.65 to 111.58 from 115.49 at 111.12 and 38.2% retracement of 98.97 to 118.65 at 111.13. At this point, we'd still anticipate strong support around 111.12/13 to contain downside and bring rebound. Break of 112.86 resistance will turn bias back to the upside for 115.49 resistance first. However, sustained break of 111.12/13 will bring deeper decline to 100% projection of 118.65 to 111.58 from 115.49 at 108.42.
In the bigger picture, price actions from 125.85 high are seen as a corrective pattern. The impulsive structure of the rise from 98.97 suggests that the correction is completed and larger up trend is resuming. Decisive break of 125.85 will confirm and target 61.8% projection of 75.56 to 125.85 from 98.97 at 130.04 and then 135.20 long term resistance. Nonetheless, sustained trading below 55 week EMA (now at 111.19) will extend the consolidation from 125.85 with another fall through 98.97 before completion.
Risk Aversion Dominates and Global Selloff Continues
Risk aversion dominates the financial markets today. European indices are trading broadly lower with FTSE leading the way by losing more than -0.7%. CAC and DAX are both down -0.5% respectively. DJIA had the worst day for this year yesterday and is set to extend the sharp fall as suggested by futures. Nikkei lost -2.13% earlier today as additionally pressured by report of North Korea's failed missile test. Stocks are sold off sharply on concerns that US president Donald Trump doesn't have the ability to fulfil his election promises and push through his policies. Those include tax cuts and infrastructure spending. US House is set to vote on Trump's healthcare plan and that is seen as a litmus test for him. In the currency markets, Yen is leading the way higher on safe haven flow, followed by Swiss Franc. Aussie is trading as the weakest one.
ECB: Protectionism may increase trade deficit
ECB said in a study paper released today that protectionist trade policies may increase a country's trade deficit, rather than reduce it. The paper noted that "adopting policies that facilitate innovation and reduce protectionist barriers may help to improve an economy's competitiveness." And, "multilateral initiatives aimed at trade and financial liberalization may also reduce an economy's external imbalances." Meanwhile, "participating in global value chains may give an economy a temporary competitive edge that results - in order to smooth consumption over time - in a rise in its current account balance.
Separately, ECB governing council member, Bank of France head François Villeroy de Galhau said that it's a "clear no" for the central to stop accommodative monetary policy. He said that "without monetary stimulus, the recovery in inflation would not yet be self-sustained or durable throughout the euro area."
BoJ members rejected lifting bond yield targets
BOJ's minutes for the January meeting sent little news about Japan's monetary policy stance. Policymakers discussed about rising JGB yields but the majority rejected the idea of raising the 10-year JGB yield target to match expected gains in Treasury yields. The members suggested that BOJ should focus on achieving the 2% inflation target. As noted in the minutes, "although some market participants speculated that the Bank might consider raising the target level of the long-term interest rate in response to such factors as a rise in the U.S. long-term interest rates, its monetary policy decisions should be made solely based on the viewpoint of aiming to achieve the 2% price stability target".
Japan trade surplus widened to JPY 0.68T in February, above expectation of 0.55T. Exports jumped 11.3% yoy, fastest since January 2015. Exports to China jumped 28.2% yoy, accelerated from 3.1% yoy in the prior month. Some analysts noted that even stripping out the Lunar New Year effects, exports still picked up as a trend. All industry activity index rose 0.1% mom in January.
NZD/JPY dives on risk aversion ahead of RBNZ
RBNZ rate decision will be a major focus in the coming Asian session. The central bank is widely expected to keep the Official Cash Rate unchanged at 1.75%. It sounded neutral in last statement and just noted that "monetary policy will remain accommodative for a considerable period." There was no explicitly mentioning of its policy bias. RBNZ will likely maintain such stance. Meanwhile, it would likely reiterate that "exchange rate remains higher than is sustainable for balanced growth". And, "a decline in the exchange rate is needed."
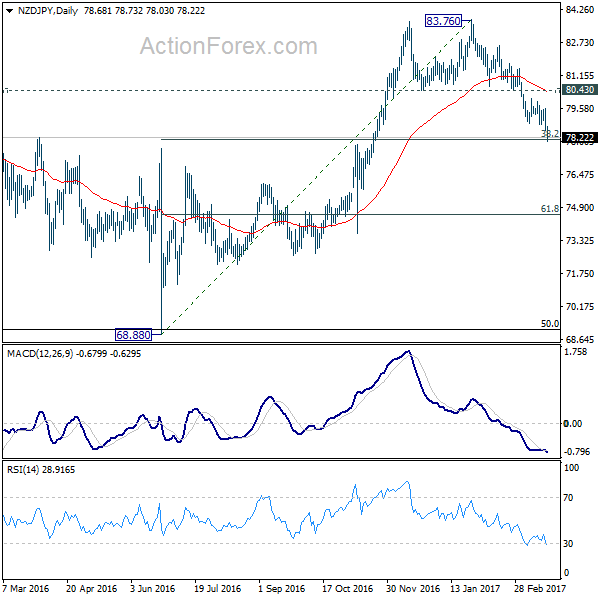
Kiwi is relatively steady against Dollar this week. But NZD/JPY dives notably on risk aversion. The rejection from 83.36 key long term resistance confirmed medium term topping at 83.76 back in January. The development also indicates that rebound from 68.88 (2016 low) has completed. Medium term outlook will now stay bearish as low as 80.43 support resistance holds. 38.2% retracement of 68.88 to 83.76 at 78.07 is seen as an important support. But based on current momentum, this support will likely be taken out as the cross head towards 61.8% retracement of 68.88 to 83.76 at 74.56 ahead.
USD/JPY Mid-Day Outlook
Daily Pivots: (S1) 111.21; (P) 112.03; (R1) 112.54; More...
USD/JPY drops to as low as 111.13 so far today and is pressing 111.12/13 cluster support. Such support level represents 61.8% projection of 118.65 to 111.58 from 115.49 at 111.12 and 38.2% retracement of 98.97 to 118.65 at 111.13. At this point, we'd still anticipate strong support around 111.12/13 to contain downside and bring rebound. Break of 112.86 resistance will turn bias back to the upside for 115.49 resistance first. However, sustained break of 111.12/13 will bring deeper decline to 100% projection of 118.65 to 111.58 from 115.49 at 108.42.
In the bigger picture, price actions from 125.85 high are seen as a corrective pattern. The impulsive structure of the rise from 98.97 suggests that the correction is completed and larger up trend is resuming. Decisive break of 125.85 will confirm and target 61.8% projection of 75.56 to 125.85 from 98.97 at 130.04 and then 135.20 long term resistance. Nonetheless, sustained trading below 55 week EMA (now at 111.19) will extend the consolidation from 125.85 with another fall through 98.97 before completion.
Economic Indicators Update
| GMT | Ccy | Events | Actual | Forecast | Previous | Revised |
|---|---|---|---|---|---|---|
| 23:30 | AUD | Westpac Leading Index M/M Feb | -0.10% | 0.00% | ||
| 23:50 | JPY | BOJ Minutes (Jan 30-31) | ||||
| 23:50 | JPY | Trade Balance (JPY) Feb | 0.68T | 0.55T | 0.16T | 0.20T |
| 4:30 | JPY | All Industry Activity Index M/M Jan | 0.10% | 0.00% | -0.30% | -0.20% |
| 9:00 | EUR | Eurozone Current Account (EUR) Jan | 24.1B | 29.3B | 31.0B | 30.8B |
| 13:00 | USD | House Price Index M/M Jan | 0.40% | 0.40% | ||
| 14:00 | USD | Existing Home Sales Feb | 5.59M | 5.69M | ||
| 14:30 | USD | Crude Oil Inventories | -0.2M | |||
| 20:00 | NZD | RBNZ Rate Decision | 1.75% | 1.75% |
DAX Fell Below 11900 Support
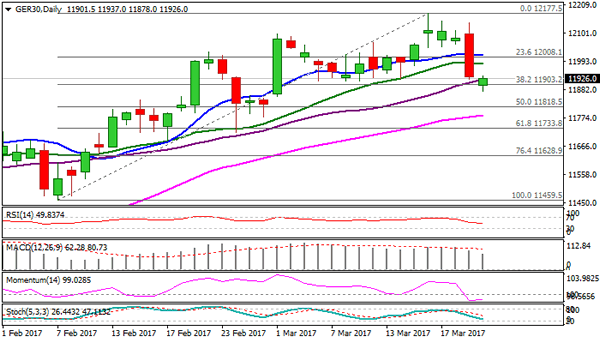
DAX fell below 11900 support (Fibo 38.2% of 11459/12177 rally) on Wednesday, in extension of previous day's strong fall, when the index was down 1.34%.
Near-term studies turned into full bearish mode, while daily technicals are losing traction.
Close below 11900 handle is needed to signal further easing that may extend towards 11818 (50% retracement) and 11785 (55SMA).
The notion is supported by overbought weekly studies and bearish divergence on weekly slow stochastic.
Broken daily Kijun-sen so far caps upside attempts at 11932, with extended upticks expected to stay below daily Tenkan-sen (12027) to keep fresh bears in play.
Res: 11932; 11980; 12027; 12098
Sup: 11878; 11818; 11785; 11733
Canadian Dollar Unable to Gain Ground after Stellar Retail Sales
USD/CAD has edged higher in the Wednesday session. Currently, the pair is trading slightly below the 1.34 line. On the release front, there are no Canadian economic indicators. The US will release Existing Home Sales and Crude Oil Inventories. On Thursday, we'll get a look at unemployment claims.
Canada's retail sales were stellar in January, indicative of a strong increase in consumer spending. Core Retail Sales jumped 1.7%, beating the forecast of 1.3%. This marked the strongest gain since February 2015. Retail Sales sparkled with a gain of 2.2%, compared to an estimate of 1.3%. The strong figures point to a strong first quarter for the economy, and weak retail sales data in December appear to be a seasonal distortion. The Canadian dollar climbed higher immediately after these releases, but was unable to consolidate and ended the Tuesday session almost unchanged.
With little in the way of key fundamentals this week, the markets are focusing on comments from FOMC members who will be speaking this week, including Fed Chair Janet Yellen on Thursday. On Monday, Chicago Fed President Charles Evans said he expects the Fed to raise rates two more times this year. This echoes the Fed's dot point plot as well as last week's rate statement. Although three rate hikes in 2017 would be no mean feat, the markets would like four hikes, given the strong performance of the US economy. The Fed's cautious approach has disappointed the markets, as the US dollar has posted broad losses since the Fed policy meeting. The Canadian dollar jumped on the bandwagon and posted gains last week, although it has reversed directions and dipped lower this week.
Oil Price Remains in Red
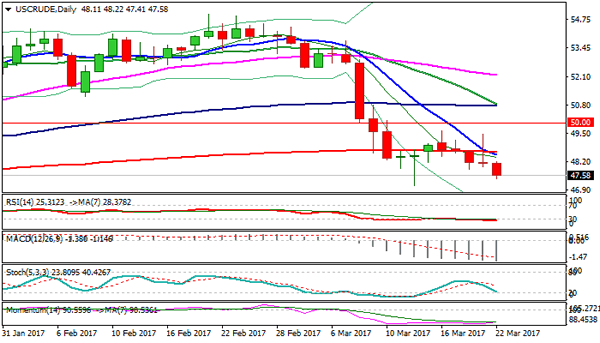
Oil price remains in red since 16 Mar recovery rejection at $49.61, threatening to fully retrace $47.08/$49.61 corrective phase.
Renewed concerns about global oversupply are offsetting OPEC's attempts to curb production, with API report released on Tuesday, showing US crude inventories are rising faster than expected.
From technical point of view, oil price is under increased pressure. Tuesday's bearish candle with very long upper shadow weighs heavily on the market that resulted in fresh bearish acceleration on Wednesday.
Loss of pivotal support at $48.05 (Fibo 61.8% of $47.08/$49.61 recovery leg) generated strong bearish signal, with subsequent weakness taking out $47.68 (Fibo 76.4%) and opening way towards $47.08 (14 Mar spike low, the lowest trade since 30 Nov).
US EIA crude inventories, due today, are closely watched for further signals. Forecast shows build of 2.80 million barrels, compared to previous week's draw of 237K barrels.
Res: 47.83; 48.22; 48.73; 49.46
Sup: 47.41; 47.17; 47.08; 46.11
Markets in Risk Aversion Mode as Trump Trade Unravels
- Indices turn red as blind faith in Trump growth policies fades;
- Gold and yen the winners as traders seek out safe havens;
- EIA inventory data could add to oil woes.
Financial markets have moved into risk averse mode as traders appear to lose faith in Donald Trump's ability to deliver on his ambitious election pledges.
The Trump trade has seen equity markets soar to record highs since November, with investors willing to look beyond some of the more unsavoury aspects of his mandate and instead focus on his growth agenda. However it's now coming to the end of the first quarter and people are starting to question just how long these measures are going to take and whether they'll get through Congress without compromises having to be made along the way.
The difficulties facing Trump over the healthcare bill, something that should have been relatively straightforward for him to get support on given the Republicans staunch opposition to Obamacare, is casting serious doubt over his other policies. A failure to get this through could jeopardise his plans for tax cuts and large infrastructure projects, the very things that investors have strongly bought into since the election.
It seems that the blind faith that investors had in Trump to deliver is starting to fade and the positions are being unwound and if yesterday is anything to go by, we could be in for a sharp correction. None of this is to say that Trump wont eventually follow through on his pledges and if he does, markets will likely reverse course once again. But indices could only go so high before serious questions were going to be asked and if would appear we've now hit that point and the answers simply aren't good enough.
The moves of the last 24 hours are some of the largest we've seen since the election and aside from going in the wrong direction, they've also taken out some technical supports which could further exacerbate the move. The safe havens are currently benefiting from this sudden risk aversion in the markets with Gold making small gains, having already rebounded strongly over the last week on the back of profit taking in the dollar, while the yen is also performing well, taking out technical support against the dollar and strongly testing it against the pound.
With not much to come on the economic data side today, apart from existing home sales, and Fed officials taking a day off from public appearances, the unwinding of the Trump trade may remain the key theme today. We will also get some oil inventory data from EIA, which could add to the woes in Brent and WTI crude, with the former looking to test the psychologically significant $50 mark and trade at levels last seen at the end of November.
Renewed Trump Jitters Rattles Risk Sentiment
The Trump jitters have returned with a vengeance this week with global stocks coming under renewed selling pressure as uncertainty mounts over Donald Trump's proposed economic growth agenda. Asian shares were vulnerable to steep losses during early trading on Wednesday posting their largest drop in two weeks amid the risk-off trading mood. In Europe, no prisoners were taken as the bearish contagion from Asian markets contaminated European equities. With recent reports of the Trump administration facing legislative obstacles to a health care bill sparking concerns over the future of the promised corporate tax cuts, Wall Street may be instore for further punishment this evening.
The growing threat of Donald Trump's proposed pro-growth policies falling short of market expectations may expose stock markets to further downside losses as investors scatter away from riskier assets to safe haven investments.
Dollar Index breaks below 100.00
The terrible mixture of protectionism fears and renewed Trump jitters have exposed the Greenback to steep losses this week with the Dollar Index breaking below 100.00. Bears have effectively exploited the “dovish hike” to attack the Dollar repeatedly with the uncertainty over Trump's economic growth agenda providing a foundation for sellers to install renewed rounds of selling. Although the technical break below 100.00 marks a major turning point in the trend, the downside may be limited in the longer term as sentiment remains bullish towards the US economy.
Dollar bullish investors are in desperate need of inspiration to elevate the Greenback and such may be provided by Yellen this week if she provides a hawkish surprise. From a technical standpoint, the Dollar Index is under intense pressure on the daily charts. Persistent weakness below the 100.00 resistance could encourage bears to send the Index towards 99.50.
Commodity spotlight – WTI
Oil prices were vulnerable to downside shocks on Tuesday with WTI Crude descending towards $48 as the growing concerns over the excessive oversupply in the global markets weighed heavily on sentiment. The bias towards oil is turning increasingly bearish and the fading optimism over the effectiveness of OPEC's supply cut deal has enticed bears to install repeated rounds of selling.
WTI crude may be instore for further punishment moving forward with production in the United States rising consistently and the inflated inventories simply counteracting the efforts of OPEC to stabilize the oil markets. Although most remain somewhat optimistic over OPEC extending its six-month contract, the resurgence of U.S shale coupled with concerns of some members not fully respecting the compliance in cutting production could obstruct the deal.
Much attention may be directed towards the pending EIA data this evening which could expose oil prices to further losses if crude stocks build. From a technical standpoint, the fact that oil markets remain subdued despite the Dollar's vulnerability continues to highlight how bone-deep the oversupply concerns have become. A breakdown below $48 on WTI Crude could encourage sellers to send prices lower towards $47.00.
Currency spotlight – USDJPY
The growing appetite for safe-haven assets amid the Trump jitters has boosted the Yen's allure on Wednesday with the USDJPY sinking below 111.60. The currency pair is coming under noticeably pressure on the daily charts with the break below 111.60 potentially providing permission for bears to drag prices lower towards 111.00. If the Dollar continues to depreciate and risk aversion intensifies, then the bearish combination could provide enough inspiration for sellers to look beyond 111.00. From a technical standpoint, weakness below 111.60 could act as encouragement for bears to eye 111.00 and potentially lower.