Sample Category Title
SP500 Gap Filled
Our S&P 500 bonus chart from yesterday's blog featured a daily gap that price was stalking before the futures open.
S&P 500 Daily:
I've featured only a daily chart above, but if you're an indices trader on MT4 then you can open up your own charts and check the intraday price action yourself.
After a brief rally throughout Asia, price then dumped down into the gap where it found immediate support and buyers along with it.
The Beat Goes On
The Beat Goes on
Most asset classes have recouped their Trump inspired shake out, but this could be little more than markets coming up for air, short covering extreme positions along with dealers digging in for the long haul as, by historical accounts, this Special Counsel' investigation is likely to be an agonisingly long process of discovery. Predictably, this notion has tempered the markets animated response to the Trump inspired panic seen Wednesday. However given the heightened level of uncertainty, I suspect traders will remain in a kind of Investor Purgatory where risk aversion dominates and fear mounts that the investigation could open up a whole new can of worms which will do little more than compound the markets current panic syndrome.
This politically charged risk averse market took a further hit when Brazil spiralled into turmoil after bribery allegations involving current President Michel Temer surfaced. While I view this as a Brazil-centric affair, there has been a higher level of chatter and debate about the MXN peso role in this incident and to what extent investors could or should use it to hedge LATAM exposure. During the initial panic, USDMXN traded to 19.20 when the BRL panic was raging but has since recovered. Jury is out on this one
Overall USDJPY and EURUSD continue to dominate the highlight reels where volumes are running well above average on both pairs
US Dollar
Dealers mustered up the courage to rally the dollar when the street started sharing a dated CSPAN videos( May 3) of a Comey testimony. When under oath he suggests there was no inappropriate coverup made by the president. But the markets were quick to accept the video was dated and that the Attorney General has already viewed it before nominating the special counsel. Nonetheless, it's another ball in the air for traders to juggle deciphering an outcome that quite frankly is little more than a guessing game.
The US remains completely engulfed in the Trump Comey storyline, and the USD will continue to be unalluring until further clarity is forthcoming on the special investigation
Japanese Yen
The market is stabilising on USDJPY which would appear contradictory for those positioned for the world's haven currency to further strengthen on the Trump noise. The small reprieve was likely due to the murmur around Japanese equities that bounced on a positive domestic GDP print and some profit taking. While there will continue to be some scope of influence from both US and Japan economic data, it's more likely dollar rallies will be capped until the US political storm clouds dissipate and some semblance of risk re- appears
Euro
Asset rotation into Europe should continue to provide support while US political decay plays into the Euro as a haven poxy We should expect lots of choppiness as the risk complex will likely bounce from stable to unsettle on any given day. But the key for and additional push higher in the Euro will require a hawkish shift in ECB forward guidance.The latest ECB minutes failed to accomplish that task
Australian dollar
With US political factors weighing on risk sentiment, it's unlikely dealer will muster up the courage to make any serious attempt higher in this risk off environment. The market appears to be viewing the Aussie dollar as a flat out commodity play, but dealers will continue to monitor the Fed June interest rate hike probabilities as the current market turmoil will not go unnoticed by Dr Yellen and company
Asia FX
Far too much uncertainty in the short term market which will see dealers either keeping inventory light or head the sidelines awaiting the next catalyst. Risk sentiment is simply not there to support EM, but if the US political angst morphs into a US-centric focus, then the opportunistic flow will gradually return.Currently, the markets remain in risk-averse mode but are acting quite orderly.
Gold Dips As US Posts Strong Inflation, Manufacturing Reports
Gold has reversed directions in the Thursday session and posted losses. In the North American session, spot gold is trading at $1251.18 per ounce. On the release front, US numbers were solid, as unemployment claims dropped to 232 thousand, lower than the forecast of 240 thousand. As well, the Philly Fed Manufacturing Index soared to 38.8, crushing the forecast of 19.9 points. In Washington, Treasury Secretary Steven Mnuchin testifies before the Senate Banking Committee on the rollback of the Dodd-Frank finance regulations.
Gold has gained 1.5% this week, as the safe-haven commodity has benefited from the political chaos which has gripped Washington. The beleaguered Trump administration appears to be rudderless as it staggers from crisis to crisis. The latest development is that the Justice Department has agreed to appoint a former FBI director as special counsel to investigate possible Russian involvement in the US presidential election as well as any connection between Trump and the Russians during the election campaign. On Tuesday, reports surfaced that Trump had asked former FBI director James Comey to close an investigation into ties between Russia and Trump's former security adviser, Michael Flynn, leading some lawmakers to question whether Trump had committed obstruction of justice. As if this wasn't enough for Trump's aides to deal with, the president is under fire for passing classified intelligence to the Russian foreign minister. Trump initially denied the claim, but has since admitted that he did share intelligence with the Russians, arguing that he had acted within his rights. With the Trump administration frantically trying to douse political fires, investors are concerned that Trump will have more difficulty passing into law his plans for increased stimulus and tax reform. If the crisis mode in Washington continues, we could see gold make further gains against the dollar.
The Post-Truth Trade
Maybe the dollar rally late Thursday had nothing to do with politics, maybe it was an obscure fundamental headline, or flows or a fat finger in cable that morphed into a broad USD bid. 5 straight daily declines in the currency of the world's strongest economy may have a been excessive. Any of that would be a comforting explanation because the alternative is that an Infowars/Zerohedge fake news story was responsible for the move, and that would mean that markets have now been enveloped by the post-truth world.
The US dollar was the top performer while the New Zealand dollar lagged. The Asia-Pacific calendar is light. Above is the chart of strongest and weakest currencies vs the USD since the start of the year and the month.
There has been a push-and-pull between politics and fundamentals since the election but fundamentals were winning out. On Wednesday, however, politics took over and it continued Thursday. It started with a gotcha story from Reuters saying Trump's campaign team had at least 16 more undisclosed contacts with Kremlin associates. That set off a round of risk aversion but it slowly faded because the story indicated that the calls were about the kind of things that politicians should be discussing– China, general relations and North Korea.
Skip ahead a few hours and the Infowars/ZeroHedge story begins to circulate. The headlines stated Comey had indicated no one had tried to pressure him to end an investigation on May 3. At the same time, cable flash crashed 100 pips, the dollar started to catch a broad bid and stocks rallied.
Delving deeper the actual clip, Comey was asked if anyone at the Department of Justice had asked the FBI to end an investigation. He wasn't talking about the White House.
It's unfair to lump Reuters with the other sources but the effects were the same. That says something profound about markets.
Untruth is nothing new to markets. There is always a rumour about a corporate takeover or bankruptcy but when you chase a rumour and it's wrong, you're punished. With political rumours it doesn't matter if they turn out to be true or false.
We're confident that fundamentals will ultimately win out – they always do. In the meantime, we're all stuck reading fringe political websites trying to figure out what the average voter will believe is true and false.
Pound Punches Above 1.30 as UK Retail Sales Sparkles
GBP/USD has recorded slight gains in the Thursday session. In North American trade, GBP/USD is trading at the 1.30 line, for the first time since September 2016. On the release front, UK Retail Sales jumped 2.3%, well above the forecast of 1.2%. Over in the US, jobless claims and manufacturing numbers were strong, as unemployment claims dropped to 232 thousand, lower than the forecast of 240 thousand. As well, the Philly Fed Manufacturing Index soared to 38.8, crushing the forecast of 19.9 points. In Washington, Treasury Secretary Steven Mnuchin testifies before the Senate Banking Committee on the rollback of the Dodd-Frank finance regulations.
British consumer spending has been soft in recent weeks, so the April retail sales report was welcome news. The indicator posted a sharp gain of 2.3%, its strongest monthly gain since January 2016. The British economy has performed fairly well since the Brexit vote last June, but gray clouds remain on the not-too-distant horizon. Analysts expect the economy to lose steam once the thorny negotiations over Britain's exit from the European Union begin. The Bank of England has been saying that Britons will have to get used to a lower standard of living, and the warning has become reality with the release of the latest wage growth report on Wednesday. Wages rose 21% year-on-year in the first quarter, resulting in real wages dropping for the first time since 2014, after adjusting for inflation. CPI, the primary gauge of consumer inflation, continued to move upwards, posting a sharp gain of 2.7% in April, matching the BoE forecast for inflation in the first quarter. This reading marked the strongest gain in CPI since September 2013. The BoE is expecting inflation to hit 3 percent, raising speculation that the central bank may raise interest rates to keep inflation under control. The weak pound, which is still down 13% since the Brexit vote, has contributed to higher inflation, which has hurt wage growth and caused consumers to scale back on spending, a key component of economic growth.
The political chaos which has gripped Washington has led to nervous investors dumping US dollars, in favor of its rivals, such as the British pound. The beleaguered Trump administration appears to be rudderless as it staggers from crisis to crisis. The latest development is that the Justice Department has agreed to appoint a former FBI director as independent counsel to investigate possible Russian involvement in the US presidential election as well as any connection between Trump and the Russians during the election campaign. On Tuesday, reports surfaced that Trump had asked former FBI director James Comey to close an investigation into ties between Russia and Trump's former security adviser, Michael Flynn, leading some lawmakers to question whether Trump had committed obstruction of justice. As if this wasn't enough for Trump's aides to deal with, the president is under fire for passing classified intelligence to the Russian foreign minister. Trump initially denied the claim, but has since admitted that he did share intelligence with the Russians, arguing that he had acted within his rights. With the Trump administration frantically trying to douse political fires, investors are concerned that Trump will have more difficulty passing into law his plans for increased stimulus and tax reform. If the crisis mode in Washington continues, we could see the dollar lose more ground.
Oil Market and US Turmoil Biggest Driver as Loonie Awaits Sales and Inflation Data
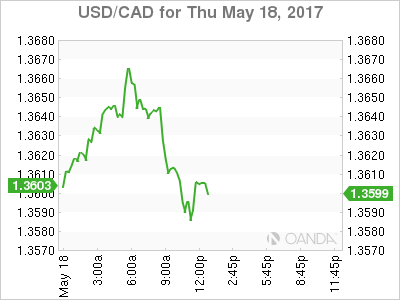
The Canadian dollar has had a volatile week. On Wednesday afternoon the loonie broke through the USD/CAD 1.36 price level but a sudden drop during the Asian session on Thursday put the CAD under pressure. The Canadian currency depreciated and the pair touched 1.3670, the daily high, before it appreciated to current levels (1.3605).
The USD dollar is mixed against major pairs. The pound, loonie and Aussie are gaining, while the Swiss franc, kiwi, euro and yen are in negative territory. With little fundamental data to go on the greenback has been traded on political risk and the potential damage to the American economy. Global stock markets have lost momentum as the developing story on the Trump administration continues to unfold.
The political turmoil in Washington is making it less likely that the pro-growth policies promised after the election will be enacted. Tax reform and infrastructure spending were top of the economic agenda, but were pushed down in favor of immigration and healthcare reform which proved to be too divisive. The Trump administration is running out of political capital and scandals will sap it even more.
The USD/CAD lost 0.074 in the last 24 hours. The pair is trading at 1.3605 after the oil rally lost momentum but US political drama has the USD on the back foot. The U.S. Federal Reserve was probably counting on strong reforms in the first half of the year with a Republican president in the White House and a Republican majority in the House and Senate. Fed officials are still optimistic about multiple rates hikes as per their comments, but the markets have begun to price out a move but the central bank in June. Last week the probability calculated by the CME in their FedWatch tool was 83.1 percent and today it stands just below 70 percent.
Retail sales and inflation data will be released on Friday, May 19 at 8:30 am. The latest economic data out to Canada has disappointed and the warning signs of an overheated real estate market have cause downgrades to the otherwise solid Canadian banks. Manufacturing sales were close to the forecast with a 1 percent growth and are preparing the market for an improvement on the retail numbers. Retail sales are forecasted to have gained 0.4 percent and the core data 0.2 percent. Inflation numbers are also expected higher at 0.5 percent. The biggest Canadian economy question that remains for the most part unanswered is its future trade relationship with the United States. Which more than three quarters of products going to the US there is a lot riding on the NAFTA negotiations. The Trump administration has been on the offensive since taking office and America first will be something that Canada will have to negotiate down from.
Prime Minister Justin Trudeau was in Seattle to attend a Microsoft CEO summit. Finance Minister Bill Morneau and Bank of Canada (BoC) Governor Stephen Poloz met with their counterparts during the G7 meeting in Italy last week and the topic is sure to have been brought up. Canada has also added more communication with Mexico in order to create a united front when negotiating with the US in last August.
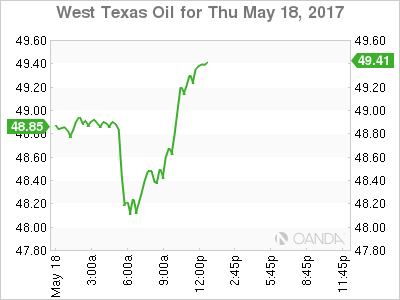
Oil is down 0.68 in the last 24 hours. The price of West Texas Intermediate is trading at $48.66 after investors remain unconvinced the efforts of the Organization of the Petroleum Exporting Countries (OPEC) to extend its production cut agreement will be enough to rebalance the energy market. US production in particular has soared as current price levels are high enough for shale operations.
The price of crude is suffering as the political drama in Washington has investors are uncertain on the outcome and the far reaching implications for the growth of the US economy.
Market events to watch this week:
Thursday, May 18
- 4:30 am GBP Retail Sales m/m
- 8:30 am USD Unemployment Claims
Friday, May 19
- 8:30 am CAD CPI m/m
- 8:30 am CAD Core Retail Sales m/m
Yen Climbs as Japanese GDP Beats Estimate
USD/JPY has steadied in the Thursday session, after the yen posted strong gains in Wednesday trade. In the North American session, the pair is trading at the 111 level. On the release front, Japanese Preliminary GDP in the first quarter improved to 0.5%, edging above the forecast of 0.4%. US numbers were strong, as unemployment claims dropped to 232 thousand, lower than the forecast of 240 thousand. As well, the Philly Fed Manufacturing Index soared to 38.8, crushing the forecast of 19.9 points. In Washington, Treasury Secretary Steven Mnuchin will testify before the Senate Banking Committee on the rollback of the Dodd-Frank finance regulations.
It's been an excellent week for the Japanese yen, which has recorded strong gains of 2.0 percent. The safe-haven yen has become a favorite for nervous investors, as the political turmoil which has gripped Washington has soured investors on the stock markets and the greenback. The yen's gains mirror continuing trouble for the Trump administration, which is lurching from crisis to crisis. The latest development is that the Justice Department has agreed to appoint a former FBI director as independent counsel to investigate possible Russian involvement in the US presidential election as well as any connection between Trump and the Russians during the election campaign. On Tuesday, media reports surfaced that Trump asked former FBI director James Comey to end an investigation into ties between Russia and Trump's former security adviser, Michael Flynn. Adding to Trump's troubles, the president is under fire for passing classified intelligence to the Russian foreign minister. Trump initially denied the claim, but has since admitted that he did share intelligence with the Russians, arguing that he had acted within his rights. With the Trump administration frantically trying to douse political fires, investors are growing increasingly nervous that Trump's plans for a stimulus package and tax reform will stall, and these jitters have sent stock markets downwards.
What's next for the Bank of Japan? More of the same, according to BoJ Governor Haruhiko Kuroda. On Wednesday, Kuroda said that he was confident that the central bank could smoothly exit from its huge monetary stimulus at a time of its choosing, but noted that wages and inflation remained sluggish, despite a stronger economy. Kuroda added that the central bank had no plans to revise its monetary stance, and said that the Federal Reserve's tightening stance would not affect the monetary stance of the BoJ. Stronger global demand has boosted Japan's manufacturing and export sectors, but inflation is stuck around zero percent and consumer spending remains soft. We'll get a look at Tokyo Core CPI and other inflation indicators next week. If the economy continues to improve and inflation numbers exceed expectations, the BoJ may have to revisit its ultra-loose monetary stance.
Japanese Economy Extends Winning Streak in Q1
A better-than-expected print for first quarter Japanese GDP growth extends the longest winning streak there since 2006, although still-soft CPI likely means continued accommodation from the Bank of Japan.
Kampai…Longest Growth Stretch in 11 Years
The Japanese economy expanded at an annualized pace of 2.2 percent in the first quarter. Not only was that the fastest pace of growth since the first quarter of last year, it also marks the fifth consecutive quarterly expansion - the longest stretch of uninterrupted growth in Japan since 2006.
The growth rate came from broadly based support. The largest overall positive contributor came from consumer spending which grew at an annualized rate of 1.4 percent, enough to add 0.8 percentage points to the overall growth rate. Going into today's release, we already knew that retail sales in Japan had strung together three straight monthly increases which had lifted the yearly growth rate for store sales to the fastest pace since April 2015. In fact the surge in April of 2015 had to do with the 2014 implementation of a consumption tax hike which suppressed spending in April 2014. While there is no perfect way to adjust for the impact of the tax, the takeaway here is that consumers in Japan are spending again at a pace not seen in years.
Consumers are not the only ones feeling a bit more confident. The Tankan survey of large manufacturers rose in the first quarter to its fastest pace of expansion since 2015. That confidence has manifested itself in today's GDP report in the form of increased business spending. Admittedly, the 1.0 percent annualized pace of growth for business outlays is hardly overwhelming but, it marks the third consecutive quarterly increase - the longest winning streak for cap-ex since 2014.
Who's Done With TPP?
The United States backing out of the Trans Pacific Partnership (TPP) was a blow to Japanese trade prospects, although the world's third largest economy is benefitting from trade even without that trade partnership. Japanese exports swelled again in the first quarter and even though imports also increased at the fastest pace in two years, net exports added half a percentage point to the first quarter's overall growth rate.
A factor in Japan's trade strength could be a Chinese boycott of South Korean goods and a resulting shift to Japan. Japan's exports to China surged by the most in two years in February and rose again in March.
FX and Monetary Policy
The risk-off sentiment in recent days has pushed the yen higher as periods of pronounced market risk often will, but our base case scenario is for continued yen weakness over time. Despite this better-than-expected GDP report, inflation moved further away from the central bank's target in March suggesting a continued dovish policy bias from the Bank of Japan.
CRUDE OIL: Risk Turns Higher On Trend Resumption
CRUDE OIL: With the commodity threatening further upside, more strength is likely in the days ahead. On the downside, support resides at the 48.00 level where a break will expose the 47.50 level. A cut through here will set the stage for a run at the 47.00 level. Further down, support resides at the 46.50 level. On the upside, resistance resides at the 49.00 level. Further out, resistance comes in at the 49.50 level. A break above here will aim at the 50.00 level and then the 50.50 level followed by the 51.00 level. All in all, CRUDE OIL remains biased to the upside on further
Technical Outlook: Spot Gold Pulled Back from Fresh Two-Week High
Spot Gold pulled back from fresh two-week high at $1265 on Thursday, trimming strong gains of the previous day, when yellow metal surged nearly 2% after political crisis broke out in the US.
Strong fall of dollar on political uncertainty over raising doubts whether US president Trump will be able to follow through with his campaign promises on tax cuts and fiscal stimulus, increased demand for safe haven assets and boosted gold price.
Wednesday's rally broke above $154 pivot (daily Kijun-sen) and cracked next target at $1264 (Fibo 61.8% of $1295/$1214 descend), generating bullish signals, but the rally showed signs of fatigue.
Gold price eased on profit-taking and dollar managing to consolidate after previous day's losses, threaten to extend pullback.
Scenario is supported by overbought slow stochastic on daily chart and RSI turning south.
Former strong resistances at $1245 zone (daily cloud top / converged 20 / 200 / 55 SMA's) now act as strong support which should ideally contain correction and keep near-term bulls intact.
Otherwise, stronger correction of $1214/$1265 rally could be expected on sustained break below this support.
Res: 1254; 1260; 1265; 1270
Sup: 1249; 1245; 1240; 1236