
Sample Category Title
USD/CHF Daily Outlook
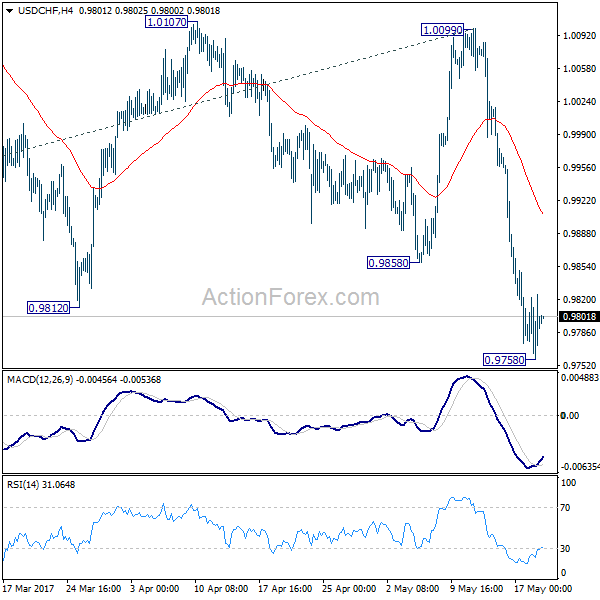
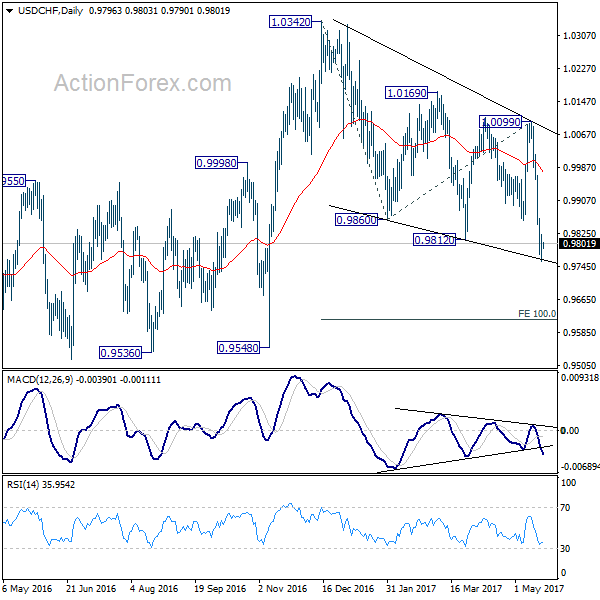
Daily Pivots: (S1) 0.9763; (P) 0.9793; (R1) 0.9828; More.....
With 4 hour MACD crossed above signal line, a temporary lot is in place at 0.9758. Intraday bias in USD/CHF is turned neutral first. Some consolidation would be seen but upside of recovery would be limited by 4 hour 55 EMA (now at 0.9907) to bring another fall. Break of 0.9758 will extend the whole fall from 1.0342 towards 100% projection of 1.0342 to 0.9860 from 1.0099 at 0.9617.
In the bigger picture, USD/CHF is bounded in medium term range of 0.9443/1.0342 for the moment. Consolidative trading would likely continue and medium term outlook remains neutral. Break of 1.0342 key resistance is needed to confirm underlying bullish momentum in the pair. Meanwhile, downside attempts should be contained by 0.9443 key support level.
USD/JPY Daily Outlook
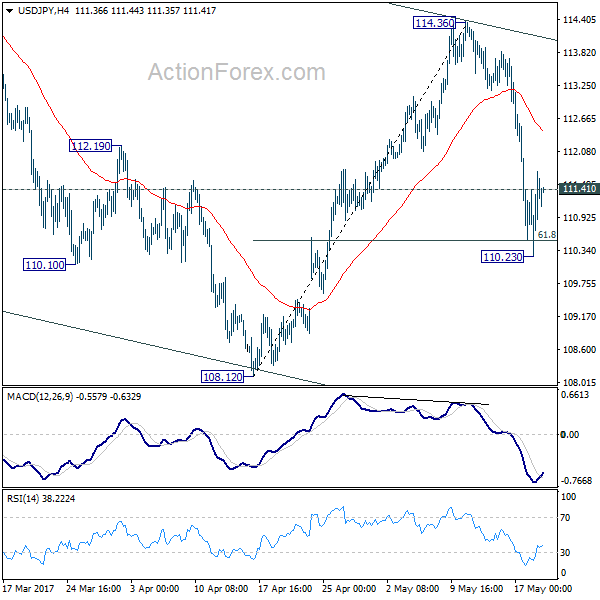
Daily Pivots: (S1) 110.56; (P) 111.14; (R1) 112.06; More...
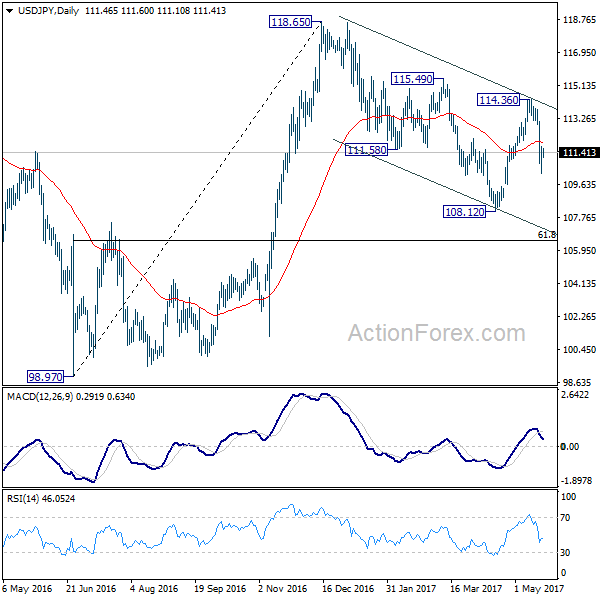
A temporary low is in place at 110.23 after USD/JPY drew support from 61.8% retracement of 108.12 to 114.36 at 110.50. Intraday bias is turned neutral first. As recovery from 110.23 is corrective in structure, we'd favor more downside ahead. Below 110.23 will turn bias to the downside for 108.12 low. In that case, the whole decline from 118.65 would likely extend through 108.12 to 61.8% retracement of 98.97 to 118.65 at 106.48.
In the bigger picture, price actions from 125.85 high are seen as a corrective pattern. It's uncertain whether it's completed yet. But in case of another fall, downside should be contained by 61.8% retracement of 75.56 to 125.85 at 94.77 to bring rebound. Overall, rise from 75.56 is still expected to resume later after the correction from 125.85 completes.
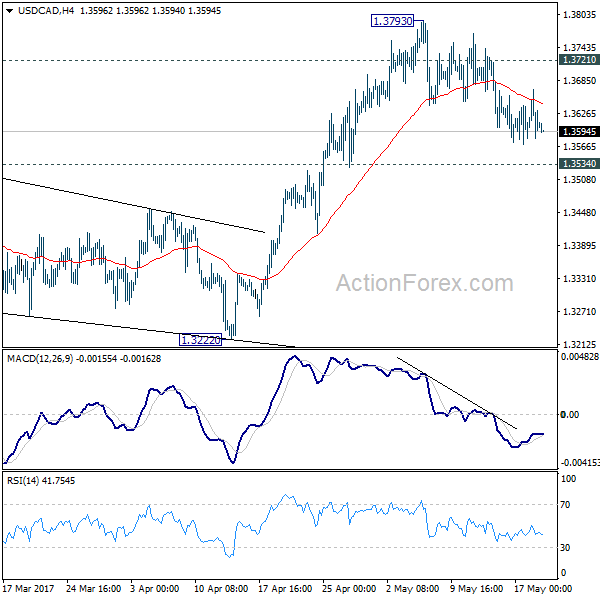
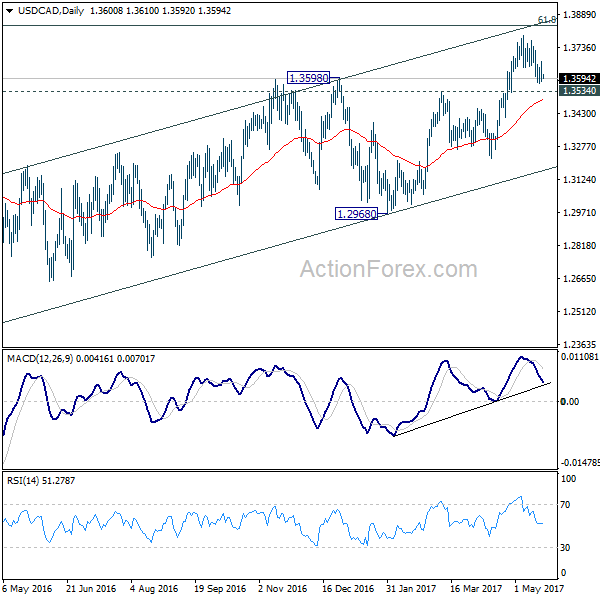
USD/CAD Daily Outlook
Daily Pivots: (S1) 1.3563; (P) 1.3616; (R1) 1.3654; More....
No change in USD/CAD's outlook. With 1.3721 minor resistance intact, deeper fall is expected to 1.3534 resistance turned support. Break there should confirm completion of the rise from 1.2968 and target 1.3222 support next. On the upside, above 1.3721 will turn bias back to the upside and target 1.3793 and above. However, as noted before, choppy rise from 1.2460 is seen as a corrective move. In case of an extension, upside should be limited by 1.3838 fibonacci level to bring reversal.
In the bigger picture, price actions from 1.4689 medium term top are seen as a correction pattern. The first leg has completed at 1.2460. Rise from 1.2460 is seen as the second leg and would end at around 61.8% retracement of 1.4689 to 1.2460 at 1.3838. Break of 1.3222 should indicate the start of the third leg while further break of 1.2968 should confirm. Nonetheless, sustained trading above 1.3838 would pave the way to retest 1.4689 high.
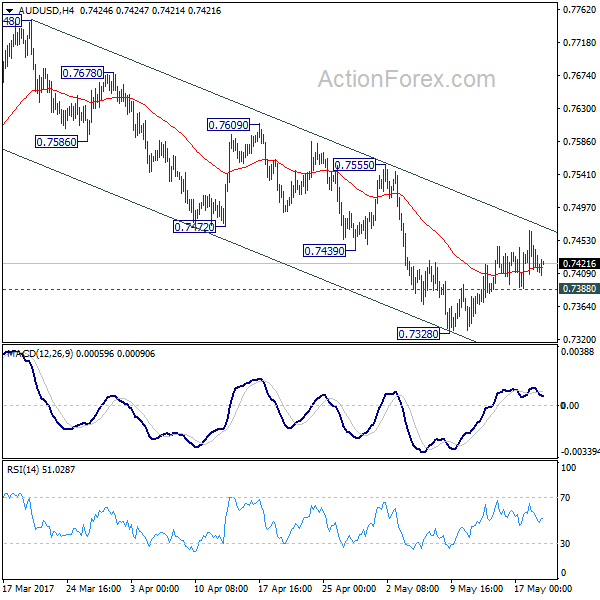
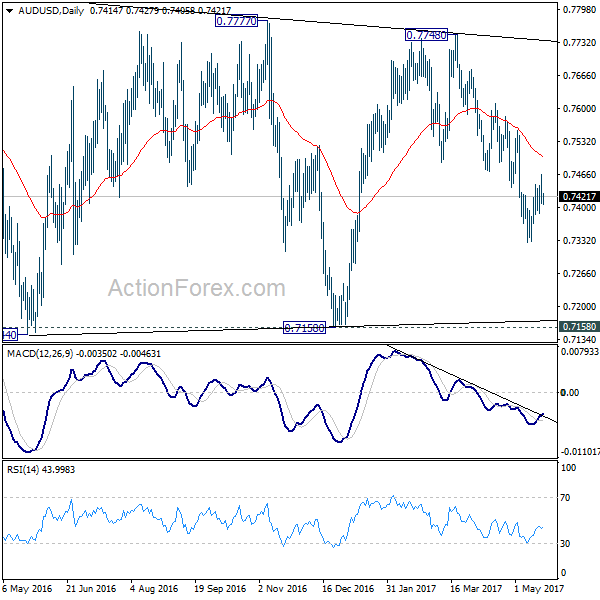
AUD/USD Daily Outlook
Daily Pivots: (S1) 0.7396; (P) 0.7431; (R1) 0.7454; More...
No change in AUD/USD's outlook as corrective recovery from 0.7382 extends. While further rise cannot be ruled out, upside should be limited below 0.7555 resistance and bring fall resumption. Below 0.7388 minor support will turn bias to the downside for 0.7382. Break there will extend the fall from 0.7748 and target 0.7144/7158 support zone. On the upside, firm break of 0.7555 will argue that fall from 0.7748 is completed and turn bias back to the upside.
In the bigger picture, we're still treating price actions from 0.6826 low as a correction pattern. And, as long as 38.2% retracement of 0.9504 to 0.6826 at 0.7849 holds, long term down trend from 1.1079 is expected to resume sooner or later. Break of 0.6826 low will target 0.6008 key support level. However, firm break of 0.7849 will indicate that rise from 0.6826 is developing into a medium term rebound, rather than a sideway pattern. In such case, stronger rise should be seen to 55 month EMA (now at 0.8115) and above.
Dollar Recovered Mildly as Market Stabilized from Trump Turmoil, But Stays Weak
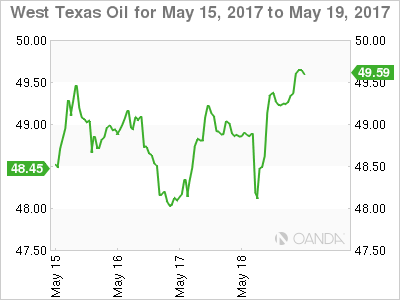
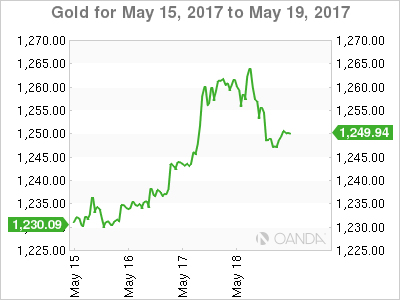
Dollar recovered mildly as markets calmed down from US President Donald Trump's political turmoil. But the greenback is still set to end the week as the weakest major currency. DOW also recovered overnight by adding 56.09 pts, or 0.27% to close at 20663.02 after suffering -372.8 pts loss on Wednesday. S&P 500 was up 8.69 pts or 0.37%, NASDAQ up 43.89 pts or 0.73%. 10 year yield also pared some loss and ended up 0.017 at 2.233, but was well off this month's high at 2.423. Gold retreats mildly after hitting as high as 1265 and is back below 1250 handle. WTI crude oil extended recent rise to 49.88 and is set to take on 50 handle today. In the currency markets, Swiss Franc and Japanese Yen remain the strongest ones on global risk aversion. That's closely followed by Euro as the third strongest, on optimism over Eurozone economy and anticipate of a hawkish twist in June ECB meeting. Commodity currencies are indeed generally weak with Kiwi and Aussie trading as the second and the third weakest ones.
Fed still expected to hike in June
Dollar is helped mildly by the fact that traders calmed from the market volatility. There reached a point that the markets were starting to pare back bet on a June Fed hike. But it's still generally agreed that Fed will go on with it in spite of the current turmoil. Fed fund futures are pricing in 73.8% odd of a June hike, up from yesterday's 64.6%, even though it's off of last week's pricing at 83.1%. And it should be noted again that various Fed officials have repeatedly mentioned that the fiscal polices are not taken into consideration in their own economic projections. That is, the current expectation of a total of three hikes this year is fiscal policy neutral.
SNB Jordan: Expansive monetary policy needed
In a newspaper interview published yesterday, SNB Chairman Thomas Jordan said that the Swiss Franc is still "significantly overvalued". And therefore, "negative interest rates and our readiness to intervene in the forex markets remain necessary". Also, "the overvalued franc, the underutilisation of production capacity and low inflation make it necessary for us to stick to our expansive monetary policy." The Swiss Franc is trading as the strongest major currency this week on risk aversion. However, EUR/CHF is held above 1.0872 support so far and well above 1.0620 key support. The cross has indeed surged sharply after French President Emmanuel Macron's win in the election. Subsiding political risks in Europe will keep supporting EUR/CHF and relief pressure from SNB for more intervention.
Credit Suisse expects multiple RBA cuts this year
AUD/USD is steady in tight range this week in spite of violent volatility elsewhere. The stronger than expected employment data released yesterday just provided very brief support. Some economists are doubtful on the accuracy of the data. Credit Suisse pointed out that while the headline job number surged, full time jobs has indeed fallen. Overall job growth was 37.4k, with 49.0k growth in part time jobs. That is, full time jobs shrank by -11.6k. And the weakness in the data could be larger if not for statistical distortions. The overall output gap is historically consistent with another rate cut. And Credit Suisse said there is a case for "multiple cuts" this year.
On the data front...
Germany will release PPI in European session, Eurozone will release current account and UK will release CBI trends total orders. Canadian data will be the focus today with retail sales and CPI featured in US session.
AUD/USD Daily Outlook
Daily Pivots: (S1) 0.7396; (P) 0.7431; (R1) 0.7454; More...
No change in AUD/USD's outlook as corrective recovery from 0.7382 extends. While further rise cannot be ruled out, upside should be limited below 0.7555 resistance and bring fall resumption. Below 0.7388 minor support will turn bias to the downside for 0.7382. Break there will extend the fall from 0.7748 and target 0.7144/7158 support zone. On the upside, firm break of 0.7555 will argue that fall from 0.7748 is completed and turn bias back to the upside.
In the bigger picture, we're still treating price actions from 0.6826 low as a correction pattern. And, as long as 38.2% retracement of 0.9504 to 0.6826 at 0.7849 holds, long term down trend from 1.1079 is expected to resume sooner or later. Break of 0.6826 low will target 0.6008 key support level. However, firm break of 0.7849 will indicate that rise from 0.6826 is developing into a medium term rebound, rather than a sideway pattern. In such case, stronger rise should be seen to 55 month EMA (now at 0.8115) and above.
Economic Indicators Update
| GMT | Ccy | Events | Actual | Forecast | Previous | Revised |
|---|---|---|---|---|---|---|
| 06:00 | EUR | German PPI M/M Apr | 0.20% | 0.00% | ||
| 06:00 | EUR | German PPI Y/Y Apr | 3.20% | 3.10% | ||
| 08:00 | EUR | Eurozone Current Account (EUR) Mar | 37.9B | |||
| 10:00 | GBP | CBI Trends Total Orders May | 4 | 4 | ||
| 12:30 | CAD | Retail Sales M/M Mar | 0.30% | -0.60% | ||
| 12:30 | CAD | Retail Sales Less Autos M/M Mar | 0.20% | -0.10% | ||
| 12:30 | CAD | CPI M/M Apr | 0.50% | 0.20% | ||
| 12:30 | CAD | CPI Y/Y Apr | 1.70% | 1.60% | ||
| 12:30 | CAD | CPI Core - Common Y/Y Apr | 1.40% | 1.30% | ||
| 12:30 | CAD | CPI Core - Trim Y/Y Apr | 1.40% | |||
| 12:30 | CAD | CPI Core - Median Y/Y Apr | 1.70% | |||
| 14:00 | EUR | Eurozone Consumer Confidence May A | -3 | -4 |
Elliott Wave View: FTSE 100 Correcting Lower
Short Term Elliott Wave view in FTSE 100 Index suggests the rally from 4/20 low (7096.6) is unfolding as a zigzag Elliott Wave structure where Minute wave ((a)) ended at 7302.57 and Minute wave ((b)) ended at 7197.28. Subdivision of Minute wave ((a)) is unfolding as an impulse where Minuttte wave (i) ended at 7134.53, Minutte wave (ii) ended at 7104.22, Minutte wave (iii) ended at 7290.82, Minutte wave (iv) ended at 7262.32, and Minutte wave (v) of ((a)) ended at 7302.57. FTSE 100 has Index since broken above 7302.57 suggesting Minute wave ((c)) has started.
Minute wave ((c)) is unfolding as an ending diagonal where Minutte wave (i) ended at 7280.7, Minutte wave (ii) ended at 7222.81, Minutte wave (iii) ended at 7460.20, and Minutte wave (iv) ended at 7435.64. Index has reached 1.618 extension of the Minute ((a)) – ((b)) and thus cycle from 4/20 low is mature and we are calling Minor wave 1 completed at 7533.7. While the bounces stay below 7533.7, expect FTSE 100 Index to correct cycle from 4/20 low within Minor wave 2 in 3, 7, or 11 swing before the rally resumes. We don’t like selling the proposed pullback and expect buyers to appear again when Minor wave 2 pullback is over in 3, 7, or 11 swing.
FTSE 100 Index 1 Hour Elliott Wave Chart
Oil Could Be Setting Up For Another Slide
Key Points:
- The recent oil rally seems to be running out of steam.
- Technical bias is firmly favouring a reversal.
- OPEC meeting is drawing nearer which could see heightened volatility.
We have seen oil prices make a substantial recovery over the past few weeks, largely erasing the rout following a breakout from the long-term rising wedge structure. Nevertheless, we are reaching what could be a near-term peak for the commodity as the technical bias is once again being felt and capping upsides.
Specifically, the downside constraint of that wedge is once again in sight but, this time, it is likely to be presenting substantial resistance as opposed to support. Due to this, we expect to see the current rally stall shortly, especially given that 61.8% Fibonacci level is drawing nearer and is also intersecting the trend linejust above the commodity's current price. However, whilst this is a strong argument for a cap on gains, it doesn't necessitate the decline in prices that we have forecasted on the below chart.
Fortunately, we can look to a number of other technical readings and see that, in fact, we may indeed be about to enter yet another period of notable losses. In particular, the movement of the stochastics into overbought territory is suggesting that some selling pressure is needed in fairly short order. Furthermore, we can also see that, despite the recent upswing, the EMA configuration is highly bearish and the 100 day average is also well positioned to reinforce resistance around the 49.73 handle.
If the above technical forecast does ring true, we can expect to see losses extend to around the 46.03 level. At this price, the combination of a historical reversal point and the 23.6% Fibonacci level should prove to be a near-term trough for oil. Of course, this assumes that OPEC's attempts to collude don't implode spectacularly in the interim – an outcome that isn't entirely impossible. If we do have such a breakdown in the cartel's coordination, we might see the commodity well and truly below the $45 mark fairly rapidly.
Ultimately, keep an eye on oil as it has been offering some fairly reliable technical moves over the past few weeks and it is likely to be in focus given that the OPEC talks are coming up next week. This could mean additional volatility is on the cards which presents an opportunity to net some pips amid the heightened headline risk.
Australian Unemployment Decline Surprises Market
Key Points:
- Australian unemployment rate declines to 5.7%.
- Part time employment numbers rising.
- Watch for the RBA to hold rates steady at the next meeting.
The latest release of Australian Unemployment data has largely caught economists, and by extension the market, sharply by surprise. In fact, rather than coming in at the forecasted 5.9% the unemployment rate actually declined to 5.7% in April. Subsequently, the labour market appears to be going through resurgence but just how robust the current gains are remains to be seen.
The employment change figures for April showed a gain of around 37.4k jobs, which followed on from a rise of 60k in March. Obviously, this is a welcome strengthening of the labour market and should lead to some inflationary gains over the medium term. However, the headline rate was a little less impressive with full time positions declining by nearly 11.6k in April. Subsequently, the rise in part-time employment is a relatively concerning trend in the Australian economy.
In fact, the total hours worked metric declined by around 0.3% whilst part time employment has risen by over 111,300 positions in the past year. This all highlights the underlying reasons why the unemployment rate and job gain figures can be somewhat misleading. It also goes some of the way to explaining why there has been little in the way of systemic inflation over the past year, despite some strong gains in the employment numbers.
However, despite the employment figures being somewhat unreliable as an macroeconomic indicator, the results are likely to be noticed by the Reserve Bank of Australia (RBA). In fact, there is a view that the recent gains may actually see the central bank delaying a potential cut to interest rates given the risk of inflationary pressures arriving down the line.
Subsequently, the next RBA meeting is likely to see the central bank holding rates at 1.50% for the tenth consecutive meeting. Lending further support to this view is the increasing domestic debt levels, largely to do with the housing bubble, that the central bank are very clearly concerned with. Subsequently, cutting rates further, and by extension, providing a looser credit environment is likely to not be particularly high on the RBA’s agenda.
Ultimately, although the falling unemployment rate is likely to be relatively welcome news to the Australian public. It hides deeper issues around the appropriateness of part time employment and what impact this will have on inflation in the medium term. Subsequently, don’t expect any action from the RBA at the next meeting as the central bank will, again, sit on their hands.
Market Morning Briefing: The US Yields Have Risen Slightly
STOCKS
Overall global stocks are in a temporary downward correction phase and could test lower levels in the near term before resuming the upward rally later on.
Dow (20606.93, -1.78%) has risen from levels just below 20600. Overall broad trade within 21170-20410 may continue for the coming sessions, keeping the index in a sideways consolidation in the near term.
Dax (12590.06, -0.33%) is in a short term correction phase and could come off towards 12400-12300 in the near term before bouncing back later. That could create some more room on the upside for the long term.
Shanghai (3090.26) is almost stable and could bounce back from levels near 3070-3050. We may expect a trade within 3050-3170 in the near term.
Nikkei (19523.27, -0.16%) is trading lower as expected and could fall further towards 19296-19200 in the near term before bouncing back towards 19600. But looking at the rise in Dollar Yen, the fall in Nikkei could be limited.
Nifty (9429.45, -1.01%) came off from levels near 9530 and could see a small dip today also towards 9300 before bouncing back from there again. There is scope of falling towards 9300-9265 in the coming sessions before resuming the upward rally.
COMMODITIES
We were doubtful about the sustainability of gold beyond 1260 levels and the same was correct. Gold (1249) could not hold its ground and fell towards its crucial support of 1249, which could be a level where the price action has to be checked to assess the chances of further bounce to 1260-80 regions. A failure to hold 1249 could keep the price range-bound in the 1220-1250 regions.
Similar kind of trading pattern has been seen in silver (16.63) also. The recent trading range could be 15.80-16.90 and we will remain bearish while it is trading below 17.50 levels.
Copper (2.53) has found support at 2.46 levels and trading within the narrow range of 2.45-2.55 levels. Only above 2.55, higher resistances of 2.65-72 can come into consideration. In the medium term 2.44 are going to be a strong support now but a close below that could open up 2.40-35 levels as well.
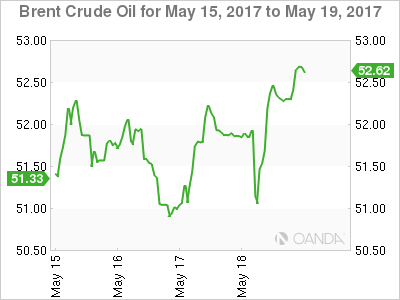
Brent(52.89) and WTI (49.71) are holding their respective supports of 52.70 and 49.22 which imply strength in in extreme short term time frame. We are not yet fully convinced with this upward rally due to overbought condition thus the bulls will be assured of strength of Brent and WTI only when a firm and sustainable closing above 53.50 and 51.20 are made by both Brent and WTI respectively.
FOREX
Along with the uncertainty over the US politics, the latest Brazilian corruption scandal with the possibility of an impeachment of the President has spooked the markets but better than expected jobless claims and regional manufacturing data in the US have helped Dollar to take a breather.
Dollar Index (97.83) has taken a pause after the sharp fall in the last few sessions. Immediate resistance comes near 98.15-25 and then 98.60 with the trend remaining firmly down in all the time frames. Hence a sudden decline may emerge despite the pause.
Euro (1.1107) is taking a similar pause but the high of 1.1174 may be crossed next week after this brief consolidation ends. Immediate support comes at 1.1070-50. The higher target of 1.1200-1.1300 remains unchanged.
Dollar Yen (111.16) has made a minor bottom at 110.21, just in the middle of our support zone of 110.50-00 as expected and now a consolidation can be expected in 110-112 for 1-3 sessions as discussed yesterday.
Pound (1.2954) has failed to capitalize so far on the breakout above the resistance of 1.3000 as it returned in the range of 1.2850-1.3000 but as long as the rising support of 1.2870 holds, the trend remains up with the possibility of 1.3200 still open.
Aussie (0.7423) has been rejected from the higher levels as expected as it tried to test the major resistance of 0.7500. Now the high of 0.7467 registered yesterday becomes the immediate resistance but it will take some heavy buying before a breakout can be expected. Repeat - only a successful break above 0.7470-0.7500 may negate the possibility of seeing the downside targets of 0.7300-0.7290 and bring bullish options on the table.
Contrary to expectations of the bounce being limited to 64.45-55, leading to a sideways consolidation in 64.00-70, Dollar Rupee (64.84) has surged above the resistance of 64.70. It may rise further to 65.00-10 very soon. The price action near 65.10-20 may decide the next course of action. Immediate support comes at 64.70.
INTEREST RATES
The US yields have risen slightly. There could be some near term upmove within an overall long term bearish outlook.
The US-Japan 10Yr (2.19%) is bouncing from support levels and while it moves up, Dollar-Yen could move up too, impacting a higher move on Dollar-Index too. The yield spread could rise towards 2.25-2.30% in the near term.
The UK-US 10Yr (-1.18%) came off from previous levels and is finding difficulty in sustaining at higher levels just now. In case there is an upmove left just now, it would be slow taking more time than expected.
The German-US 10Yr (-1.88%) came off slightly and could test -1.90% before again trying to move up.
Commodities: U.S. Data Puts Risk-Off, Back In Its Box.
Strong U.S. data takes the edge of this week's political turmoil, as equities and oil rally and gold unwind some of its safe haven buying.
Oil managed to dodge the chaos in the FX and equity markets overnight to post solid gains and start the Asian session on a positive note. Brent and WTI no doubt took some heart from the U.S. equities which seems to have dampened the risk off flames, that were burning much brighter 24 hours ago, as we head into the weekend.
We have the OPEC meeting next Thursday and an extension to the production cut is probably completely priced in. It really comes down to whether it is extended by six or nine months. The former implying compromise and some dissension internally within the OPEC and Non-OPEC grouping and possibly sending out a bearish message on oil.
Turning to the here and now, both crude contracts have traded on a very positive note in Asia with Brent and WTI spot contracts up 50 cents at 52.70 and 49.70 respectively.
Brent has traded above its daily resistance at 52.60 and is eyeing a run at the 100-day moving average at 53.40. Intra-day support sits at 52.20.
WTI has finally closed above its 200-day moving average, this morning at 49.15 and initial support. Resistance is just above market levels in the 49.85/50.00 region with a break targeting its 100-day moving average at 50.85.
Both contracts will, however, continue to be at the mercy of headline driven moves, as have most markets been this week.
Gold is delicately poised this morning, having given up much of its previous day's gains following the U.S. stock markets rally overnight. Having closed at its lows at 1246.50 however, it has enjoyed a sprightly start in Asia, trading four dollars higher to 1250.20. With the weekend ahead and the potential event risk that this may bring, it appears traders are happy to buy dips in today's session as a safe haven hedge.
From a technical perspective, and despite the poor price action overnight, gold has held just above its 200-day moving average at 1246.00 marking its 2nd successive close above. A break would target a move to the 1240 level with key support today at 1230, the 100-day moving average.
Gold has initial resistance at 1255.00, followed by the previous day's 1265.00 high. A break targeting a move above the 1270.00 regions.
Gold will continue to be at the mercy of the nuances of politically driven headlines throughout the day, suggesting that traders should remain nimble throughout the session. The downside, however, should be somewhat limited as traders hedge political risk into the weekend.