
Sample Category Title
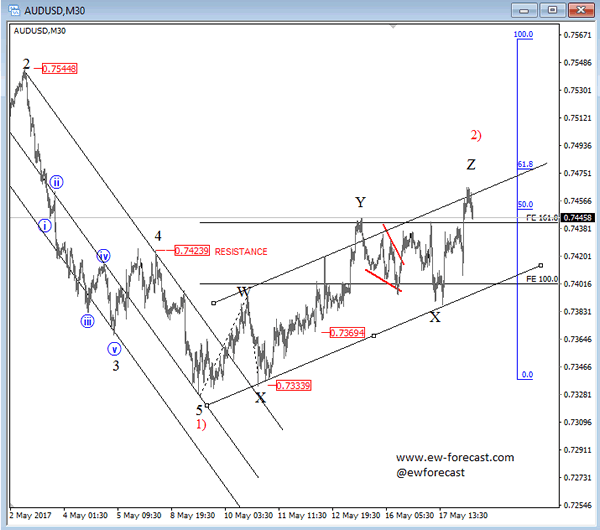
Elliott Wave Analysis: AUDUSD And GOLD
Gold was very strong lately, when stocks sold-off, but interestingly AUDUSD did not follow metals much. There has been some upside move into 0.7460 channel resistance area, but nothing aggressive. So we assume that Aussie is corrective here and that bearish turn may show up, especially once resistance on gold will be seen. From a clear Elliott Wave perspective, we would look for Aussie weakness beneath May 10 levels if lower channel line is broken decisively.
AUDUSD, 30Min
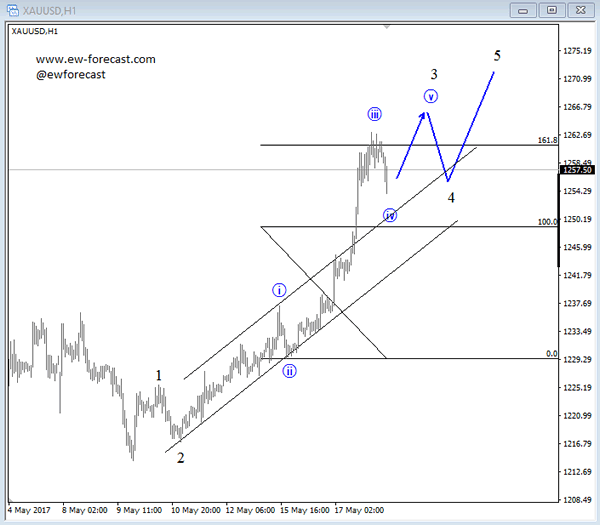
Gold is seen now in an extended wave 3, so be aware of a turn lower after subwave "v" hits a new high near 1265-1270.
GOLD, 1H
USD Carnage Continues, Spills Over Into Equities
The US dollar continued to collapse yesterday, with the USD index reaching its lowest level since November amid heightened uncertainty on the US political front. The recent media reports suggesting President Trump attempted to interfere with an FBI investigation have weighed significantly on risk sentiment, evident by the surge in safe haven assets, as well as the dip in global equity markets.
We stick to our guns that this market sentiment could continue over the next few days. We base our view on the elevated market skepticism over Trump's ability to push his tax plans through Congress, as well as the fact that there is nothing major on the US economic calendar to distract investors from these political developments until the release of the FOMC minutes next Wednesday.
USD/JPY continued to tumble yesterday, falling below the support (turned into resistance) of 111.90 (R1). The plunge brought the rate back within the medium-term downside channel that has been in place since December. Despite the corrective rebound following a test at 110.50 (S2), the fact that we are back within that channel increases the possibilities for the bears to take the reins again soon and perhaps aim for another test near 110.50 (S2). For now though, we stay cautious that the current corrective bounce may target the 111.90 (R1) barrier as a resistance this time.
Strong employment data lift AUD
Overnight, Australia's jobs data for April showed that the nation enjoyed a second consecutive month of strong employment gains. The unemployment rate unexpectedly declined to 5.7% from 5.9% previously, while the labor force participation rate remained unchanged, beating the consensus for a tick down.
Meanwhile, the net change in employment was much higher than anticipated. As a result, the Aussie surged on the release. We think that these encouraging prints are likely to alleviate some of the RBA's concerns regarding the labor market, which according to its May meeting minutes, the Bank was “carefully monitoring”.
AUD/USD traded higher overnight, breaking above the resistance (now turned into support) barrier of 0.7445 (S1). Although the recovery started on the 11th of May is possible to continue for a while, as long as the rate continues to trade below the downtrend line taken from the 30th of March, I would treat it as a corrective move. We see the case for sellers to pull the trigger near the crossroad of the aforementioned downtrend line and the 0.7500 (R1) territory. In order for us to get confident on further upside extensions, we would like to see a decisive close above that crossroad.
Today's highlights:
During the European day, we get UK retail sales data for April. The forecast is for both the headline and the core figures to have rebounded, following a sharp decline the previous month. The forecast is supported by the BRC retail sales monitor, which skyrocketed to +5.6% yoy in April from -1.0% yoy previously. In addition, the fact that the TR/IPSOS and the Gfk consumer sentiment indices both rose during the month, enhances the argument for a rebound in sales. Such a rebound could ease some of the BoE's concerns that household consumption appears to be slowing and thus, bring GBP under renewed buying interest.
From the US, we get the Philly Fed manufacturing index for May and expectations are for another decline. Something like that could raise some speculation for a similar reaction in the ISM manufacturing index, which could extend USD's recent losses. We also get the nation's initial jobless claims for the week ended on May 12th.
We have three speakers on the agenda: ECB President Mario Draghi, ECB Executive Board member Sabine Lautenschlager and Cleveland Fed President Loretta Mester. We think that market participants are likely to focus primarily on Draghi's comments, amid elevated speculation that the ECB may appear slightly more optimistic at its upcoming meetings. Any such hints could bring the euro under renewed buying interest.
USD/JPY
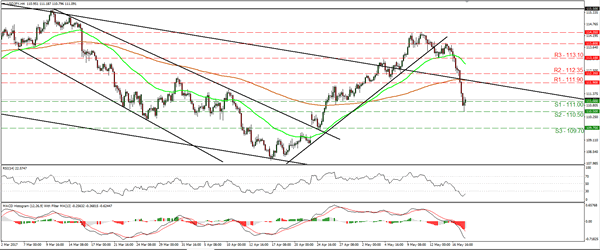
Support: 111.00 (S1), 110.50 (S2), 109.70 (S3)
Resistance: 111.90 (R1), 112.35 (R2), 113.10 (R3)
AUD/USD
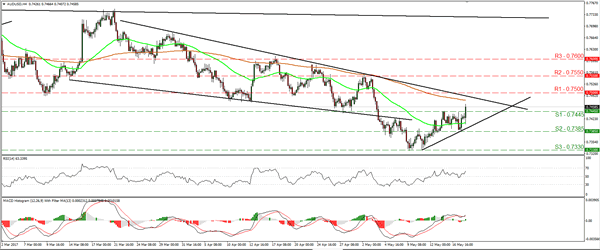
Support: 0.7445 (S1), 0.7385 (S2), 0.7330 (S3)
Resistance: 0.7500 (R1), 0.7550 (R2), 0.7600 (R3)
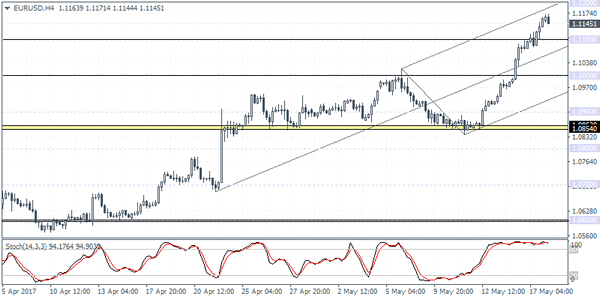
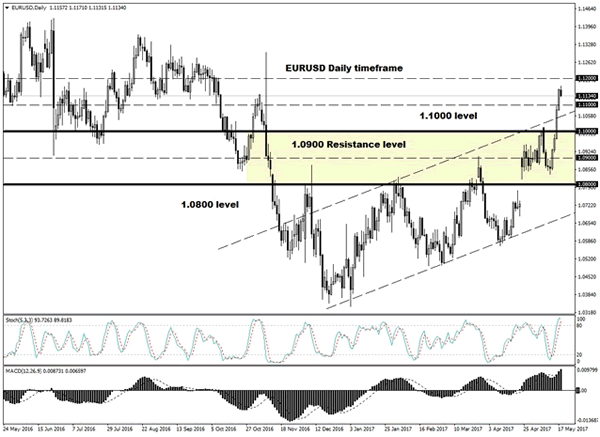
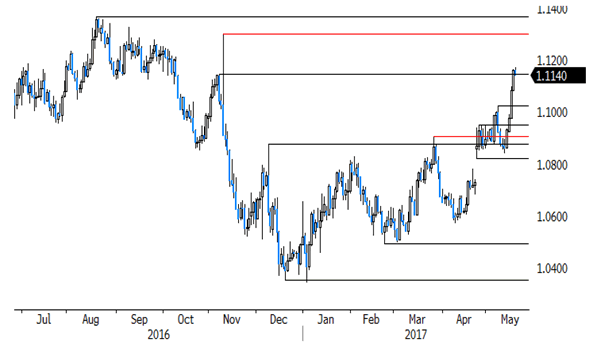
EURUSD Unstoppable At A 6-Month High
The euro surged ahead to a fresh 6-month high earlier this morning as the price was seen trading above $1.1150. The gains came about as the US dollar index weakened significantly since last Friday, while data from the eurozone turned encouraging.
Latest inflation figures confirmed yesterday that the Eurozone's consumer price index rose 1.9% on the headline and 1.2% on the core, validating the preliminary inflation reports. In the United States, lack of any economic data saw investors focus on the political developments from Washington.
In the UK, the latest monthly jobs report saw the UK's unemployment rate falling to a 42-year low at 4.6% in the periods between January and March 2017. Wages also posted a modest increase, rising from 2.3% previously to 2.4% and matching estimates.
Looking ahead, the economic data today turns to the weekly unemployment claims and the Philly Fed manufacturing index. Earlier in the day, the Australian jobs report saw the unemployment rate falling to 5.7%.
EURUSD intraday analysis
EURUSD (1.1145): EURUSD rose nearly 0.6% yesterday as price breached the 1.1150 level quite comfortably. The EURUSD is now into four days of a strong bull rally as the price was seen testing the resistance level at 1.1150 from late last year.
On the weekly chart, EURUSD is seen posting a hidden bearish divergence, while on the daily chart we have a bearish divergence on the Stochastics posting a lower high. This potentially indicates that a correction could be on its way, provided that EURUSD can break down below 1.1100. Failure to do so could keep the bullish momentum intact and keep prices on track to test 1.1200.
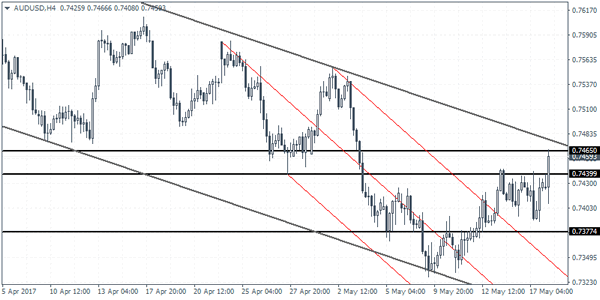
AUDUSD intraday analysis
AUDUSD (0.7459): The Australian dollar is now into its seventh day of gains, well supported by a better than expected jobs report earlier today and a weaker US dollar.
Price is seen testing the lows from late April at 0.7465. There is currently a confluence of resistance level and the dynamic trend line from the falling price channel at 0.7465 which could potentially signal the end of the correction. Support at 0.7377 remains to be tested to the downside, while to the upside a breakout above 0.7465 is essential to keep prices to push higher.
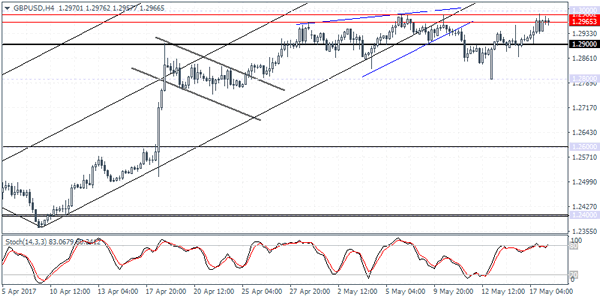
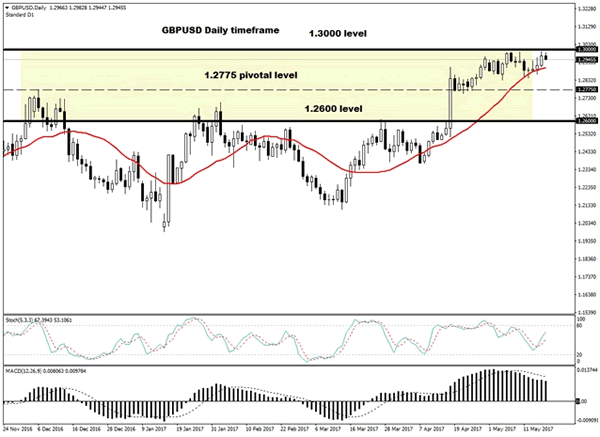
GBPUSD intraday analysis
GBPUSD (1.2966): The British pound continues to remain muted but well supported above 1.2800. Price action was seen testing the resistance level at 1.2988 - 1.2965 region which was previously tested just last week.
Another failure to break out above this resistance level could imply a move back to the downside with 1.2800 support coming back into the picture. On the daily chart, there is a strong indication of a downside correction towards 1.2600 on the bearish divergence to the Stochastics. However, a close below 1.2911 is required to confirm this view. Coming up later today will be the retail sales figures which are expected to see a gain of 1.2%, partly offsetting last month’s declines of 1.8%.
Sterling Pressured Ahead Of UK Retail Sales
The main event risk for Sterling on Thursday will be April's UK retail sales report which will be vital in providing some insight over the behaviour of consumers amid Brexit developments. With wage growth lagging behind inflation, the sales data may come under scrutiny for any signs of falling wages impacting consumer confidence. If retail sales fail to meet expectations and follow the same pattern as they did in March, concerns are likely to heighten over the sustainability of the UK's consumer-driven economic growth. Although markets are expecting retail sales to rebound in April to 1% due to the Easter holiday, this still may not be convincing enough to brush away Brexit concerns. The Bank of England has already warned of a consumer spending squeeze while the uncertainty blanketing Brexit continues to weigh on sentiment.
Sterling was unnaturally resilient against the bearish sentiment this week with a vulnerable Dollar playing a key role. The GBPUSD is at risk of depreciating lower if bulls fail to conquer the 1.3000 resistance level.
It's all about the 'Trump Slump'
The brewing political instability in Washington has raised questions about Donald Trump's ability to deliver his pro-growth policies, with a growing sense of uncertainty hastening the flight to safety. Global stocks were exposed to downside shocks during trading on Wednesday amid a lack of appetite for risk with Asian, European and American markets concluding depressed. With optimism rapidly diminishing over Trump's proposed fiscal spending and his administration coming under increasing pressure, the Trump rally seems to be a theme of the past. Stock markets may be instore for further punishment moving forward as political turmoil in the US and ongoing geopolitical tensions are adding to the mountinguncertainty over Trump.
Euro bulls unstoppable?
The EURUSD has experienced an incredible appreciation this week with prices marching to a fresh six-month high at 1.1170 as investors embraced the encouraging macro-fundamentals in Europe. A vulnerable Dollar has fuelled the upside rally and is likely to elevate the currency higher in the short to medium term. With the current reliefof political risk in Europe also boosting the attraction for the Euro, bulls have won this current battle. Investors may direct their attention towards the ECB meeting minutes and the speech by Mario Draghi this evening which could offer the Euro a further boost if hawks make a guest appearance.
From a technical standpoint, the EURUSD fulfils the prerequisites of a bullish trend on the daily charts as there hasbeen consistently higher highs and higher lows. A technical correction seems to be pending with bulls potentially exploiting the 1.1100 support level to drive prices higher towards 1.1200.
Emerging Market Currencies shine
Emerging market currencies heaved a sigh of relief this week with most edging higher after the Dollar sharply depreciated. Concerns over the political instability in the US weighing on prospects for pro-growth policies are likely to expose the Greenback to further downside risks with the resurgence of emerging market currencies taking the shine away from Trump pushing legislative agendas. Bond markets may be poised to rally further as the lingering concerns over slowing growth and the possible threat of the GOP agenda falling apart weigh on sentiment. A rally in the Bond market is good for emerging market appetite as foreign interest increases.
The US Dollar Weakened Broadly
Market movers today
Another quiet day today in terms of data releases but markets will continue to follow the political development in the US after a very bad week for President Trump and his administration.
In the US, initial jobless claims data as well as the Philly Fed index for May are due out today. We expect the Philly Fed index to have fallen, as it has overshot ISM/Markit PMIs, supporting our view that the US manufacturing cycle has peaked.
In the UK, retail sales for April are due out , which will at t ract at tention after plunging in Q1.
The ECB's Mario Draghi is due to speak in Tel Aviv, but we do not expect him to express anything new on the policy out look.
There are no market movers in Scandi today.
Selected market news
Asian stocks are in the red this morning mirroring earlier losses on Wall St reet with S&P 500 and Dow Jones both falling by around 1.8% overnight , as uncertainty mounted over US President Donald Trump's future following reports that he t ried to interfere with a federal invest igat ion. The US dollar weakened broadly against its peers and the VIX index reached its highest level since April on the back of the turmoil in the White House. Former FBI director and prosecutor Robert Mueller has been appointed to lead the investigat ion into collusion between Trump's campaign team and Russia.
Japanese GDP data released this morning showed annualised growth of 2.2% (0.5% q/q) in Q1, offering some relief to the Bank of Japan, which hopes that the economy will gather momentum to drive up wage growth and inflation, which remain low on soft household spending.
The new French President Emmanuel Macron yesterday presented his cabinet , comprising both veterans from the Republicans and Socialists and newcomers to politics. Having already made the Republican Edouard Philippe Prime Minister on Monday, Macron picked conservat ive Bruno Le Maire as his Economy Minister. Gerard Collomb and Jean-Yves Le Drian from the Socialist party will be Interior and Foreign Ministers, respect ively. Should his party fail to obtain a majority at the parliamentary elect ion in June, Macron would have to rely on the supportfrom other part ies to govern. The diverse party composit ion of his cabinet is in line with his aim to bridge the right -left divide in French politics and makes the emergence of such a cross-party coalit ion even more likely, in our view.
The final euro area HICP figures for April released yesterday confirmed that the higher core inflat ion at 1.2% y/y was driven by service price inflation related to package holidays and accommodation over the Easter. We expect lower core and service price inflation in May as the Easter volatility should fade and the underlying price pressure is not strong enough to lift core price. The May inflation figure will also be crucial for whether the ECB will change its communication in a more hawkish direction at the June meeting (see also ECB research: Hawkish wording but changed forward guidance less likely, 10 May).
OPEC Oil Cut Extension Unlikely To Add Much NOK Support
- We look for Organisation of Petroleum Exporting Countries (OPEC) and non- OPEC supply cuts to be extended, with limited upside impact on oil prices.
- We expect Brent crude to trade around USD50-54/bl near term and rise to around USD60/bl in 2018.
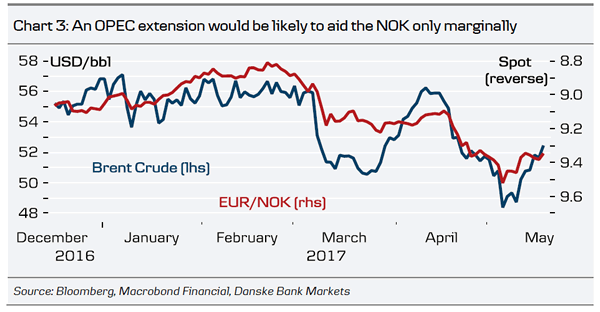
- The NOK should benefit only marginally from an extension. Meanwhile, weaker global demand/the OPEC meeting pose downside risks to our NOK-forecasts.
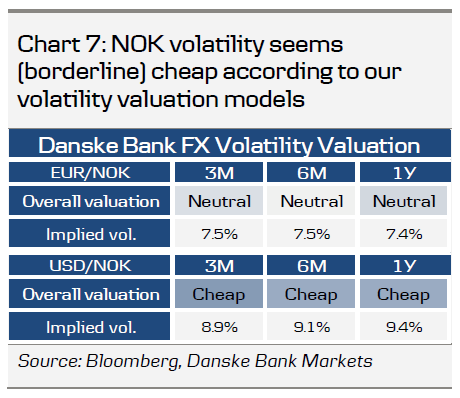
- Strategy: Leverage funds should look to buy NOK strategically but tactically we prefer a side-lined stance. NOK volatility looks cheap. Corporates with long NOK (short FX) exposure should protect themselves against tail risk in the next 3M.
FX economics
Extension of supply cuts about priced
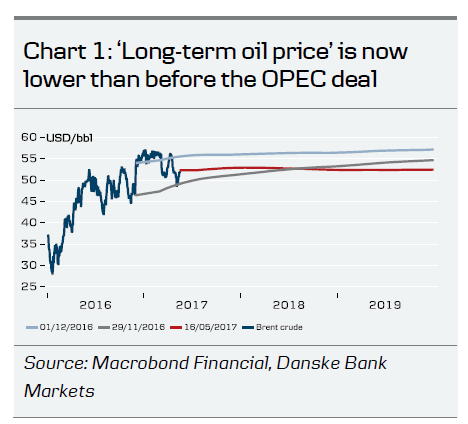
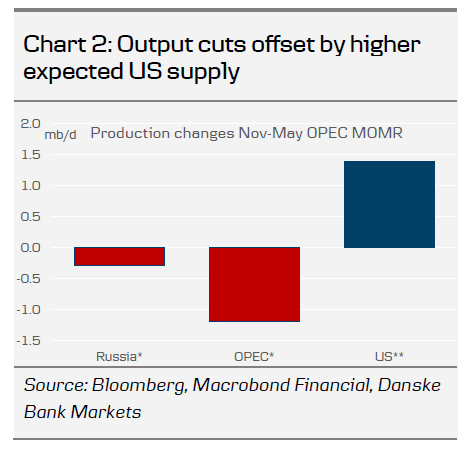
We expect the deal between OPEC and the 11 oil-producing countries outside OPEC to be extended when OPEC meets on 25 May. This has been more or less confirmed by recent comments, e.g. from Russia and Saudi Arabia, which have further hinted that the deal may be extended until March 2018. In our view, the market is about priced for an extension of supply cuts next week, although there is likely still to be some uncertainty about whether it will be for six or nine months. Positioning remains net long oil, which further backs our view and implied volatility at significant lower levels compared with 2016. Hence, if we are right that supply cuts will be extended, we see limited near-term price reaction and expect Brent crude to trade close to current levels (i.e. remain in the USD50-54/bl range). In the unlikely event the deal is not extended, we expect the price of Brent crude to fall to USD45/bl, which is close to the recent intraday low in May when markets priced out extension expectations. Medium term, we are still looking for the price of Brent crude to rise to around USD60/bl in 2018 on a lower USD and steadily rising demand. This is around 10-15% above current pricing in the oil forward market. In the big picture, supply cuts have had, and should continue to have, a limited impact on prices, while they have led to a shift of market share from OPEC and Russia to the US (see Charts 1 and 2).
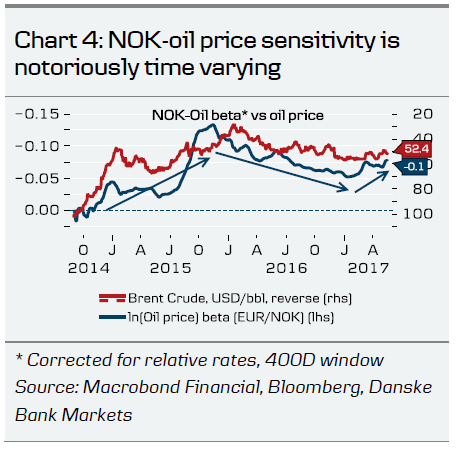
Time varying NOK-oil sensitivity; failure would have larger effect
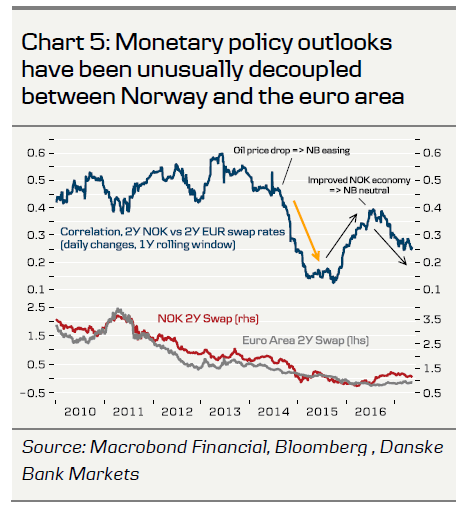
The NOK-oil connection is notoriously unstable. The time inconsistency is primarily down to (1) whether a given oil price change is supply or demand driven, (2) the size of the oil price move, (3) the direction of the oil price move, (4) the B/E thresholds of Norwegian oil projects and (5) other issues, e.g. dominating NOK/SEK flows. Generally, the connection has fallen steadily since the 2015-peak (Chart 4) in a move we think can be explained by all the factors above. In particular, cost cutting and margin compression have lowered B/E levels for key Norwegian oil projects, making economic growth less sensitive to oil price changes than was the case in 2014 and 2015. As a result, the amplified NOK effect of changes in the oil price via monetary policy has been much reduced relative to 2014-15 (see orange arrow on Chart 5).
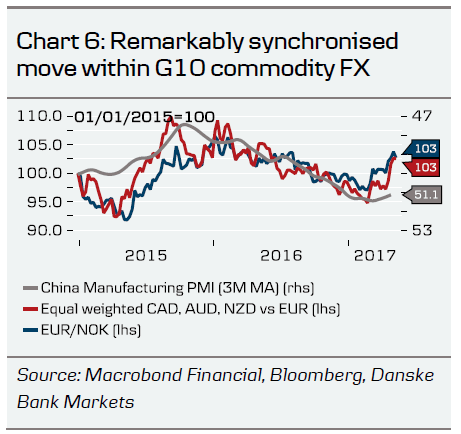
Meanwhile, the NOK/oil price connection has risen recently (Chart 4). In our view, it comes down to markets repricing a more two-way risk in oil markets as last year’s OPEC and non- OPEC supply cut deal lifted the front-end of the oil forward curve while the longer end was kept in check by US shale producers looking to raise output. With the global business cycle turning over, the global demand outlook clearly paints a less upbeat near-term outlook for the oil price and commodity currencies than in 2016 (Chart 6). As a result, we think the NOK-oil price connection is likely to rise further in coming months, albeit not back to the 2015 high. According to our models, an oil price fall to USD45/bl (e.g. due to the unlikely event of no extension of supply cuts or a significant deterioration of global growth outlook – neither part of our base case) would send EUR/NOK c.18-22 figures higher.
FX outlook
EUR/NOK should fall only slightly on extension of output cuts
If our expectations materialise, a moderately higher oil price should aid support to the NOK and send EUR/NOK lower. Meanwhile, as an extension to the output cuts is about priced, the balance of risk for the NOK near term is asymmetrically skewed on the downside. An extension of supply cuts would lift the oil price only marginally, while weaker global demand outlook has started to exert downward pressure on oil prices. This suggests very moderate near-term NOK upside from the oil price even if the notoriously unstable NOKoil relationship has risen in recent months.
In 2017, we have emphasised the paradoxical situation of the NOK. On the one hand, the domestic story has not been as NOK positive for many years even if Norges Bank is unlikely to turn hawkish in June. On the other hand, global factors including the oil price are likely to remain challenging, limiting the near-term NOK upside potential. We forecast EUR/NOK at 9.30 in 1M, 9.30 in 3M, 9.10 in 6M and 9.00 in 12M (see FX Forecast Update: Cyclical risks surfacing as politics abate, 15 May), but emphasise that we see near-term risks to our profile skewed to the upside.
FX strategy
Tactically cautious despite long-term attractiveness
Leverage funds should look to buy NOK strategically but tactically we prefer a side-lined stance. According to our volatility valuation, NOK volatility looks cheap and, given the global business cycle outlook, we generally like long-vega strategies. Given the usual spot-volatility connection, we recommend entering 3-12M long NOK and vega strategies on dips in spot. Corporates with long NOK (short FX) exposure should use forwards in the coming three months and option structures that maintain a profit potential on a 3-12M basis. NOK based real-money funds should use dips in NOK to raise hedge ratios on foreign assets; not least on USD assets. Our NOK rates strategists see potential for a further cheapening of USD/NOK forwards on improved structural NOK liquidity
Currencies: USD Trump Sell-Off To Slow?
Sunrise Market Commentary
- Rates: Risk sentiment remains key, positive for core bonds?
Risk sentiment will be key for trading with markets watching the latest developments in the Trump affaire. The US stock market correction probably has further to go. Risk aversion could support core bonds short term. The US Note future broke above 125-26+ resistance, suggesting return action to the contract high (126-20). 2.16% is key support for the 10-yr yield. - Currencies: USD Trump sell-off to slow?
Yesterday, the dollar was hit hard as the sell-off of risky assets weighed. Today, sentiment on risk remains the key driver for USD trading. If the equity sell-off slows, the dollar might enter calmer waters, at least temporary. Sterling traders will keep a close eye at the UK retail sales. Euro strength propelled EUR/GBP to the 0.86 big figure.
The Sunrise Headlines
- US stocks suffered their worst day in 8 months (-2%) after political turmoil shook investors, with some fearing President Trump's ability to push through his pro-growth policies has been side-lined by the deepening political controversy. Losses in Asia are more contained overnight with Japan underperforming.
- Former FBI Director Robert Mueller III was appointed as special counsel to oversee the federal investigation into Russia's alleged interference in the 2016 US presidential election.
- Japan has recorded its longest run of sustained economic growth since 2006 in a sign of its robust progress under Abenomics. Growth for Q1 2017 came in at an annualised 2.2%, marking 5 quarters of continuous output growth.
- Growth in China's new home prices slowed further in April when compared to a year prior, particularly among top-tier cities, but data also show price rises ramped up in month-on-month terms to the fastest pace since October.
- A Harris Interactive poll found Macron's Republic on the Move party, together with allies, is set to win the largest share of the vote in the first round. 32% of 4,600 registered voters questioned planned to vote for Macron's party, it said.
- Australia's jobless rate fell to its lowest in four months in April, but the number of people with full-time work declined - a mixed report that augurs poorly for a much-needed revival in wage growth and inflation.
- Today's eco calendar contains UK retail sales, US jobless claims and Philly Fed Business Outlook. ECB Draghi, Weidmann, Mersch, Lautenschlager, Nowotny and Fed Mester are scheduled to speak. Spain and France tap the market.
Currencies: USD Trump Sell-Off To Slow?
Turmp-driven USD decline to slow?
On Wednesday, the dollar sold off after articles, based on internal FBI memo of former director Comey, accused Donald Trump to influence and possible obstruct an FBI investigation against his former security adviser. The dollar initially still held near Asian lows, but the sell-off accelerated during the US session with US equities falling off a cliff. USD/JPY lost more than two big figures to close the session at 110.83. The decline of the dollar against the euro was more modest as EUR/JPY selling weighed. Still EUR/USD set a new recovery top and closed session at 1.1159.
Overnight, Asian equity losses are more modest than in the US. Japanese indices are losing about 1.5% as yen strength bites. USD/JPY touched a correction low near 110.55 and trades currently in the 111.20 area. It looks that the acute sell-off phase is easing. Japanese Q1 growth was marginally strong than expected (2.2% Q/Qa), but had limited impact on yen trading. EUR/USD shows a similar picture. The pair touched a minor top around 1.1172 and trades in the 1.1150 area. The Australian April labour market report was better than expected. The Aussie dollar rebounds further off the recent lows. AUD/USD trades around 0.7460
Today, the eco calendar only contains the US initial jobless claims and the May Philly Fed business outlook. For the Philly Fed, a slight decline to 18.5 from 22 is expected. A negative surprise might have more impact than a positive one, as it might raise further doubts on the strength of the US economy. Various ECB members will speak including Draghi. However, it is not clear whether they will elaborate on market sensitive issues. The risk-off sentiment might make them reluctant to address the issue of policy normalization. So, global risk sentiment will dominate USD trading.
We think that US equities entered a short-term sell-on-upticks environment and that US (10-year) yields might revisit the recent lows. This scenario suggests that the dollar might remain in the defensive. That said, we consider yesterday's USD correction as aggressive. So, if the equity and core yields decline slows, the dollar decline might do so too. Yesterday's price action indicates that the outright riskoff is extremely negative for USD/JPY. The impact on EUR/USD is more modest. Even more, a protracted risk-off correction might raise questions on the ECB's intention to start policy normalization in the near future. So, the upside of EUR/USD might become more difficult, even if sentiment on risk remains negative due to US political uncertainty
Technical picture.
The USD/JPY rebound ran into resistance last week. Till Tuesday, it was no more than a correction, but yesterday's sell-off and the re-break below the previous top at 112.20 aborted the uptrend and made the short-term picture negative. Return action lower in the 108.13/114.37 range is likely.
Last week, it looked that EUR/USD could revisit the 1.0821/1.0778 support (gap). However, Friday's US data and political uncertainty finally propelled EUR/USD north the 1.1023 range top, improving the technical picture. The correction top at 1.1366 is the next resistance. We think that USD sentiment will have to be extremely negative to clear this hurdle short-term. Further ST EUR/USD gains might become tougher.
EUR/USD: euro breaks topside of the ST range as US political uncertainty weighs on the dollar
EUR/GBP
EUR/GBP tests 0.86 big figure
The April UK labour market report was solid, but wage growth was again the missing link. Real wage growth even became negative due to rising inflation. Sterling's reaction was limited. Chance are low that the BoE will raise its policy rate any time soon as long as low wage growth is at risk to further slow UK spending/growth. EUR/GBP touched an intraday top of 0.8615 early in Europe and settled in the upper half of the 0.85 big figure for most of the day, supported by the ongoing bid in EUR/USD. The pair close the session at 0.8604. USD weakness kept cable near the recent top, but a real test of 1.30 didn't occur.
Today, the April UK retail sales will be published. Sales are expected to rebound (1.1% M/M and 2.1% Q/Q) after a sharp decline in March. Technical factors might have been in play. The odds are for a good report, but for sterling there is still an asymmetrical risk. After recent indications that higher prices are weighing on spending, a negative figure will probably have more impact than a positive surprise. The price action in the euro and the dollar will also remain important. Of late, the positive sterling sentiment eased and euro strength prevailed in EUR/GBP trading.. The pair developed a bottoming out pattern with 0.84/0.8330 as a solid bottom. The breach of 0.8509/31 (previous ST tops) improved the technical picture. For now, we don't row against the EUR/GBP uptrend even as the euro rebound might slow short-term. Longer term, Brexit remains potentially negative for sterling.
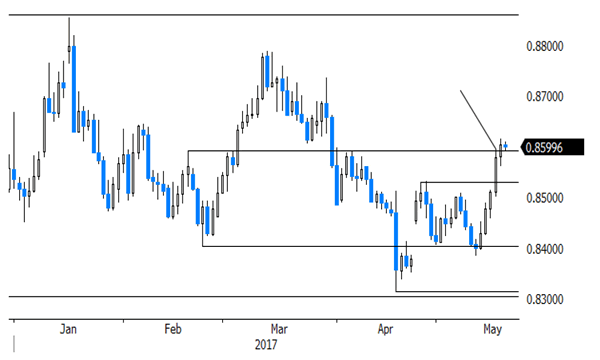
EUR/GBP: jumps north of ST range top
Trade Idea: EUR/JPY – Stand aside
EUR/JPY - 123.75
Recent wave: wave v of (C) ended at 94.12 and major correction in wave A has ended at 149.79
Trend: Near term up
New strategy :
Stand aside
Position: -
Target: -
Stop:-
As the single currency finally retreated after rising to 125.82 earlier this week, retaining our view that consolidation below this level would be seen and initial downside risk remains for weakness to previous support at 123.32, break there would add credence to this view, bring retracement to 123.00, however, reckon downside would be limited to 122.60 support and bring another rise later.
In view of this, would not this rise here and would be prudent to stand aside in the meantime. Above previous minor support at 124.50 would bring recovery to 125.00, however, reckon upside would be limited to 125.50-55 and price should falter below said resistance at 125.82, bring retreat later. Only break of 125.82 would revive bullishness and extend recent upmove to 126.00-10, then 126.40-50.
Our latest preferred count is that wave (ii) is ABC-X-ABC which ended at 123.33 and wave (iii) is unfolding with wave iii ended at 100.77, followed by wave iv at 111.57 and wave v as well as the wave (iii) has ended at 97.04, followed by wave (iv) at 111.43 and wave (v) has ended at 94.12 which is also the end of the larger degree v, this also implied the major wave (C) has also ended there, hence major correction has commenced from there with (A) leg unfolding in its lower degree wave c which has possibly ended at 145.69. Under this count, A-B-C wave (B) has commenced with A leg ended at 136.23, wave B at 143.79 and wave C has possibly ended at 149.79.
Our larger degree count is that the decline from 139.26 is wave (C) and is sub-divided into a diagonal triangle i-ii-iii-iv-v with wave i - 105.44, wave ii- 123.33, wave iii - 97.03, wave iv - 111.43, followed by the final wave v as well as the end of wave (C) at 94.12, this also mark the bottom of larger degree wave B. Under this count, major rise in wave C has commenced as an impulsive wave with minor wave III ended at 145.69, wave V is still in progress for further gain to 150.00. Having said that, this so-called wave V could well be the first leg of larger degree 5-waver wave C and this wave C should bring at least a retest of wave A top at 169.97 (July 2008).

Trade Idea: AUD/USD – Buy at 0.7370
AUD/USD – 0.7449
Recent wave: Wave 5 ended at 1.1081 and major correction has commenced for fall to 0.7000 and then towards 0.6500-10
Trend: Near term down
Original strategy :
Buy at 0.7370, Target: 0.7520, Stop: 0.7320
Position: -
Target: -
Stop: -
New strategy :
Buy at 0.7370, Target: 0.7520, Stop: 0.7320
Position: -
Target: -
Stop:-
As aussie has risen again after brief pullback, adding credence to our view that a temporary low is possibly formed at 0.9329 and consolidation with mild upside bias is seen for further gain to 0.7470-75, then 0.7500-10 but break of latter level is needed to add credence to this view, bring subsequent rise towards resistance at 0.7556 which is likely to hold from here due to near term overbought condition.
In view of this, we are looking to buy aussie on dips as 0.7360-70 should limit downside. A break of said support at 0.7329 would abort and signal recent decline is still in progress for weakness to 0.7295-00 (76.4% retracement of 0.7158-0.7750), however, loss of downward momentum should prevent sharp fall below 0.7300 and reckon 0.7245-50 would remain intact, bring another rebound later.
On the 4-hour chart, the move from 0.8066 is the wave 5 with i: 0.8860, ii: 0.8315, wave iii is an extended move ended at 1.0183, iv: 0.9706 and wave v has ended at 1.1081 (also the top of entire wave 5). The subsequent selloff is the major correction which is unfolding as ABC-X-ABC and 2nd A leg has ended at 0.8848, followed by a-b-c wave B which ended at 0.9758, hence, 2nd C wave is now in progress and indicated downside target at 0.7000 and 0.6950 had been met, so further fall to 0.6710-20 cannot be ruled out.

Market Update – Asian Session: Japan GDP Up For 5 Straight Quarters For The First Time In 11 Years
US Session Highlights
(US) MBA MORTGAGE APPLICATIONS W/E MAY 12TH: -4.1% V +2.4% PRIOR
(US) Rep Al Green (D-TX) says he will call on Congress to start impeachment proceedings against Pres Trump
(US) House GOP caucus meeting today said to not focus on Pres Trump's issues; no indication of breaking point with Pres Trump - AP
(US) House Speaker Ryan (R-WI): want facts before rushing to judgment on Trump-Comey reports; there are clearly a lot of politics being played
Stocks lost their foothold as investors began to doubt the capability of the Trump administration to enact its economic agenda. Last night's news that memos indicate President Trump asked the FBI to drop the Flynn investigation created an overall lack of confidence in the markets. Blue chips and the broader S&P dropped close to 2%, for the largest one-day drop since Mar 21st. Volume at 3:30pm for the S&P was 17% above 3-month average, with decliners leading advancers 3 to 1. The worst hit sectors in the S&P were Financials and Techs, down 3.1% and 2.6% respectively. The VIX was up 34%, hitting its highest intraday level since April 21st.
US markets on close: Dow -1.8%, S&P500 -1.8%, Nasdaq -2.6%
Best Sector in S&P500: Financials
Worst Sector in S&P500: Real Estate
Biggest gainers: CL +5.7%; EXR +4.9%; BF.B +3.6%
Biggest losers: MU -7.0%; CFG -6.8%; NVDA -6.6%
At the close: VIX 15.6 (+4.9pts); Treasuries: 2-yr 1.26% (-2bps), 10-yr 2.22% (-11bps), 30-yr 2.90% (-9bps)
US movers afterhours
LYC: GMI-1271 receives FDA Breakthrough Therapy Designation for Adult Relapsed/Refractory Acute Myeloid Leukemia; +37.1% afterhours
LB: Reports Q1 $0.33 v $0.29e, R$2.44B v $2.46Be; Guides Q2 $0.40-0.45 v $0.45e; Raises FY17 $3.10-3.40 v $3.19e; +6.8% afterhours
CSCO: Reports Q3 $0.60 v $0.58e, R$11.9B v $11.9Be- Guides Q4 $0.60-0.62 v $0.63e, Rev -6% to -4% y/y v -1%e, gross margin 63-64% ; -7.7% afterhours
GMED: Receives FDA letter saying company had not sufficiently addressed the FDA’s questions regarding the 510(k) submission for the Excelsius GPS robotic guidance and navigation system - filing; -10.5% afterhours
ASNA: Guides Q3 EPS $0.04-0.06 v $0.11e, SSS -8% y/y; -33.0% afterhours
Key economic data
(CN) CHINA APR PROPERTY PRICES M/M: RISE IN 58 OUT OF 70 CITIES VS 62 PRIOR; Y/Y: RISE IN 69 OUT OF 70 CITIES V 68 PRIOR; avg all-70 new home prices m/m: 0.7% v 0.6% prior; y/y: 10.7% v 11.3% prior
(JP) JAPAN Q1 PRELIMINARY GDP Q/Q: 0.5% V 0.5%E; ANNUALIZED GDP: 2.2% V 1.7%E; 5th consecutive quarter of growth for the first time in 11 years
(JP) JAPAN Q1 HOUSING LOANS Y/Y: 3.3% V 3.1% PRIOR
(AU) AUSTRALIA APR EMPLOYMENT CHANGE: +37.4K (2nd straight increase; best 2-month rise since late 2015) V +5.0KE; UNEMPLOYMENT RATE: 5.7% (3-month low) V 5.9%E
(AU) AUSTRALIA MAY CONSUMER INFLATION EXPECTATION: 4.0% V 4.1% PRIOR; matches 5-month low
(NZ) NEW ZEALAND MAY ANZ CONSUMER CONFIDENCE INDEX: 123.9 V 121.7 PRIOR; M/M: +1.8% V -2.8% PRIOR; First increase in 4 months
Asia Session Notable Observations, Speakers and Press
Asian equity indices are down across the board, tracking the biggest US market decline of the year. White House political risk has risen from a simmer to an open flame over the past 24 in the wake of alleged interference by Pres Trump into the FBI investigation of former NSA Flynn. The presidential crisis has sunk so deep that the appointment of a special counsel Mueller to head the Russia probe on Wednesday evening is treated as a positive development, helping US equity futures regain some ground.
In FX, USD index has now erased all of its post-election gains, while the 10-2 Treasury spread was below 1% for the first time since Trump was elected last year. Predictably, Financials sector was the worst performer on THE S&P500 as long-end Treasuries rose on safe-haven demand. Nikkei225 is among the biggest decliners in Asia as USD/JPY fell as low as 110.50. USD selling is also sufficiently pronounced to boost commodity currencies despite the risk-off mode - AUD/USD was supported into the US market close and then rallied some 30pips on strong Australia employment data. MXN fell for the 2nd straight day however, with USD/MXN rising above 19 level.
In economic data, Aussie employment change was much higher than expected and unemployment rate fell back to 5.7% for a 3-month low despite participation rate remaining unchanged. Japan Q1 GDP was also constructive with a beat on q/q annalized. Sequentially, Japan grew for the 5th straight quarter - the longest such streak since 2006. Capex was the standout component, rising 0.2% against expected 0.4% decline. Also of note, China house price growth continued to retreat in the wake of property curb measures by regulators - Y/Y growth across top 70 cities slowed to 10.7% from 11.3%.
China
(CN) Templeton's Mobius: No doubt there's risk in China, but govt will insulate SOEs - press
(CN) China said to be considering excluding some industries from carbon permit trade
(CN) China Banking Regulator (CBRC) to increase protections after recently global cyber attack - local press
(CN) Fitch: Rapid growth in China investment companies is building risks - press
Japan
(JP) BOJ Dep Gov Iwata: No details of policy exit have been decided - press
(JP) Credit Suisse: Pace of Japan GDP growth may slow - press
Asian Equity Indices/Futures (00:30ET)
Nikkei -1.6%, Hang Seng -0.2%, Shanghai Composite -0.2%, ASX200 -1.2%, Kospi -0.5%
Equity Futures: S&P500 +0.2%; Nasdaq +0.3%, Dax +0.3%, FTSE100 +0.3%
FX ranges/Commodities/Fixed Income (00:30ET)
EUR 1.1145-1.1175; JPY 110.50-111.20; AUD 0.7410-0.7465; NZD 0.6925-0.6950
June Gold +0.1% at 1,260/oz; June Crude Oil -0.3% at $48.92/brl; July Copper -0.8% at $2.52/lb
(CN) PBOC to inject combined CNY80B v CNY140B prior in 7-day and 14-day reverse repos
(CN) PBOC SETS YUAN MID POINT AT 6.8612 V 6.8635 PRIOR; Strongest Yuan setting since Feb 7th; 6th consecutive firmer fix
(JP) Japan's MoF sells ¥0.9T in 0.7% (0.7% prior) 20-year JGBs; Avg yield: 0.560% v 0.562% prior; bid-to-cover: 3.84x v 4.06x prior
Asia equities notable movers
Australia
Sirtex (SRX) -28.6%; Announces combined Foxfire analysis; primary endpoint of overall survival superiority not met in mCRC
Virgin Australia (VAH) -2.8%; Reports Q3
Fairfax (FXJ) +6.6%; Receives takeover offer from Hellman&Friedman consortium at $1.225-1.250/shr cash
James Hardie (JHX) -5.6%; Reports FY16/17
Japan
Sumitomo Mitsui (8316) -3.0%; Guides FY20
Nintendo (7974) -0.4%; Switch sales
Senko Group (9069) -1.3%; Cut at Nomura
Hong Kong
Tencent (700_ +3.9%; Q1 result
Parkson Retail Group (3368) +1.0%; Q1 result
TPV Technology Ltd (903) -7.7%; Q1 result
Johnson Electric Holdings (179) +8.1%; Q1 result