
Sample Category Title
Australia’s Unemployment Rate Surprisingly Declined To A 4-Month Low Level In April
For the 24 hours to 23:00 GMT, the AUD rose 0.07% against the USD and closed at 0.7433.
LME Copper prices declined 0.2% or $9.0/MT to $5575.0/MT. Aluminium prices rose 0.7% or $13.0/MT to $1928.0/MT.
In the Asian session, at GMT0300, the pair is trading at 0.7453, with the AUD trading 0.27% higher against the USD from yesterday's close, following upbeat Australian jobs report.
Data revealed that Australia's seasonally adjusted unemployment rate registered an unexpected drop to 5.7% in April, dipping to a four-month low level, suggesting that the nation's labour market is strengthening, despite a slowdown in economic growth. Meanwhile, investors had envisaged the unemployment rate to remain steady at 5.9%. Additionally, the nation's consumer inflation expectations dropped to 4.0% in May, compared to a level of 4.1% in the previous month.
Elsewhere, in China, Australia's largest trading partner, the house price index climbed 10.7% on an annual basis in April, after recording a rise of 11.3% in the previous month.
The pair is expected to find support at 0.7406, and a fall through could take it to the next support level of 0.7359. The pair is expected to find its first resistance at 0.7479, and a rise through could take it to the next resistance level of 0.7505.
The currency pair is trading above its 20 Hr and 50 Hr moving averages.

Euro-Zone’s Annual Inflation Growth Confirmed At 1.9% In April
For the 24 hours to 23:00 GMT, the EUR rose 0.6% against the USD and closed at 1.1160, after the Euro-zone's final consumer price index (CPI) advanced 1.9% on an annual basis in April, confirming the flash estimates. The CPI had recorded a rise of 1.5% in the previous month.
On the contrary, the region's seasonally adjusted construction output fell 1.1% on a monthly basis in March. In the prior month, construction output had advanced by a revised 5.5%.
The US Dollar declined against its key counterparts, sparked by reports that the US President, Donald Trump, had allegedly asked former FBI Director, James Comey to end his investigation into his former security adviser, Michael Flynn.
On the data front, the US MBA mortgage applications fell 4.1% in the week ended 12 May 2017, following an advance of 2.4% in the prior week.
In the Asian session, at GMT0300, the pair is trading at 1.1155, with the EUR trading slightly lower against the USD from yesterday's close.
The pair is expected to find support at 1.1100, and a fall through could take it to the next support level of 1.1044. The pair is expected to find its first resistance at 1.1191, and a rise through could take it to the next resistance level of 1.1226.
Going forward, market participants will keep a close watch on minutes of the European Central Bank's (ECB) recent monetary policy meeting, slated for release in a few hours. Also, a speech by the ECB President, Mario Draghi will be eyed by traders. In the US, initial jobless claims and Philadelphia Fed manufacturing activity index for May, due to release later in the day, will be on investors' radar.
The currency pair is trading above its 20 Hr and 50 Hr moving averages.

UK’s ILO Unemployment Rate Surprisingly Dipped To A More Than 4-Decade Low Level In The Three Months To March
For the 24 hours to 23:00 GMT, the GBP rose 0.4% against the USD and closed at 1.2967, after the latest ILO jobs report highlighted continued strength in the UK labour market.
Britain's ILO unemployment rate unexpectedly fell to 4.6% in the first three months of 2017, marking its lowest level in 42 years, as the number of people employed surged to a record high. Markets expected the ILO unemployment rate to remain steady at 4.7%, recorded in the December-February 2017 period.
However, the nation's average earnings excluding bonus rose 2.1% in the January-March 2017 period, rising at its weakest pace since July 2016, thus indicating that household budgets would certainly be squeezed further in the coming months as wages are not keeping up with inflation. The average earnings excluding bonus had advanced 2.2% in the December-February 2017 period.
In the Asian session, at GMT0300, the pair is trading at 1.2964, with the GBP trading a tad lower against the USD from yesterday's close.
The pair is expected to find support at 1.2915, and a fall through could take it to the next support level of 1.2865. The pair is expected to find its first resistance at 1.3002, and a rise through could take it to the next resistance level of 1.3039.
Moving ahead, investors will look forward to UK's retail sales data for April, set to be released in a few hours.
The currency pair is showing convergence with its 20 Hr moving average and trading above its 50 Hr moving average.

Japanese Economy Grew At A Faster Pace In The First Three Months Of 2017
For the 24 hours to 23:00 GMT, the USD declined 1.68% against the JPY and closed at 110.92.
In the Asian session, at GMT0300, the pair is trading at 111.05, with the USD trading 0.12% higher against the JPY from yesterday's close.
Overnight data indicated that Japan's preliminary gross domestic product (GDP) climbed 0.5% on a quarterly basis in the first quarter of 2017, driven by strong exports and robust domestic demand. The nation's GDP had advanced 0.3% in the previous quarter, while market participants anticipated for a rise of 0.5%.
The pair is expected to find support at 110.15, and a fall through could take it to the next support level of 109.26. The pair is expected to find its first resistance at 112.30, and a rise through could take it to the next resistance level of 113.56.
The currency pair is trading below its 20 Hr and 50 Hr moving averages.

Swiss Franc Trading Slightly Lower In The Morning Session
For the 24 hours to 23:00 GMT, the USD declined 0.62% against the CHF and closed at 0.9787.
In the Asian session, at GMT0300, the pair is trading at 0.9792, with the USD trading marginally higher against the CHF from yesterday’s close.
The pair is expected to find support at 0.9759, and a fall through could take it to the next support level of 0.9727. The pair is expected to find its first resistance at 0.9837, and a rise through could take it to the next resistance level of 0.9883.
The currency pair is trading below its 20 Hr and 50 Hr moving averages.

Loonie Trading On A Weaker Footing This Morning
For the 24 hours to 23:00 GMT, the USD declined 0.18% against the CAD and closed at 1.3584.
On the data front, Canada's manufacturing shipments rebounded 1.0% on a monthly basis in March, falling short of market expectations for an advance of 1.3%. In the prior month, manufacturing shipments had fallen by a revised 0.6%.
In the Asian session, at GMT0300, the pair is trading at 1.3606, with the USD trading 0.16% higher against the CAD from yesterday's close.
The pair is expected to find support at 1.3569, and a fall through could take it to the next support level of 1.3532. The pair is expected to find its first resistance at 1.3642, and a rise through could take it to the next resistance level of 1.3678.
With no economic releases in Canada today, investor sentiment will be governed by global macroeconomic factors.
The currency pair is showing convergence with its 20 Hr and 50 Hr moving averages.

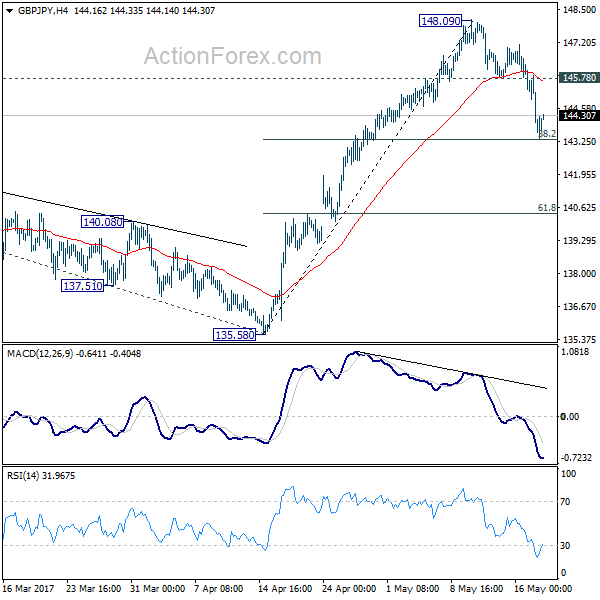
GBP/JPY Daily Outlook
Daily Pivots: (S1) 142.85; (P) 144.48; (R1) 145.34; More....
GBP/JPY's correction from 148.09 extended sharply lower. Based on downside acceleration, the fall might extend through 38.2% retracement of 135.58 to 148.09 at 143.31 to 61.8% retracement at 140.35. On the upside, above 145.78 minor resistance will turn bias back to the upside for 148.09 first. Overall, we'd still expect the rise from 122.36 to resume after to 150.42 long term fibonacci level.
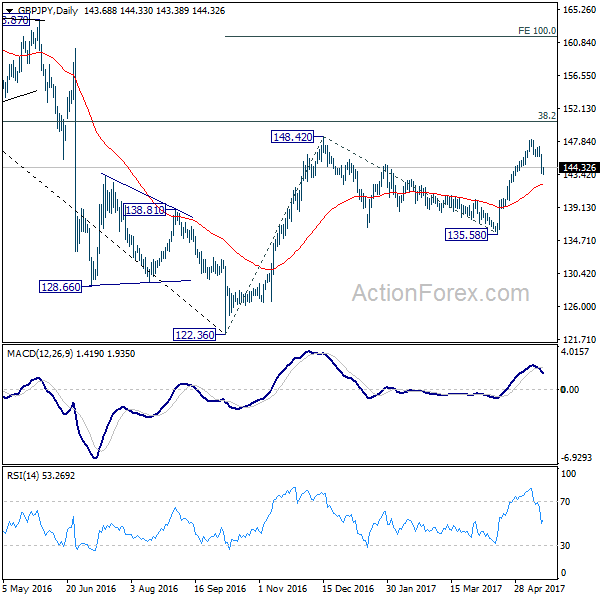
In the bigger picture, based on current momentum, rise from 122.36 bottom should be developing into a medium term move. Break of 38.2% retracement of 195.86 to 122.36 at 150.42 should pave the way to 61.8% retracement at 167.78. This will now be the favored case as long as 135.58 support holds.
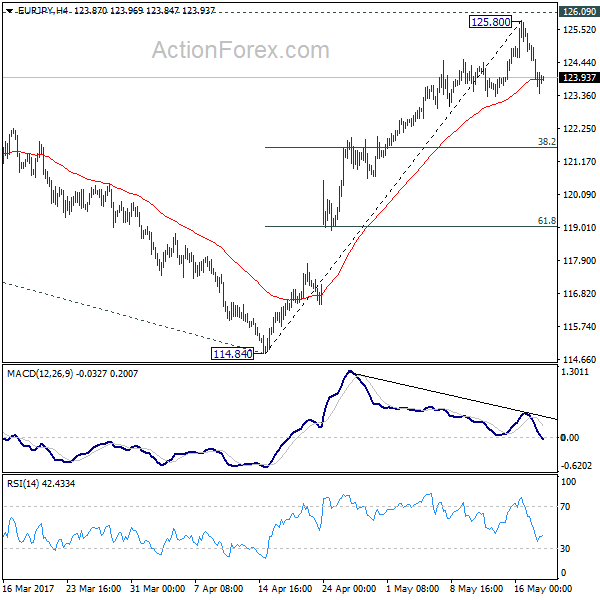
EUR/JPY Daily Outlook
Daily Pivots: (S1) 123.06; (P) 124.22; (R1) 124.82; More...
The sharp fall from 125.80 suggests short term topping in EUR/JPY, ahead of 126.09 key resistance, on bearish divergence condition in 4 hour MACD. Deeper pull back is now mildly in favor back to 38.2% retracement of 114.84 to 125.80 at 121.61 and possibly below. But overall, we're still staying mildly bullish in the cross and expect another rise. Break of 126.09 will extend the whole rebound from 109.03 to 100% projection of 109.03 to 124.08 from 114.84 at 129.89.
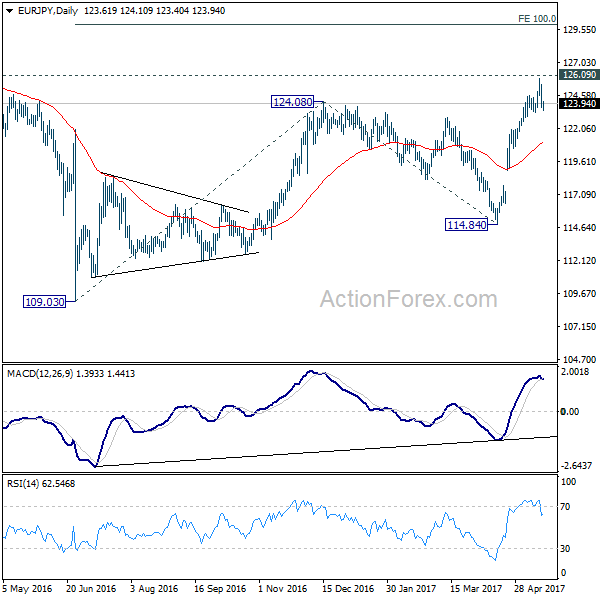
In the bigger picture, focus is back on 126.09 support turned resistance. Decisive break there will confirm completion of the down trend from 149.76. And in such case, rise from 109.20 is at the same degree and should target 141.04 resistance and above. Meanwhile, rejection from 126.09 and break of 114.84 will extend the fall from 149.76 through 109.20 low.
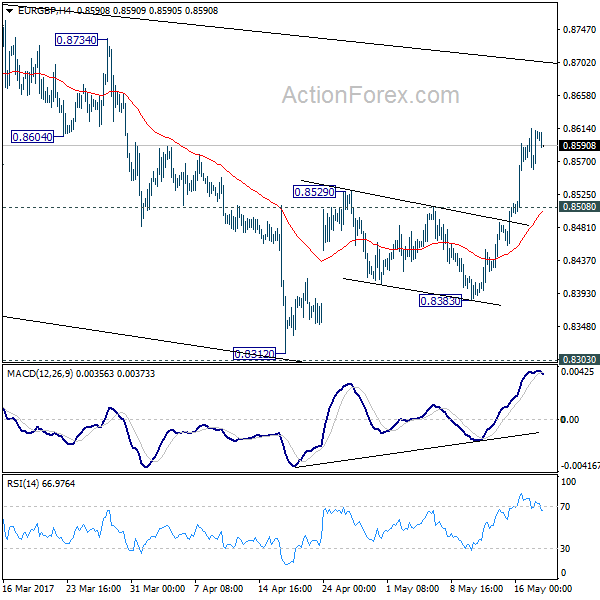
EUR/GBP Daily Outlook
Daily Pivots: (S1) 0.8570; (P) 0.8592; (R1) 0.8625; More...
At this point, intraday bias in EUR/GBP remains on the upside as the rebound from 0.8312 is still in progress. Current rise would target 0.8786 resistance next. Overall, price actions 0.9304 are viewed as a medium term corrective pattern that is extending. As EUR/GBP has just defended 0.8303 resistance. Break of 0.8786 could bring a retest on 0.9304 high. On the downside, below 0.8508 minor support will turn bias back to the downside for 0.8383 support instead.
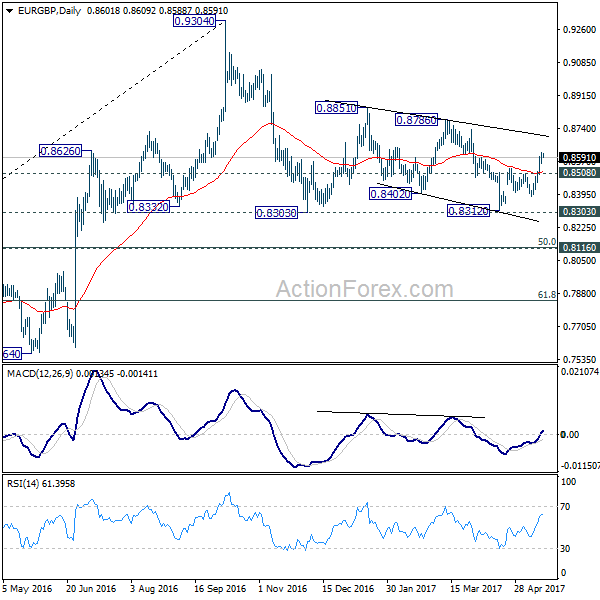
In the bigger picture, price actions from 0.9304 are viewed as a medium term corrective pattern. In case of deeper fall, we'd expect strong support from 0.8116 cluster support (50% retracement of 0.6935 to 0.9304 at 0.8120) to contain downside. Rise from 0.6935 (2015 low) will resume at a later stage to 0.9799 (2008 high). However, sustained break of 0.8116 could bring deeper decline to next key support level at 0.7564 before the correction completes.
EUR/AUD Daily Outlook
Daily Pivots: (S1) 1.4939; (P) 1.4991; (R1) 1.5065; More...
EUR/AUD reaches as high as 1.5074 but falls sharply ahead of 1.0594 resistance. Intraday bias is turned neutral for consolidations first. Deeper retreat could be seen but outlook will remain bullish as long as 1.4669 support holds. We're holding on to the view of trend reversal. Break of 1.5094 will extend the rise from 1.3624 to next medium term fibonacci level at 1.5455.
In the bigger picture, price actions from 1.6587 medium term top are viewed as a corrective pattern. Such correction should be completed after defending 1.3671 key support. Rise from 1.3642 is now expected to target 61.8% retracement of 1.6587 to 1.3624 at 1.5455 and above. In any case, outlook will now stay cautiously bullish as long as 1.4309 resistance turned support holds.

