Sample Category Title
Trade Idea Wrap-up: EUR/USD – Buy at 1.1065
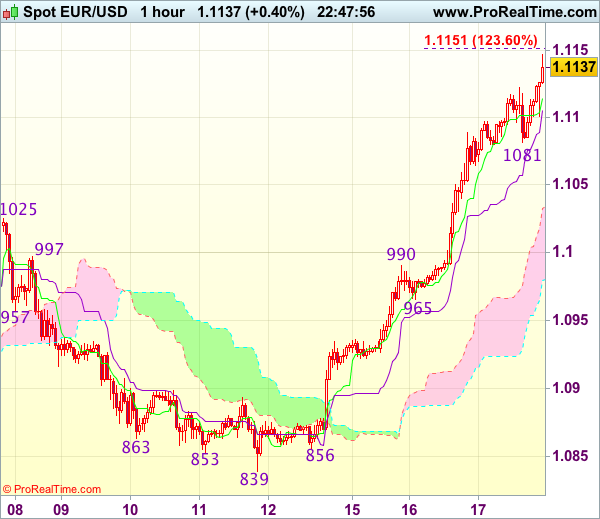
EUR/USD - 1.1147
Most recent candlesticks pattern : N/A
Trend : Near term up
Tenkan-Sen level : 1.1115
Kijun-Sen level : 1.1106
Ichimoku cloud top : 1.1034
Ichimoku cloud bottom : 1.0980
Original strategy :
Buy at 1.1050, Target: 1.1150, Stop: 1.1015
Position : -
Target : -
Stop : -
New strategy :
Buy at 1.1065, Target: 1.1185, Stop: 1.1030
Position : -
Target : -
Stop : -
As the single currency has continued moving higher after recent rally above previous resistance at 1.1025 (now support), adding credence to our view that recent upmove has resumed and bullishness remains for further gain to 1.1150-55 (1.236 times projection of 1.0839-1.0990 measuring from 1.0965), then towards 1.1175-80, however, near term overbought condition should limit upside to 1.1205-10 (1.618 times projection) and reckon 1.1250 would hold from here, bring retreat later.
In view of this, would not chase this rise here and we are looking to buy euro on pullback as 1.1065-70 should limit downside. Below previous resistance at 1.1025 (now support) would defer and suggest top is possibly formed instead, risk test of another previous resistance at 1.0990 first.
Trade Idea Wrap-up: USD/JPY – Sell at 112.50
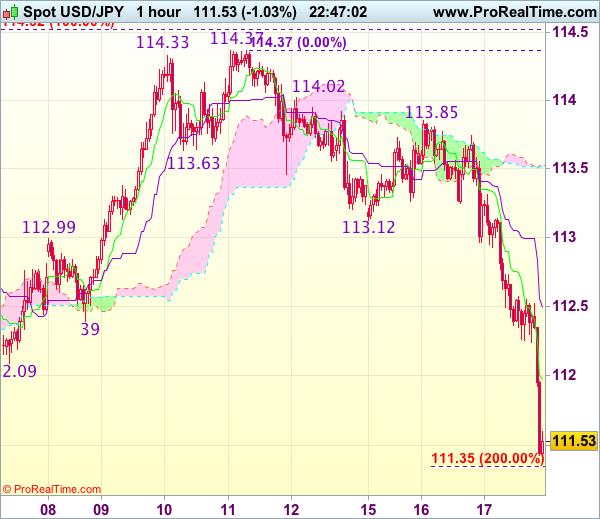
USD/JPY - 111.54
Most recent candlesticks pattern : N/A
Trend : Near term down
Tenkan-Sen level : 111.98
Kijun-Sen level : 112.49
Ichimoku cloud top : 113.52
Ichimoku cloud bottom : 113.52
New strategy :
Sell at 112.50, Target: 111.30, Stop: 112.85
Position : -
Target : -
Stop : -
As the decline from 114.37 has accelerated on dollar’s broad-based weakness, suggesting early rise from 108.13 has ended at 114.37 and downside bias is seen for the selloff from 114.37 to extend weakness to 111.20-25 (50% Fibonacci retracement of 108.13-114.37), then towards 110.87 support, however, reckon previous resistance at 110.60 would limit downside and 110.50 (61.8% Fibonacci retracement) would hold from here due to near term oversold condition.
In view of this, would not chase this fall here and would be prudent to sell dollar on recovery as 112.40-50 should limit upside and bring another decline. Above 112.80-85 would defer and risk rebound to 113.00 but previous support at 113.12 should turn into resistance and limit dollar’s upside, bring another selloff later.
US Political Risk Triggers Safe Haven Flows
European stock markets lose around 1% as US political drama created risk aversion. US stock markets currently drop by 0.5%to 0.75%. The main barometer tracking expectations for US equities market tumult (Vix) climbed by the most since before the November election, highlighting the rising market jitters over the Trump administration.
The UK unemployment rate dropped to its lowest in more than four decades last quarter (4.6%), but UK workers saw their real earnings fall for the first time in 2 1/2 years, data from the ONS showed. Employment growth was strong in March, rising by 122k 3M/3M vs 21k consensus.
The ECB should begin unwinding its ultra-loose monetary policy soon if it wants to avoid damaging side-effects, German Deputy FM Spahn said. He added that there was too much public and private debt in the world and called for an acceleration of structural reforms, saying monetary policy could not solve structural problems.
Theresa May has said she is "happy" to endorse Philip Hammond, but failed twice to say he would remain chancellor after the election. Mrs May, responding to questions about tensions between the chancellor and Number 10, declined to say that he would still be in post if she wins the election.
BoJ governors Kuroda told Japanse PM Abe that Japan's economy is steadily recovering and will continue to grow above its potential. Under these conditions, prices will rise, but inflation is still far from the BoJ's 2% target. Therefore, the BoJ will continue with its monetary easing programme, Kuroda said.
The Polish central bank kept its policy rate unchanged at a record low of 1.5% , but an economic surge last quarter, compounded by faster-than-forecast core inflation and months of gains in the zloty, is putting the spotlight on the Monetary Policy Council's commitment to its longest-ever pause in interest rates.
Iceland's central bank cut its 7-day term deposit rate by 0.25% to 4.75% amid krona appreciation. Sedlabanki said the outlook is for stronger GDP growth this year than previously forecast. The deviation stems mainly from stronger-than-expected growth in tourism, while there is also the prospect of more fiscal easing in 2017.
Ford said it aims to reduce its salaried workforce in North America and Asia by 10%, a cost-cutting move aimed at shoring up profits amid cooling sales in the once-booming U.S. and Chinese auto markets.
Emmanuel Macron has appointed Bruno Le Maire, a member of rival rightwing Les Republicains party as economy minister as France's centrist president seeks to maximise his chances to win a majority in parliament in June.
Rates
US political risk triggers safe haven flows
Global core bonds profited from safe haven flows. US political risk took the upper hand amid empty eco calendars in EMU and the US. At the time of writing, the US yield curve shifts 4..1 bps (2-yr) to 6.8 bps (5-yr) lower. The German yield curve bull flattens with yields 2.1 bps (2-yr) to 5.4 bps (30-yr) lower. On intra-EMU bond markets, 10-yr yield spread changes versus Germany are nearly unchanged with Portugal outperforming (-4 bps) and Greece underperforming (+5 bps). Tonight, Greek parliament is expected to vote on additional reform measures necessary to unlock the next aid tranche.
Intraday, the Bund opened stronger on the back of Asian risk aversion. US media reported that President Trump asked former FBI-director Comey to back off the investigation into former National Security Adviser Flynn after the latter resigned. It's the latest development related to the enquiry into ties between Trump's administration/campaign team and the Russian government. Markets conclude that Democrat/Republican resistance against Trump will increase further, possibly harming his ambitious reform agenda. After a weaker European equity market opening, markets steadied and even returned some of the initial losses. As US investors entered dealings, a second risk-off move occurred. The US Note future broke above 125-26+ resistance, suggesting return action towards the contract high (126-20) even if the Fed is about to hike rates at its June meeting. US stock markets lose up to 1% in the opening.
The German Finanzagentur tapped the on the run 30-yr Bund (€1B 2.5% Aug2046). Demand was significantly stronger than the average total bids at the previous 4 very long Bund auctions (€1.91B vs €1B). The Bundesbank retained €0.19B of the amount on offer for secondary market operations, resulting in an official bid cover of 2.3. The auction yield (1.24%) was the highest since September 2015.
Currencies
USD/JPY and EUR/JPY tumble in risk-off trade
Markets pondered the impact of the new press articles accusing Donald Trump having tried to influence an FBI investigation against his former security adviser. The dollar initially held near Asian lows against the euro and the yen, but European investors awaited guidance from their US colleagues. During the US session, risk sentiment deteriorated further. This triggered a standard risk-off trade in the FX market. USD/JPY (currently 111.50) was aggressively sold and also dragged EUR/JPY sharply lower. EUR/USD was in good shape of late, but heavy selling from EUR/JPY currently caps further EUR/USD gains (low 1.11 area).
Overnight, sentiment turned risk-off on headlines that president Trump asked FBI director Comey to stop an investigation against Trump's former national security adviser. Asian equity losses were modest, but the decline in US equity futures suggested that this case might have more impact than recent ones. USD/JPY declined to the mid 112 area. Dollar weakness propelled EUR/USD north of 1.11.
EUR/USD touched a new correction top in the 1.1122 area before the European market opening. USD/JPY filled bids in the 112.25/30 area. European equities opened with losses of 0.5%+, but the damage was limited and most indices soon recouped a substantial part of the initially losses. Interest rate differentials between the dollar and the euro narrowed a few bps compared to yesterday, but the trend didn't push through as trading proceeded and the USD decline slowed (temporary). Investors awaited more guidance from the US.
Early in US dealings, US investors also reacted in a guarded way to the overnight up-tick of Trump uncertainty. However, tensions rose in the run-up to the cash open of the US equity markets. In the FX market, the risk-off trade weighs both on USD/JPY (111.50) bit also on EUR/JPY (124.00) area. For now, the decline of EUR/JPY prevents a further rise of EUR/USD. The pair stabilizes in the low 1.11 area. So, despite recent constructive sentiment, the euro still isn't able to take up the role of a full-sized safe haven currency. Admittedly, the gains of the Swiss franc (EUR/CHF 1.0910) is not that convincing yet.
EUR/GBP stabilizes as focus turns to the dollar
The April UK labour market report was solid. Employment grew a stronger than expected 122 000 in the 3 months through April and the unemployment rate declined from 4.7% to 4.6%, the lowest level in almost 42 years. However, wage growth was again the missing link. Pay rises ex bonuses slowed from 2.2% Y/Y to 2.1%, making real wage growth negative with yesterday's (April) CPI inflation of 2.7% Y/Y in mind. Sterling's reaction was limited. Chance are low that the BoE will raise its policy rate any time soon as long as low/negative wage growth is at risk to further slow UK spending/growth. Trading in EUR/GBP was mostly driven by the gyrations of the euro and the dollar. EUR/GBP touched an intraday top of 0.8615 early this morning, but lost slightly ground as the overall euro rally ran into resistance. EUR/GBP trades in the 0.8685 area. Cable also slightly outperformed EUR/USD after the recent underperformance. GBP/USD came close to the recent highs, but trades currently again in the mid 1.29 area. A real test of the 1.30 barrier didn't occur yet.
Elliott Wave Analysis: AUDUSD Undergoing A Significant Reversal Down
Aussie is turning slightly down but not that sharp yet, so more aggressive sell-off will be needed through 0.7369 to confirm end of a corrective recovery.

Japanese Yen Jumps on Political Turmoil in US, GDP Next
USD/JPY has recorded considerable losses in the Wednesday session, after a quiet start to the week. In North American trade, the pair is trading at 111.60. On the release front, Japanese Revised Industrial Production posted a decline of 1.9%, just above the estimate of a 2.1% decline. Later in the day, Japan releases Preliminary GDP for the first quarter, with an estimate of 0.4%. There are no major US releases on the schedule. On Thursday, the US releases unemployment claims and the Philly Fed Manufacturing Index.
The Japanese yen has recorded considerable gains on Wednesday, buoyed by the growing political turmoil which has engulfed Washington. Media reports on Tuesday said that Trump asked former FBI director James Comey to end an investigation into ties between Russia and Trump's former security adviser, Michael Flynn. This has led to speculation that Trump may have committed an obstruction of justice. Another brewing controversy is Trump's passing of classified intelligence to the Russian foreign minister. Trump initially denied the claim, but has since backtracked, admitting that he did share intel with the Russians, but that he had acted within his rights. With the Trump administration busy putting out political fires, investors are growing increasingly nervous that the president's agenda for a stimulus package and tax reform will stall.
Bank of Japan Governor Haruhiko Kuroda said on Wednesday that he was confident that the central bank could smoothly exit from its huge monetary stimulus when appropriate, but noted that wages and inflation remained sluggish, despite a stronger economy. Kuroda added that the central bank had no plans to revise its monetary stance, and said that the Federal Reserve's tightening stance would not affect the decisions of the BoJ. Stronger global demand has boosted Japan's manufacturing and export sectors, but inflation is stuck around zero percent and consumer spending remains soft. We'll get a look at Tokyo Core CPI and other inflation indicators next week.
Canadian Manufacturing Sale Volumes Up Solidly in Q1
Highlights:
- Nominal manufacturing sales jumped 1.0% but largely reflecting a (broadly based) increase in prices.
- Sale volumes increased 0.2% despite a sharp 11% pullback in the volatile aerospace component.
- Nominal inventories rose 1.2% to reach a record high in March but the inventory-to-sales ratio held steady at a still relatively modest level by historical comparison.
Our Take:
Higher prices accounted for the bulk of the 1% monthly manufacturing sales gain in March (reflecting widespread price gains outside of an expected pull-back in petroleum prices) but volumes were still up 0.2% that, combined with earlier strength, left the measure up 7.9% (at an annualized rate) in Q1/17, marking the strongest quarterly increase since Q2/14. The underlying details are pointing to a slightly larger gain in the manufacturing component of monthly GDP in March to leave data to-date still broadly consistent with our forecast that overall GDP jumped 3.8% in Q1 to build on strong gains in each of the two prior quarters. One of the encouraging details in recent manufacturing reports has been stronger machinery sale volumes, which have now increased in four of the last five months and were up a whopping 17.4% (annualized rate) in Q1. That increase coincided with an earlier reported jump in machinery and equipment imports and stronger engineering construction activity with the data together making it look increasingly likely that business investment posted a sizeable increase in the quarter after steady declines over the last two years. The monthly/quarterly data is often volatile but U.S. manufacturing activity - which itself is a large customer for Canadian manufactured output - has also shown signs of life and survey based measures (eg. the Markit Canada Manufacturing PMI and CFIB's Business Barometer) of Canadian manufacturing activity have also generally improved in 2017 to-date to suggest at least part of recent improvement reflects a stronger fundamental growth path that can be sustained going forward.
Canadian Manufacturing Sales Rise in March
Canadian manufacturing sales were up 1.0% in March. This was just shy of the 1.2% gain expected by economists but came atop of a downward revision to February sales which declined 0.6% (prev. reported as -0.2%). After accounting for price swings the volume of sales was up a respectable 0.2% on the month, but again, this came atop of downward revisions to the previous months.
Both durables and non-durables contributed to the headline gain, up 1.3% and 0.7% respectively. The gains in durables were broad-based, but led by transportation equipment (+2.1%), wood (+3.1%), electronics (+5.1%), and electrical equipment (+3.1%). Amongst non-durables, food manufacturing (+2.6%) and plastics & rubber products (+1.5%) accounted for most of the gains while petroleum (-1.7%) and chemicals (-0.8%) declined on the month.
Regionally, manufacturing sales were up in all but four provinces, falling in Newfoundland (-5.1%), Manitoba (-1.9%), and Saskatchewan (-1.1%). Sales were little changed in Quebec (-0.2%), but rose in Ontario (+1.3%), Alberta (+1.6%), B.C. (+2.9%), and surged in Atlantic Canada (+4.8%).
Inventories were up 1.2% on the month, with the inventory-to-sales ratio unchanged at 1.35. Forward looking indicators were encouraging, with new orders up 2.6% and unfilled orders up 1.8% in March.
Key Implications
There is little doubt that this is a mildly disappointing report given the miss on the headline and downward revisions to previous months' performance. Having said that, despite the revisions, the Canadian manufacturing sector momentum remains quite robust, with most of the strength from late-2016 carrying over into the first quarter of 2017. In fact, first quarter manufacturing sales were up 1.9% in real terms – the fastest pace of growth in nearly three years. As such, we remain of the view that the Canadian economy expanded by about 3.5% during the first quarter of the year.
Moreover, the report offers some encouraging bits as far as future activity, with leading indicators remaining solid. Coupled with resurging U.S. manufacturing production, which was up 1% in April on the back of strong transport equipment activity, and a competitive loonie, these should support Canadian manufacturing activity over the coming months.
Having said that, the outlook is not without uncertainties, as the Canadian manufacturing and export sectors face increasingly protectionist trade rhetoric. This poses downside risk as far as investment and net exports over the longer-run. Alongside a cooling in housing activity and still soft inflationary pressures, these risks will likely see the Bank of Canada remain on the sidelines through early-2018.
CAC Ticks Lower as Uneasy Markets Eye Trump Woes
It's been an uneventful week for the CAC, which has inched lower in the Wednesday session. Currently, the CAC is trading at 5370.80, down 0.65 percent. On the release front, the spotlight remains on key consumer indicators. Eurozone Final CPI climbed 1.9%, matching the forecast. Final Core CPI improved to 1.2%, also matching the estimate. On Thursday, the president of the ECB, Mario Draghi, will speak at an event at the University of Tel Aviv.
European stock markets are lower due to the political uncertainty which continues to rock the United States. The American media is having a field day, as the Trump administration tries to douse the political firestorms that have engulfed Washington. On Tuesday, reports surfaced that President Trump asked former FBI director James Comey to end an investigation into ties between Russia and Trump's former security adviser, Michael Flynn. Another brewing controversy is Trump's passing of classified intelligence to the Russian foreign minister earlier this week. Trump initially denied the claim, but has since backtracked, admitting that he did share intel with the Russians, but that he had acted within his rights. With the Trump administration preoccupied with damage control, investors are growing increasingly nervous that the president's agenda for a stimulus package and tax reform will stall, and the euro has taken advantage, gaining 1.5% against the greenback.
The markets were right on target in forecasting euro-area inflation data. Eurozone Final CPI matched the forecast with a strong gain of 1.9% in April, considerably higher than last month's gain of 1.5%. Eurozone inflation is closing in on the ECB's target of 2.0%, which could increase pressure on the ECB to consider tapering its ultra-loose monetary policy. Germany, for one, is finding that ultra-low interest rates is hampering growth, and wants Brussels to adopt a tighter monetary policy. On Tuesday, Eurozone Flash GDP was unrevised from the April forecast, posting a gain of 0.5% in the first quarter. The eurozone continues to show improved numbers in 2017, boosted in no small part by the German economy, which expanded 0.6% in the first quarter.
The French economy has been struggling, and all eyes are on new president Emmanuel Macron to make substantive changes that will kick-start the weak French economy. Inflation slipped to 0.1% in April, after an unexpectedly strong showing in March, which showed a gain of 0.6%. Meanwhile, the spotlight remains on the French political front, with President Emmanuel Macron choosing Edouard Philippe, a conservative lawmaker, as his new prime minister. Macron has pledged to dismantle the left-right divide which has characterized French politics for decades, and his choice of Macron, who has support on both sides of the aisle, is an important first step in his goal of unifying the country.
Technical Outlook: Spot Gold Accelerated Further Up
Spot Gold accelerated further up on Wednesday, driven by weaker dollar and political uncertainty in the US, extending recovery leg off $1214 low into fifth consecutive day.
Today's bullish acceleration probes through a cluster of strong barriers at $1245/47 zone, consisting of daily cloud / Fibo 38.2% of $1295/$1214 descend and converging 55 / 200 and 20SMA's.
Sustained break higher is expected to generate strong bullish signal for extension towards next targets at $1250 and $1254 (daily Kijun-sen / 50% retracement).
Daily technical studies are turning into firmer bullish mode, complemented by dollar-negative fundamentals and rising demand for safe haven assets on political crisis in the US that may further inflate gold's price.
However, hesitation at key $1245/47 resistance zone could be expected, with the notion supported by overbought slow stochastic (without firmer bearish signal for now).
Top of thick 4-hr cloud top at $1242 marks immediate support, followed by 4-hr Tenkan-sen at $1240 and session low at $1236, reinforced by rising 4-hr Kijun-sen line, above which corrective dips should be contained.
Res: 1250; 1254; 1260; 1264
Sup: 1245; 1242; 1240; 1236
Trade Idea: EUR/GBP – Buy at 0.8530
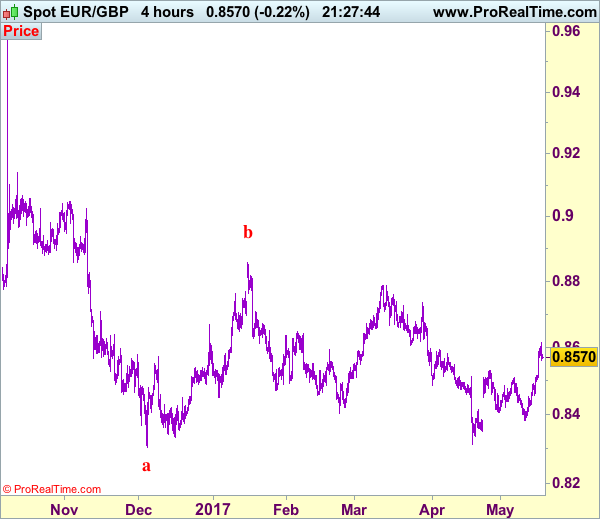
EUR/GBP - 0.8571
Recent wave: Major double three (A)-(B)-(C)-(X)-(A)-(B)-(C) is unfolding and 2nd (A) has possibly ended at 0.6936.
Trend: Near term down
Original strategy :
Buy at 0.8530, Target: 0.8630, Stop: 0.8490
Position : -
Target : -
Stop : -
New strategy :
Buy at 0.8530, Target: 0.8630, Stop: 0.8490
Position : -
Target : -
Stop : -
As the single currency has eased after rising to 0.8615, suggesting minor consolidation below this level would be seen and pullback to 0.8550 is likely, however, reckon 0.8525-30 would contain downside and bring another rise later, above said resistance would extend the erratic upmove from 0.8312 low to 0.8630 but as this move is viewed as retracement of recent decline, reckon upside would be limited to 0.8650-60, risk from there is seen for a retreat later.
In view of this, we are still looking to buy euro on pullback as 0.8531 (previous resistance) should limit downside and bring another rise. Below 0.8500-05 would defer and suggest top is possibly formed, bring weakness to support at 0.8457 but break of previous resistance at 0.8452 is needed to confirm and bring test of support at 0.8423 first.
Our preferred count is that, after forming a major top at 0.9805 (wave V), (A)-(B)-(C) correction is unfolding with (A) leg ended at 0.8400 (A: 0.8637, B: 0.9491 and 5-waver C ended at 0.8400. Wave (B) has ended at 0.9413 and impulsive wave (C) has either ended at 0.8067 or may extend one more fall to 0.8000 before prospect of another rally. Current breach of indicated resistance at 0.9043 confirms our view that the (C) leg has ended and bring stronger rebound towards 0.9150/54, then towards 0.9240/50.