Sample Category Title
GBPUSD: Continues To Retain Upside Pressure Short Term
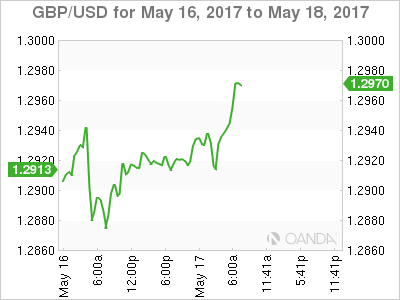
GBPUSD: The pair continues to retain its short term uptrend but with caution. Support lies at the 1.2900 level where a break will turn attention to the 1.2850 level. Further down, support lies at the 1.2800 level. Below here will set the stage for more weakness towards the 1.2750 level. Conversely, resistance stands at the 1.3000 levels with a turn above here allowing more strength to build up towards the 1.3050 level. Further out, resistance resides at the 1.3100 level followed by the 1.3100 level. On the whole, GBPUSD continues to face upside threats.
WTI Below $50 Ahead of EIA Inventory Data
There are two upcoming events that are expected to impact the price of Oil; firstly, the Iran presidential election will be held this Friday, May 19th and secondly the OPEC meeting will be held on May 25.
The result of the Iran presidential election and the associated geo-political risks will likely affect its oil supply.
On May 8th, at the Asia Oil and Gas Conference in Malaysia, Saudi Arabia's Oil Minister, Khalid al-Falih, stated that "the output cut could be extended another 6 months or even further into 2018".
Oil prices have retraced 12.88% since April 12th and have experienced a 3.74% rebound since May 5th, due to technical correction and market expectations on OPEC's output cut extension in the Vienna meeting.
Last Wednesday's EIA crude oil inventory data saw a drop of 5.247 million barrels hitting the lowest level this year, in turn, pushing oil prices higher.
Oil Bulls have backed off recently after testing the significant psychological resistance level at $50. There appears to be Bullish momentum, but WTI will likely see selling pressure again at $50.
The US EIA Crude Oil Inventories data (for the week ending May 12) will be released at 15:30 BST this afternoon with a consensus of -2.360M. Please be advised that this release is likely to cause significant volatility in oil prices.
With a higher-than-expected figure, we will likely see a retracement lower and support areas tested.
With a lower-than-expected figure, we will likely see the price test higher resistances again.
The resistance level is at 49.30, followed by 49.60 and 50.00.
The support line is at 49.00, followed by 48.70 and 48.40.
Financial Markets ‘Trumped’ Once Again
A feeling of unease gripped the financial markets on Wednesday with investors shrinking away from riskier assets after political turmoil enveloped Donald Trump's administration. Asian shares were mostly lower during early trading on Wednesday and bearish contagion has already contaminated European equities. With the latest bombshell developments in the Trump saga seen as an obstacle that may delay the proposed fiscal spending further, Wall Street should follow the bearish cues from Asian and European markets this afternoon.
UK earnings falling behind inflation
Sterling popped slightly higher on Wednesday following reports of Britain's unemployment rate hitting a 42-year low at 4.6% in the first quarter of 2017. While such news was encouraging, the thorn in the side remained the shrinking average weekly earnings of 2.1% in the first quarter, which was the fastest decline in three years. The ever-increasing signs of real wages failing to keep up with inflation is likely to pressure consumers further and provide even more headwinds for the Bank of England.
The unending uncertainty over Brexit, a dovish stance by the BoE and slower consumer spending are all valuable ingredients needed to revive Sterling bears. Although a catalyst to start the selloff is currently lacking, there may be opportunities provided when the official Brexit negotiations get underway. From a technical standpoint, the GBPUSD remains in a very wide range on the daily charts. Long term bears have some control below the tough 1.3000 resistance level. Intraday bullish traders may exploit a breakout above 1.2950 to send prices towards 1.3000
Greenback punished by Trump woes
The Greenback was robbed of its crown this week after investors became jittery over the political turmoil in the US endangering prospects for pro-growth fiscal policies. Revelations of President Donald Trump sharing classified intelligence to Russian officials has dented appetite for the Dollar with recent reports of him asking the recently dismissed FBI Director, James Comey, to drop a probe into former National Security Adviser Michael Flynn, fuelling the downside pressure. With a growing chorus of Democrats accusing Trump of obstructing justice and even clling for his impeachment, the Trump administration could come to an early season finale.
Although Dollar bullish bets have been an investor's popular choice since Trump's victory in November, the rapidly diminishing optimism over the implementation of the proposed fiscal policies may trigger a shift in sentiment. The thick layer of uncertainty surrounding Trump should encourage short term Dollar bears to look beyond the US rate hike expectations with the Greenback poised to edge lower.
Focusing on the technical side, the Dollar Index is under intense selling pressure on the daily charts. A breakdown and daily close below $98 may provide a foundation for sellers to target $96.
Commodity spotlight – WTI Crude
Oil prices depreciated on Wednesday after industry data showed an unexpected increase in US Crude inventories, which fanned concerns over the excessive oversupply in the global markets. Although oil markets have been somewhat supported by reports of Saudi Arabia and Russia agreeing that supply cuts should be extended until March 2018, the upside may be limited.
While most are optimistic over the cartel's attempt to stabilize the oil markets by cutting production, all eyes still remain on US Shale and how it reacts to further cuts by OPEC and Non-OPEC members in the future. If US Shale continues to pump aggressively, this may simply undermine OPEC's efforts, consequently limiting the upside on oil and even exposing prices to downside shocks.
No Reprieve For Dollar As Trump Troubles Mount
If you thought last week was bad for President Trump this week is becoming even worse.
The U.S President now faces the deepest crisis of his presidency after a memo written by former FBI Director Comey surfaced yesterday. It alleges that Trump asked him to drop an investigation of former National Security Adviser Michael Flynn.
The possibility of obstruction by the Trump administration is weighing on market risk appetite, boosting the yen and gold and sending stocks lower.
The 'mighty' dollar has slipped to its lowest level in seven-months on fears that current controversies will make it more difficult for the White House administration to push through pledged tax cuts and infrastructure spending.
Yesterday's weaker-than-expected housing data is also weighing on the dollar. April's U.S new-home construction declined modestly for the third consecutive time in four-months.
1. Global indices see red
In Japan, stocks came under pressure after the dollar eased against the yen (¥112.43) on weak U.S economic data, while financial underperformed hit by lower U.S yields. The Nikkei shares average fell -0.5%, while the broader broader Topix also shed a similar -0.5%.
In Hong Kong, stocks ended lower, but continue to hover atop of their 21-mont highs. The Hang Seng index fell -0.2%, while the China Enterprises Index lost -0.5%.
In China, equities broke their four-day winning streak as regulatory concerns again linger. The blue-chip CSI300 index fell -0.5%, while the Shanghai Composite Index lost -0.3%.
Note: Chinese stocks had declined for five consecutive weeks amid concerns that Beijing's stepped-up efforts to reduce leverage would trigger liquidity stress and damage the economy.
In Europe, majority of indices remain on the back foot on Trump hearsay conversations. However, the FTSE 100 is outperforming as energy prices and air transport providing early support.
U.S stocks are set to open deep in the red (-0.5%).
Indices: Stoxx50 -0.2% at 3271, FTSE flat at 7523, DAX -0.4% at 12753, CAC-40 -0.5% at 5378, IBEX-35 -0.4% at 10937, FTSE MIB -0.6% at 21648, SMI -0.4% at 9088, S&P 500 Futures -0.5%.
2. Oil dips on U.S inventory build, gold shines
Oil prices are on the back foot after industry data yesterday showed a surprise increase in U.S crude inventories despite OPEC-led output cuts that Saudi Arabia and Russia want extended.
Yesterday's U.S API crude inventories rose by +882K in the week ending May 12 to +523m barrels, resisting expectations of a drop.
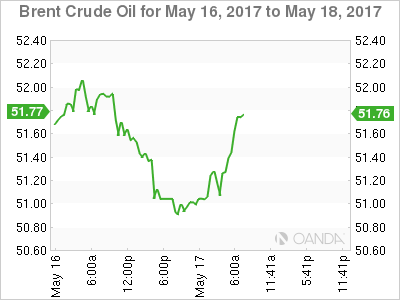
Brent crude is down -15c at +$51.50 per barrel, while U.S light crude (WTI) fell -26c to +$48.40.
Both benchmarks have rallied more than +$5 a barrel since hitting five-month lows last week.
Note: Data from the government's Energy Information Agency, which is seen as more complete, is due this morning (10:30 am EST). Analysts are expecting another draw on inventories for the sixth consecutive week, falling -2.4m barrels.
Global inventories remain high, and the output from other producers, especially the U.S is rising, which is keeping prices below the psychological +$60 some OPEC members would like to see.
OPEC and non-OPEC countries meet to decide policy on May 25 in Vienna.
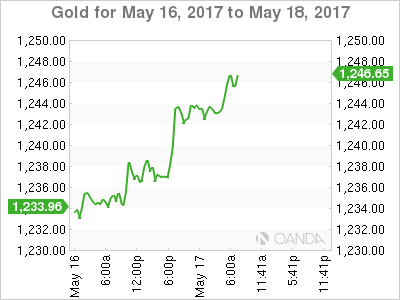
Ahead of the U.S open, gold prices have rallied for a fifth straight day, boosted by a weakening dollar. The spot price of gold has climbed +0.52% to +$1,243.5 a troy ounce.
3. U.S yields trade at the lower end of range
U.S. Treasury yields are under pressure after yesterday's data showed that U.S homebuilding unexpectedly fell in April, adding to recent economic weakness that has raised new doubts over how many times the Fed will raise interest rates this year.
Last Friday's disappointing U.S Retail Sales and CPI data has fixed income dealers trimming the odds for a Fed hike next month. Fed fund futures currently see a +68% chance of a hike, down from +83% pre-data release.
U.S 10-year Treasury yields have dipped to +2.29%, again flirting with its lowest level in two-weeks.
Note: U.S 10-year yields have largely held in a range between around +2.20% and +2.40% since late March as the market waits for clarity on whether the Trump administration is likely to pass tax and fiscal overhauls this year.
Elsewhere, benchmark yields in France lost -3 bps to +0.86%, while those in Germany declined -3 bps to +0.41%.
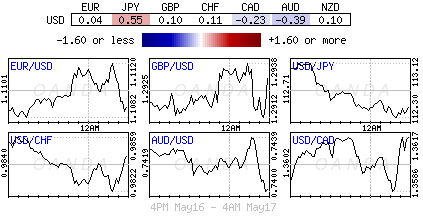
4. Diverging rate differential starting to take on a new effect.
The USD remains in trouble, flirting with new post U.S Presidential lows on Trump political troubles and a recent spat of softer U.S economic data.
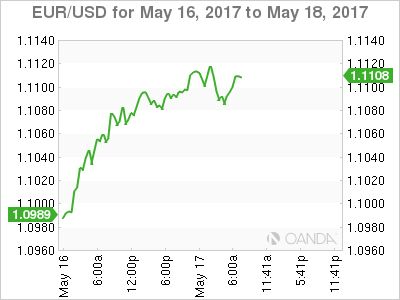
With the Eurozone beginning to see more positive data, conversations are starting the call for the ECB to think about normalizing its monetary policy. The 'single' unit hit an overnight high of €1.1117 and many analysts continue to see further upside for the EUR. As long as €1.1030 is not broken, a further rise to €1.1150 remains on the cards.
GBP (£1.2940) was little fazed by this morning's April Claimant Count data that rose by over +19K. It has been unable to find the momentum to tackle the psychological £1.30 handle – fixed income dealers are pricing in a BoE unlikely to raise interest rates in 2017 or 2018. With the Fed on track to hike rates next month and the worries of tough Brexit negotiations with the E.U, sterling bears have their sights on a sub £1.28 in the short to medium-term.
Elsewhere, JPY (¥112.34) is firmer as risk aversion again creeps back into sentiment.
5. U.K unemployment at four-decade low, but real wages fall
Data this morning showed that U.K unemployment rate fell to a 40-year low in Q1 (-0.2% to +4.6%), but regular wages adjusted for inflation declined for the first time in three-years (-0.2%).
Note: U.K's annual inflation stood at +2.7% in April – the fastest rate of price growth in over three-years, overshooting the BoE's +2% target for the third consecutive month.
This data would suggest that ahead of Brexit negotiations Britons are facing a living standards squeeze despite the robust labor market and provide a potential drag on the U.K's economic growth just as PM Theresa May goes to the polls in a general election on June 8.
Note: Polls are suggesting she is likely to increase her parliamentary majority, but individuals economic squeeze will help the Labour Party to shift focus from Brexit to individual's living standards.
After Strong CPI Figures, Will UK’s Wages Catch Up?
The US dollar extended declines strongly for another day as economic data in the US continued to come out weaker. The latest reports showed that the U.S. housing starts fell 2.6% in April, missing estimates of 3.7% increase. Building permits were also down 2.5% against a forecast of 0.2% increase. The previous revisions also saw the numbers being trimmed, pushing the fourth quarter and Q1 housing data somewhat weaker than initially reported.
On the bright side, industrial production rose 11%, beating expectations of a 0.4% increase. However, the data did not help to soothe concerns as the U.S. dollar index futures were trading at a 7-month low.
Across the Atlantic, Eurozone's preliminary Q1 GDP rose 0.5% as suggested by the preliminary data from earlier this month but the ZEW German economic sentiment fell to 20.6 missing forecasts of 22.3. In the UK, consumer prices jumped 2.7% on an annual basis, accelerating from 2.3% previously.
Looking ahead, economic calendar today will see the UK's monthly job numbers with focus on wages. Average earnings is expected to post a modest increase of 2.4%, but will still be lagging behind inflation rate. The Eurozone will be publishing the final inflation figures which will confirm a rebound in consumer prices in April.
EURUSD intraday analysis
EURUSD (1.1104): The EURUSD rose to a 6-month high earlier today with price seen testing the waters above $1.1100. The strong pace of gains in the common currency comes from last Friday's rebound in prices which quickly developed into a strong rally. With price now at 1.1100, we expect to see a moderate pullback towards 1.1000 ahead of what could be a sideways price action with the potential for prices to slip towards 1.0900.
USDJPY intraday analysis
USDJPY (112.48): Price action in USDJPY was fairly stable compared to the gains recorded by the EURUSD, although the dollar closed on a bearish note against the yen. Price is seen testing 112.50 support on the daily chart currently and a break down below this level could trigger further declines towards 109.50 - 110.00 region. However, in the near term, USDJPY could be seen trading range bound within 113.50 and 112.50 with a break out from either of these levels signaling the next trend.
GBPUSD intraday analysis
GBPUSD (1.2930): The British pound has managed to hold on to the gains after gapping lower on Monday's open, close to 1.2800 support level. Still, the currency consolidation above 1.2800 is looking weak with price still trading below the previous highs of 1.2988. In the near term, the breakout from 1.3000 or 1.2800 will be critical in shaping further trends in GBPUSD. On the 4-hour chart, price action looks bearish after failing to close higher from the breakout level off the rising wedge pattern that was formed last week.
DAX Dips As Political Uncertainty Grips Washington
The DAX index has posted slight losses in the Tuesday session. Currently, the DAX is trading at 12,758.00. On the economic front, Eurozone Final CPI climbed 1.9%, matching the forecast. Final Core CPI improved to 1.2%, also matching the estimate. On Thursday, the president of the ECB, Mario Draghi, will speak at an event at the University of Tel Aviv.
Global stock markets are lower due to the political uncertainty which has engulfed Washington. The US media is having a field day, as the Trump administration lurches from scandal to scandal. On Tuesday, reports surfaced that President Trump asked former FBI director James Comey to end an investigation into ties between Russia and Trump’s former security adviser, Michael Flynn. Another brewing controversy is Trump’s passing of classified intelligence to the Russian foreign minister earlier this week. Trump initially denied the claim, but has since backtracked, admitting that he did share intel with the Russians, but that he had acted within his rights. With the Trump administration busy putting out political fires, investors are growing increasingly nervous that the president’s agenda for a stimulus package and tax reform will stall, and the euro has taken advantage, gaining 1.5% against the greenback.
The markets were on the money in predicting euro-area inflation data. Eurozone Final CPI matched the forecast with a strong gain of 1.9% in April, considerably higher than last month’s gain of 1.5%. Eurozone inflation is closing in on the ECB’s target of 2.0%, which could increase pressure on the ECB to consider tapering its ultra-loose monetary policy. Germany, for one, is finding that ultra-low interest rates is hampering growth, and wants Brussels to adopt a tighter monetary policy. On Tuesday, Eurozone Flash GDP was unrevised from the April forecast, posting a gain of 0.6% in the first quarter. The eurozone continues to show improved numbers in 2017, boosted in no small part by the German economy, which also expanded 0.6% in the first quarter. The well-respected ZEW Economic Sentiment surveys, which gauge optimism among investors and analysts, were a mixed bag for May. The German indicator improved to 20.6, short of expectations. What was more surprising was the unexpected jump from the Eurozone indicator, which improved to 35.1, its strongest level in almost two years.
A rise in oil prices has boosted stock markets on Monday, as Brent crude climbed close to 2 percent. This surge boosted the DAX, which briefly touched a high of 12,833.00, a new record. The first quarter of 2017 has seen improved numbers in the euro area, largely due to strong numbers from Germany, the largest economy in the eurozone. Germany’s economy expanded 0.6% in the first quarter, compared to a 0.4% gain in Q4 of 2016. What was particularly encouraging was that the expansion was broadly based, with strong consumer and state spending, and an upsurge in the construction and manufacturing and export sectors.
Market Update – European Session: Euro Zone Apr Final CPI Confirms Improvement In Core Reading
Notes/Observations
Euro Zone Apr final CPI confirms improvement in core reading
CBOE Volatility Index rises 10.9% to 11.74 (highest reading since Apr 24th)
Overnight:
Asia:
BOJ Gov Kuroda: Inflation remained far from target; told PM Abe that central bank to continue with current easing policy. No comment about whether talks discussed his reappointment to BOJ.
S&P affirmed Australia AAAsovereign rating; outlook remained negative
Europe:
ECB's Coeure (France): recent measurable increase in long-term yields has not affected our monetary policy stance
Americas:
President Trump reportedly asked former FBI Director Comey to shut down investigation into National Sec Adviser Flynn, according to memo Comey wrote. Comey said to have created similar memos about every phone call and meeting he had with the president
White House says the President never asked Comey to end the Flynn investigation
Energy:
Weekly API Oil Inventories: Crude: +0.9M v -5.8M prior; first build in 3 weeks
Economic Data
(AT) Austria Apr CPI M/M: 0.2% v 0.6% prior; Y/Y: 2.1% v 1.9% prior
(IT) Italy Mar Total Trade Balance: €5.4B v €1.9B prior; Trade Balance EU: €1.3B v €0.2B prior
(UK) Apr Jobless Claims Change: +19.4K v +25.5K prior; Claimant Count Rate: 2.3% v 2.2% prior
(UK) Mar Average Weekly Earnings 3M/Y/Y: % v 2.4%e; Weekly Earnings (ex Bonus) 3M/Y/Y: % v 2.1%e
(UK) Mar ILO Unemployment Rate 3M/3M: % v 4.7%e
(EU) Euro Zone Apr CPI M/M: 0.4% v 0.4%e; Y/Y (Final reading): 1.9% v 1.9%e; CPI Core Y/Y(Final reading): 1.2% v 1.2%e
Fixed Income Issuance:
(EU) EFSF opened book to sell 16-year bonds via syndicate; guidance seen at +7bps to mid-swaps
(DK) Denmark sold DKK 5.01B in new 2020 bond; Yield -0.34%; bid-to-cover: 2.48x
(IN) India sold total INR140B in 3-month and 6-month Bills (INR80B and INR60B respectively)
(EU) ECB allotted $40M in 8-day USD Liquidity Tender at fixed 1.41% vs $35M prior
(SE) Sweden sold total SEK2.5B in 2022 and 2032 Bonds
SPEAKERS/FIXED INCOME/FX/COMMODITIES/ERRATUM
Equities
Indices [Stoxx50 -0.2% at 3271, FTSE flat at 7523, DAX -0.4% at 12753, CAC-40 -0.5% at 5378, IBEX-35 -0.4% at 10937, FTSE MIB -0.6% at 21648, SMI -0.4% at 9088, S&P 500 Futures -0.5%]
Market Focal Points/Key Themes
European Indices have been on the back foot this morning with overnight press speculation that President Trump had asked Former FBI director James Comey to stop the investigation into Michael Flynn.The FTSE 100 is outperforming this morning, with the Italian FTSE MIB the laggard being weighed down by Fiat Chrysler shares on the back of reports the EU will open proceedings against Italy over exhaust emissions. On the earnings front Bouygues shares trading higher after reporting a narrower loss for the year, where as ABN Amro is under pressure following Q1 results. Looking ahead to the US morning, notable earnings due from retailer Target, and American Eagle.
Equities
Consumer discretionary [Coats [COA.UK] +6.8% (Trading update, raises outlook), Ubisoft [UBI.FR] -6.3% (Earnings)
Industrials: [Fiat Chrysler [FCA.IT] -1.5% (Reported investigation in to emissions), Lenzing [LNZ.AT] -13% (B&C sells 3.34M shares for €164.25/shr ), ThyssenKrupp [TKA.DE] +3.8% (TATA Steel UK Pension deal)]
Financials: [Countryside properties [CSP.UK] +1.4% (Earnings), Foxtons [FOXT.UK] -3.4% (trading update), ABN Amro [AABN.NL] -3.0% (Earnings), LLoyds [LLOY.UK] +2.2% (Government divests remaining stake), Flow traders [FLOW.NL] -8.5% (Earnings)]
Utilities: [Suez Environment [SEZ.UK] -1.0% (Capital Increase)]
Energy: [Tullow Oil [TLW.UK] +4.0% (Oil discovery in Kenya)]
Speakers
BOE Agents Summary: Consumer spending growth has moderated in real terms. spending power had been hit by higher prices. Consumer goods price inflation had picked up markedly. Recruitment conditions had tightened a little further, with skills shortages reported in a wider range of activities
EU's Tusk reiterate in EU Parliament that its stance on Brexit negotiations must be based upon a phased approach; to make guideline more precise when the time comes
EU's Chief Brexit negotiator Barnier: Wanted to start Brexit vote after June 8th UK vote; no intention to end up with no deal. Sequencing was crucial to success of negotiations; had to settle accounts with UK but no figures set yet for EU demands that UK pay before leaving. Amount depended on methodology and exit date
German Dep Fin Min Spahn: There will be negative side effects unless monetary policy normalizes
Iceland Central Bank Statement noted that inflation outlook had improved for 2017 and 2018 period but had deteriorated further out on the forecast horizon. Scaled down its intervention in the FX market in view of its stronger foreign exchange reserves. Appreciation of the ISK currency (Krona) was considered to reflect economic fundamentals. Prospect of more fiscal easing in 2017 than previously forecasted
China FX Regulator SAFE: April domestic FX demand was more balanced
Currencies
Diverging rate differential starting to take on a new effect.
USD continued to be on the defensive with dealers attributing some attributes regarding rising concerns over Trump, President Trump reportedly asked former FBI Director Comey to shut down investigation into National Sec Adviser Flynn, according to memo Comey wrote. Comey said to have created similar memos about every phone call and meeting he had with the President. A recent spat of softer US economic data also the greenback at bay with the number of Fed rate hikes steady at 3 for 2017. Recent positive data from Europe has started the call for ECB to think about normalizing its monetary policy.
GBP was little phased by April Claimant Count data that rose by over 19K and the Claimant Count Rate ticked higher to 2.3%. The ILO Unemployment rte fell to its lowest level since 1975 with its 4.6% reading.
The JPY currency was firmer as some risk aversion crept back into sentiment. South Korea President Moon says "high possibility" of conflict with North . USD/JPY was softer by 0.5% at 112.50 area
Fixed Income
Bund futures trade at 160.67 up 25 ticks, approaching last week’s high of 160.99. Initial resistance comes from the 161.01 level, while medium –term resistance lies near the April 27th high of 162.01 level followed by 163.68. A break of 160.01 support level could see lows target 159.01 followed by 157.50.
Gilt futures trade at 128.04 higher by 39 ticks, but off the highs of 128.21 after UK jobless claims and unemployment rate came in better than expected. Last week’s rally saw a pause from the continuation of the pullback from the 129.14 April 18th high. Price still finds key support at the 126.41 support level. An acceleration lower could test the 125.80 region. Resistance remains the 128.51 level then 129.14 followed by 132.80.
Wednesday’s liquidity report showed Tuesday’s excess liquidity declined to €1.6510T a drop of €2.6B from €1.6536T prior. Use of the marginal lending facility fell to €191M from €227M prior.
Corporate issuance saw over $11.2B come to market via 7 issues headlined by Morgan Stanley $3.25B in 5-year senior unsecured benchmark bonds, PNC Financial Services Group 3-part US benchmark note offering, and BNP Paribas $1B in 5-year non-preferred bond.
Looking Ahead
(IL) Israel May CPI Forecast: No est v 0.6% prior
(BR) Brazil May CNI Industrial Confidence: No est v 53.1 prior
05:30 (DE) Germany to sell €1.0B in 2.5% July 2044 bunds
05:30 (PT) Portugal Debt Agency (IGCP) to sell 6-month and 12-month bills
06:00 (PT) Portugal Apr PPI M/M: No est v -0.3% prior; Y/Y: No est v 4.0% prior
06:00 (PL) Poland Central Bank (NBP) Interest Rate Decision: Expected to leave Base Rate unchanged at 1.50%
06:00 (RU) Russia weekly OFZ bond auction ; to sell combined RUB50B in 2022 and 2033 OFZ bonds
07:00 (US) MBA Mortgage Applications w/e May 12th: No est v +2.4% prior
07:00 (ZA) South Africa Mar Retail Sales M/M: -0.5%e v +0.8% prior; Y/Y: -1.0%e v -1.7% prior
07:00 (UK) Prime Minister's Question Time in House of Commons
07:30 (SE) Sweden Central Bank (Riksbank) Floden speech
08:15 (UK) Baltic Dry Bulk Index
08:30 (CA) Canada Mar Manufacturing Sales M/M: +1.3%e v -0.2% prior
09:00 (RU) Russia Q1 Advance GDP Y/Y: 0.4%e v 0.3% prior
09:00 (DE) German Chancellor Merkel at G20 Labor conference in Berlin
10:00 (PL) Poland Central Bank Gov Glapinski to hold post rate decision press conference
10:30 (US) Weekly DOE Crude Oil Inventories
11:10 (US) Former Fed Chair Bernanke at conference
12:00 (DE) German Fin Min Schaeuble
Technical Outlook: AUDUSD – 10SMA Is So Far Holding Pullback From 0.7440 Rejections
The Aussie fell on Wednesday despite weaker US dollar, driven by increased EUR/AUD demand and AUD/JPY sales on current situation in the markets.
Pullback from double upside rejection at 0.7440 zone (50% of 0.7554/0.7327 downleg, reinforced by falling 20SMA and 4-hr cloud top) was so far contained by strong support at 0.7390 provided by 10SMA and nearby daily Tenkan-sen (0.7385), however, risk remains shifted to the downside.
Daily RSI is turning lower and slow stochastic is reversing just under overbought zone boundary, which may signal further easing, as overall picture is bearish.
Stronger negative signal could be expected on firm break below 0.7390/85 pivots that may trigger fresh weakness towards next supports at 0.7373/68 (Fibo 61.8% of 0.7329/0.7444 / 4-hr cloud base), loss of which would confirm reversal and lower top at 0.7444.
Alternative scenario requires current weakness to stay above 0.7390, with fresh attempts higher to emerge from here. Bounce back to pivotal 0.7440 resistance zone and eventual break higher is needed to signal resumption of recovery leg from 0.7329.
Res: 0.7406, 0.7419, 0.7433, 0.7444
Sup: 0.7390, 0.7385, 0.7373, 0.7368
GOLD Medium-Term Bullish, SILVER Testing Fibonacci Retracement At 16.92, CRUDE OIL Expected To Show Bullish Pressures Up To $50.
GOLD Medium-term bullish.
Gold seems on its way back up. Hourly support is now located at 1195 (10/03/2017 low). Expected to show further upside pressures.
In the long-term, the technical structure suggests that there is a growing upside momentum. A break of 1392 (17/03/2014) is necessary ton confirm it, A major support can be found at 1045 (05/02/2010 low).
SILVER Testing Fibonacci retracement at 16.92.
Silver is bouncing back. Strong support is given at 15.63 (20/12/2017 low). Closest support is given at 16.20 (04/05/2017 low). Key resistance is given at a distance at 19.00 (09/11/2017 high).
In the long-term, the death cross indicates that further downsides are very likely. Resistance is located at 25.11 (28/08/2013 high). Strong support can be found at 11.75 (20/04/2009).
CRUDE OIL Expected to show bullish pressures up to $50.
Crude oil continues to bounce on shortsqueeze move. Support is given at a distance 43.76 (05/05/2017 low). Demand is very strong and crude oil is set to be monitor again the $50 mark.
In the long-term, crude oil has recovered after its sharp decline last year. However, we consider that further weakness are very likely. Strong support lies at 24.82 (13/11/2002) while resistance can now be found at 55.24 (03/01/2017 high).
EUR/JPY Sideways Price Action, EUR/GBP Growing Demand, EUR/CHF Slowly Declining.
EUR/JPY Sideways price action.
EUR/JPY's bullish run has broken resistance at 124.59 (07/05/2017 high), Hourly support is given at 122.93 (05/05/2017 low). Major support is given at 114.90 (18/04/2017low). Expected to see further renewed buying pressures towards 126.00.
In the longer term, the technical structure validates a medium-term succession of lower highs and lower lows. As a result, the resistance at 149.78 (08/12/2014 high) has likely marked the end of the rise that started in July 2012. Strong support at 94.12 (24/07/2012 low) looks nonetheless far away.
EUR/GBP Growing demand.
EUR/GBP is strengthening. The technical has turned positive since the pair has broken resistance at 0.8530 (25/04/2017 low). Support can be found at 0.8304 (05/12/2017 low). Expected to see further consolidation around 0.8600.
In the long-term, the pair has largely recovered from recent lows in 2015. The technical structure suggests a growing upside momentum. The pair is trading above from its 200 DMA. Strong resistance can be found at 0.9500 psychological level.
EUR/CHF Slowly declining.
EUR/CHF is getting lower. Despite the sharp increase and the recent bullish breakout which was very likely psychological, we believe that the medium-term pattern suggests us to see at some point renewed bearish pressures towards key support that can be found at 1.0623 (24/06/2016 low).
In the longer term, the technical structure is mixed. Resistance can be found at 1.1200 (04/02/2015 high). Yet,the ECB's QE programme is likely to cause persistent selling pressures on the euro, which should weigh on EUR/CHF. Supports can be found at 1.0184 (28/01/2015 low) and 1.0082 (27/01/2015 low).