

Sample Category Title
EUR/CHF Daily Outlook
Daily Pivots: (S1) 1.0911; (P) 1.0935; (R1) 1.0948; More...
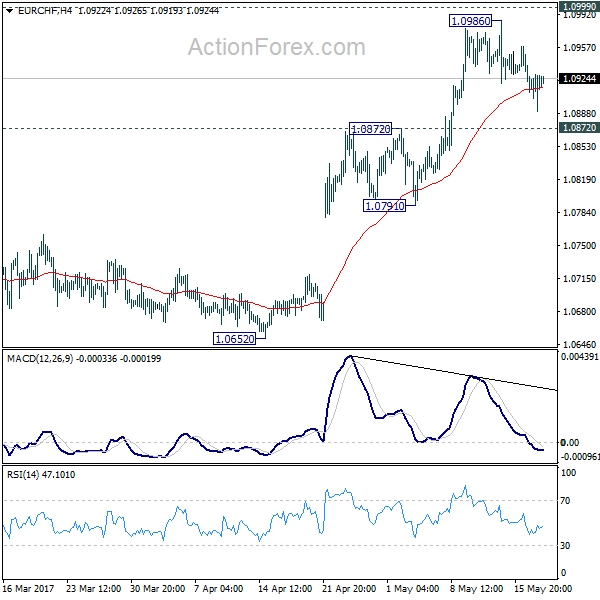
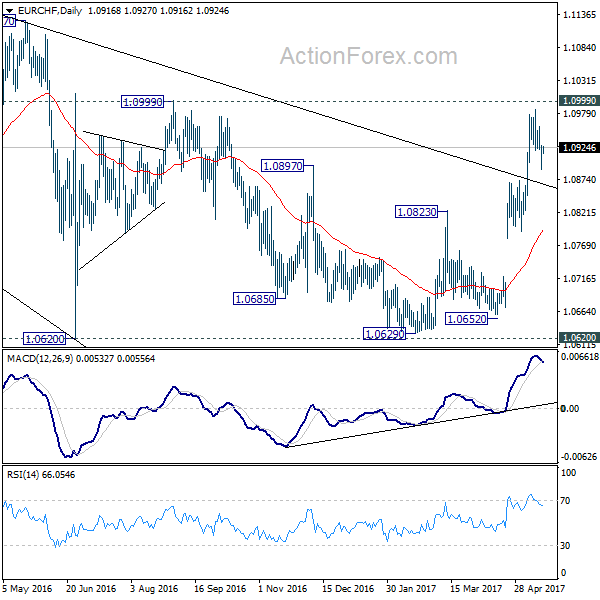
EUR/CHF is staying in consolidative trading below 1.0987 short term top and outlook is unchanged. Intraday bias stays neutral first. Pull back from 1.0986 might go deeper. But downside should be contained by 1.0791/0872 support zone to bring rise resumption. We're holding on to the bullish view that corrective pattern from 1.1198 has completed already after defending 1.0653 fibonacci level. Firm break of 1.0999 resistance will pave the way for a retest on 1.1198 high.
In the bigger picture, the price actions from 1.1198 are seen as a corrective move. Current strong rebound is raising the chance that it's completed after defending 38.2% retracement of 0.9771 to 1.1198 at 1.0653. Decisive break of 1.0999 resistance will target a test on 1.1198 high. For now, this will be the preferred case as long as 1.0791 support holds.
EUR/USD Daily Outlook
Daily Pivots: (S1) 1.1104; (P) 1.1133 (R1) 1.1187; More....
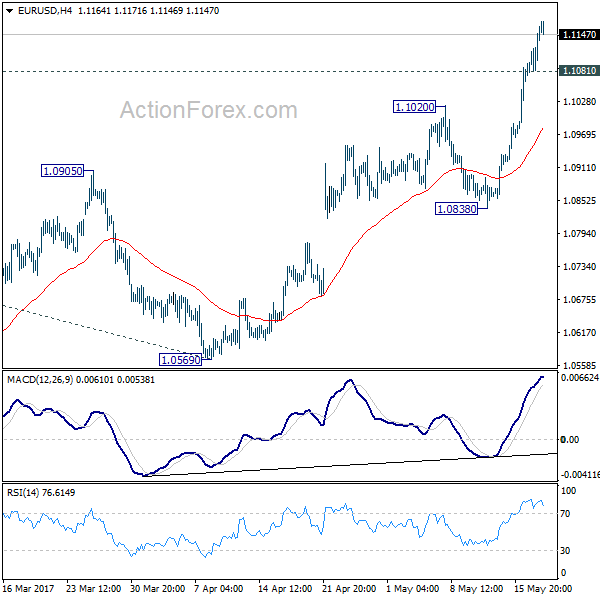
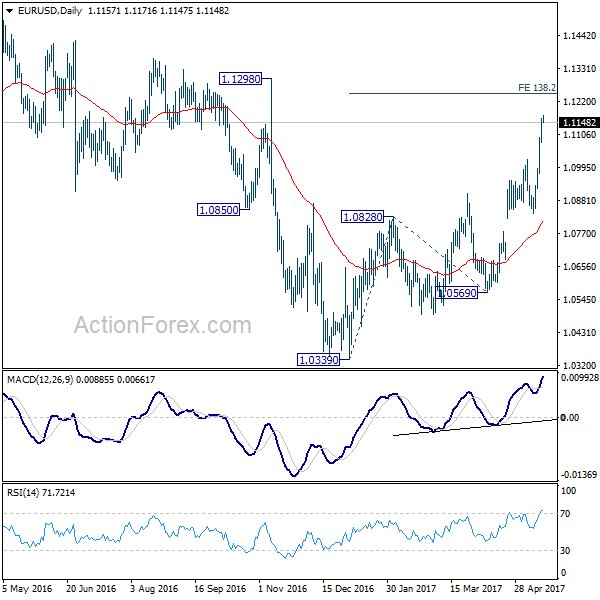
EUR/USD's rally extends to as high as 1.1171 so far and intraday bias remains on the upside. Current rally would target 138.2% projection of 1.0339 to 1.0828 from 1.0569 at 1.1245, which is close to 1.1298 key resistance. For now, we'd be cautious on strong resistance between 1.1245/1298 to limit upside and bring reversal. On the downside, below 1.1081 minor support will turn bias neutral and bring consolidation. But break of 1.0838 support is needed to indicate short term topping. Otherwise, further rise will remain in favor.
In the bigger picture, as long as 1.1298 key resistance holds, whole down trend from 1.6039 (2008 high) is still expected to continue. Break of 1.0339 low will send EUR/USD through parity. However, considering bullish convergence condition in weekly MACD, break of 1.1298 will indicate long term reversal. In such case, further rally would be seen back to 1.2042 support turned resistance next.
Elliott Wave View: FTSE 100 Turning Lower
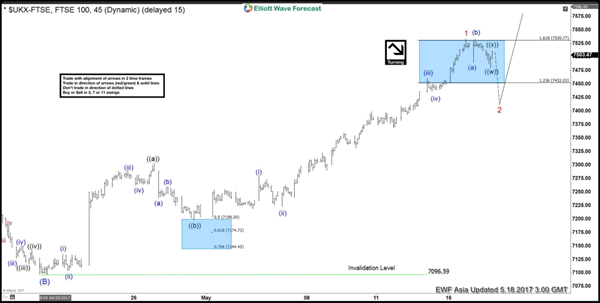
Short Term Elliott Wave view in FTSE 100 suggests the rally from 4/20 low (7096.6) is unfolding as a zigzag Elliott Wave structure where Minute wave ((a)) ended at 7302.57 and Minute wave ((b)) ended at 7197.28. Subdivision of Minute wave ((a)) is unfolding as an impulse where Minuttte wave (i) ended at 7134.53, Minutte wave (ii) ended at 7104.22, Minutte wave (iii) ended at 7290.82, Minutte wave (iv) ended at 7262.32, and Minutte wave (v) of ((a)) ended at 7302.57. FTSE 100 has since broken above 7302.57 suggesting Minute wave ((c)) has started.
Minute wave ((c)) is unfolding as an ending diagonal where Minutte wave (i) ended at 7280.7, Minutte wave (ii) ended at 7222.81, Minutte wave (iii) ended at 7460.20, and Minutte wave (iv) ended at 7435.64. Index has reached 1.618 extension of the Minute ((a)) – ((b)) and thus cycle from 4/20 low is mature and we are calling Minor wave 1 completed at 7533.7. Expect FTSE 100 to correct cycle from 4/20 low within Minor wave 2 in 3, 7, or 11 swing before the rally resumes. We don’t like selling the proposed pullback and expect buyers to appear again when Minor wave 2 pullback is over in 3, 7, or 11 swing.
If the Index does not do a decent pullback from here to correct cycle from 4/20 low, then the move from 4/20 low could be labelled as a regular 5 waves Impulse Elliott Wave structure in which case we are ending Minor wave 3 at recent high (7533.7) and the Index will do shallow pullback in Minor wave 4 and then extend higher again in Minor wave 5 before ending cycle from 4/20 low and see larger pullback. In both cases, we don’t like selling the Index and expect buyers to appear in the dips in 3, 7 or 11 swings.
FTSE 100 1 Hour Elliott Wave Chart
GBP/USD Daily Outlook
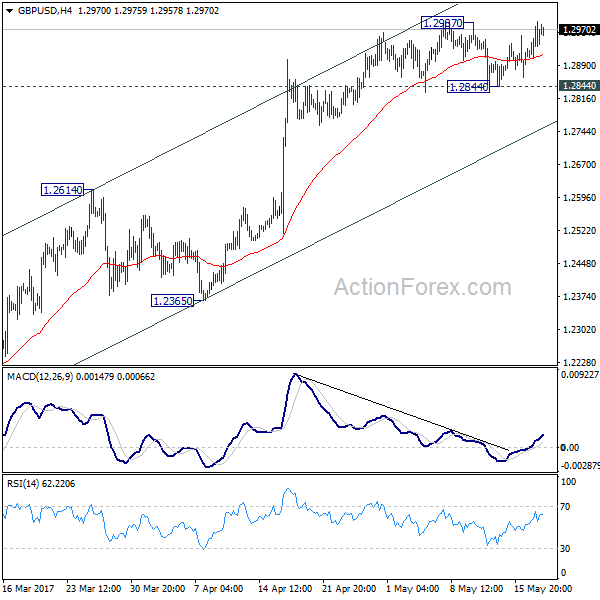
Daily Pivots: (S1) 1.2919; (P) 1.2955; (R1) 1.3004; More...
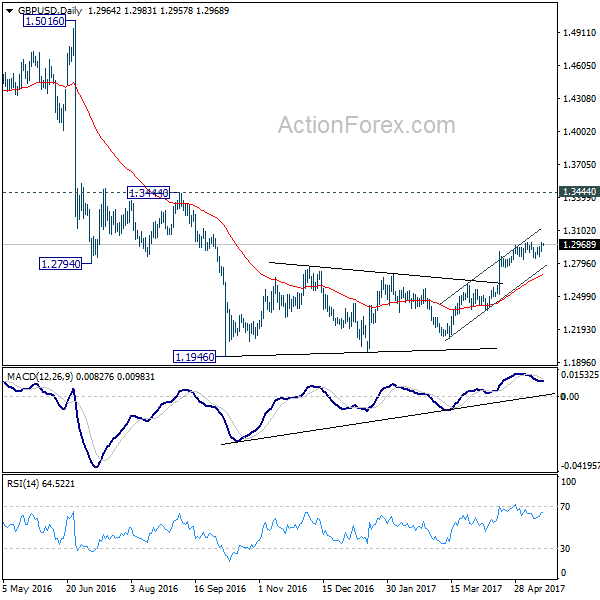
GBP/USD's breach of 1.2987 resistance suggests that recent rally is resuming. Intraday bias is back on the upside. Based on broad based weakness in dollar, further rally would be seen. But at this point, price actions from 1.1946 are still viewed as a corrective pattern. Hence, we'd expect upside to be limited below 1.3444 to complete the correction. Though, break of 1.2844 support is needed to indicate short term topping. Otherwise, further rise would be in favor in case of retreat.
In the bigger picture, fall from 1.7190 is seen as part of the down trend from 2.1161. There is no sign of medium term reversal yet. Sustained trading below 61.8% projection of 2.1161 to 1.3503 from 1.7190 at 1.2457 will target 100% projection at 0.9532. Overall, break of 1.3444 resistance is needed to confirm medium term bottoming. Otherwise, outlook will remain bearish.
AUD/USD Daily Outlook
Daily Pivots: (S1) 0.7399; (P) 0.7421; (R1) 0.7454; More...
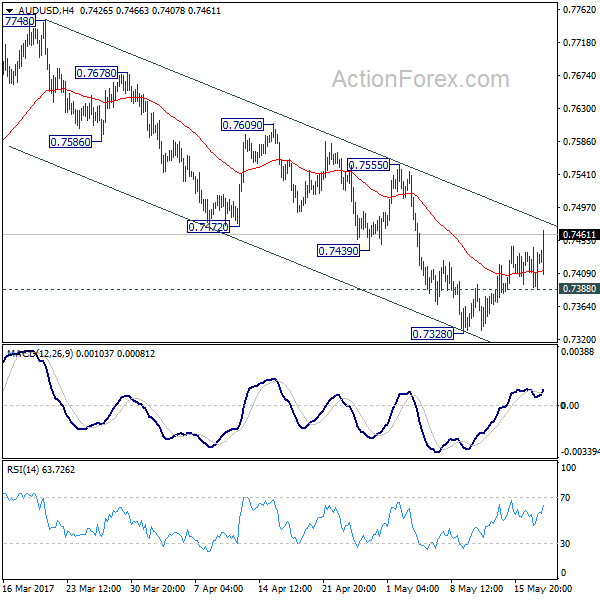
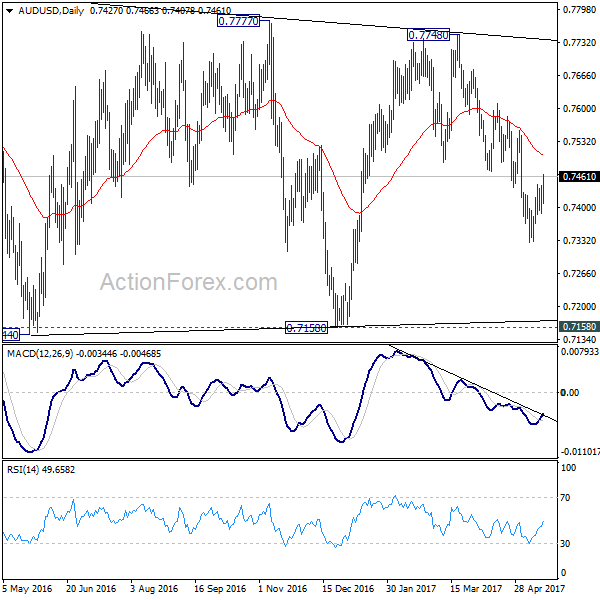
Intraday bias in AUD/USD is mildly on the upside as recovery from 0.7382 extends. But such rise is seen as a correction and should be limited below 0.7555 resistance to bring decline resumption. Below 0.7388 minor support will turn bias to the downside for 0.7382. Break there will extend the fall from 0.7748 and target 0.7144/7158 support zone. On the upside, firm break of 0.7555 will argue that fall from 0.7748 is completed and turn bias back to the upside.
In the bigger picture, we're still treating price actions from 0.6826 low as a correction pattern. And, as long as 38.2% retracement of 0.9504 to 0.6826 at 0.7849 holds, long term down trend from 1.1079 is expected to resume sooner or later. Break of 0.6826 low will target 0.6008 key support level. However, firm break of 0.7849 will indicate that rise from 0.6826 is developing into a medium term rebound, rather than a sideway pattern. In such case, stronger rise should be seen to 55 month EMA (now at 0.8115) and above.
USD/CAD Daily Outlook
Daily Pivots: (S1) 1.3568; (P) 1.3605; (R1) 1.3639; More....
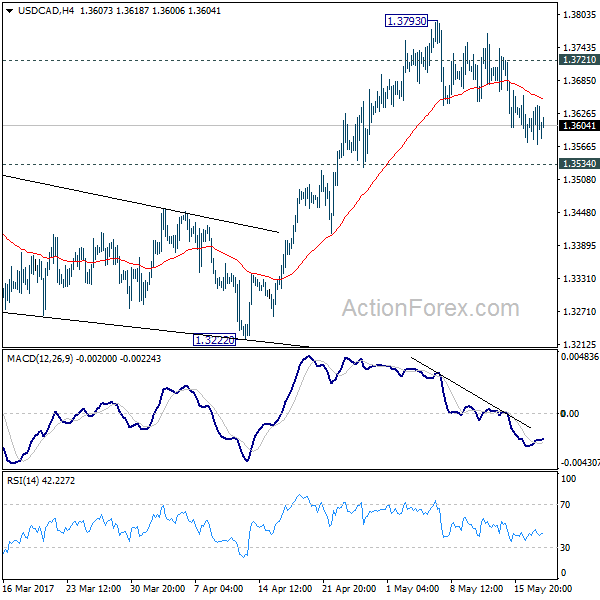
USD/CAD is losing some downside momentum with 4 hour MACD crossed above signal line. But with 1.3721 minor resistance intact, deeper decline is expected to 1.3534 resistance turned support. Break there should confirm completion of the rise from 1.2968 and target 1.3222 support next. On the upside, above 1.3721 will turn bias back to the upside and target 1.3793 and above. However, as noted before, choppy rise from 1.2460 is seen as a corrective move. In case of an extension, upside should be limited by 1.3838 fibonacci level to bring reversal.
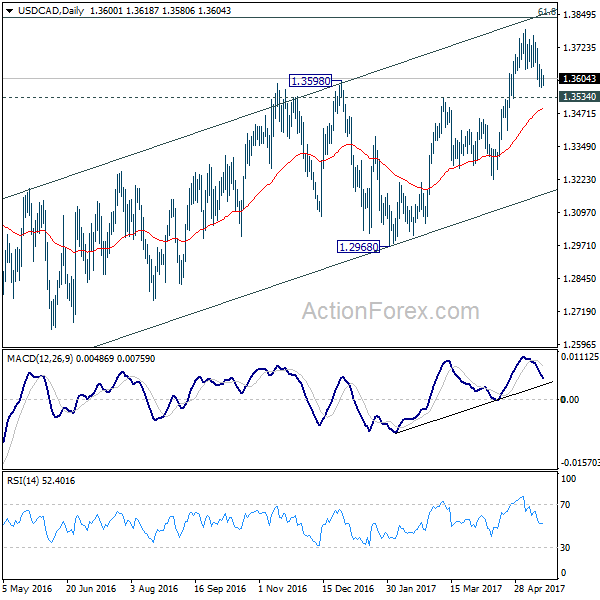
In the bigger picture, price actions from 1.4689 medium term top are seen as a correction pattern. The first leg has completed at 1.2460. Rise from 1.2460 is seen as the second leg and would end at around 61.8% retracement of 1.4689 to 1.2460 at 1.3838. Break of 1.3222 should indicate the start of the third leg while further break of 1.2968 should confirm. Nonetheless, sustained trading above 1.3838 would pave the way to retest 1.4689 high.
USD/CHF Daily Outlook
Daily Pivots: (S1) 0.9942; (P) 0.9980; (R1) 1.0003; More.....
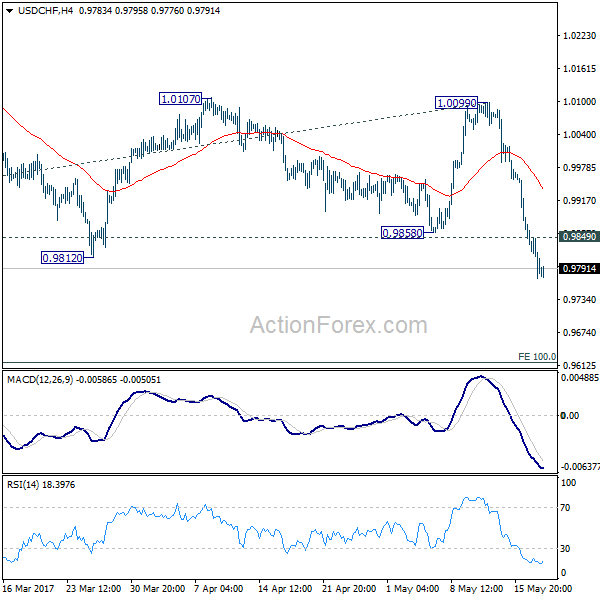
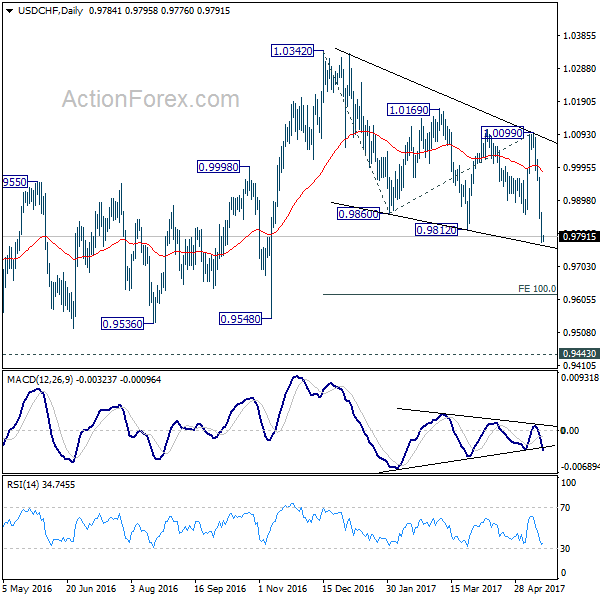
USD/CHF's fall reaches as low as 0.9773 so far and there is no sign of bottoming yet. Intraday bias remains on the downside. Based on current momentum, USD/CHF would be targeting 100% projection of 1.0342 to 0.9860 from 1.0099 at 0.9617. On the upside, above 0.9849 minor resistance will turn bias neutral and bring consolidation before staging another decline.
In the bigger picture, USD/CHF is bounded in medium term range of 0.9443/1.0342 for the moment. Consolidative trading would likely continue and medium term outlook remains neutral. Break of 1.0342 key resistance is needed to confirm underlying bullish momentum in the pair. Meanwhile, downside attempts should be contained by 0.9443 key support level.
USD/JPY Daily Outlook
Daily Pivots: (S1) 110.02; (P) 111.57; (R1) 112.37; More...
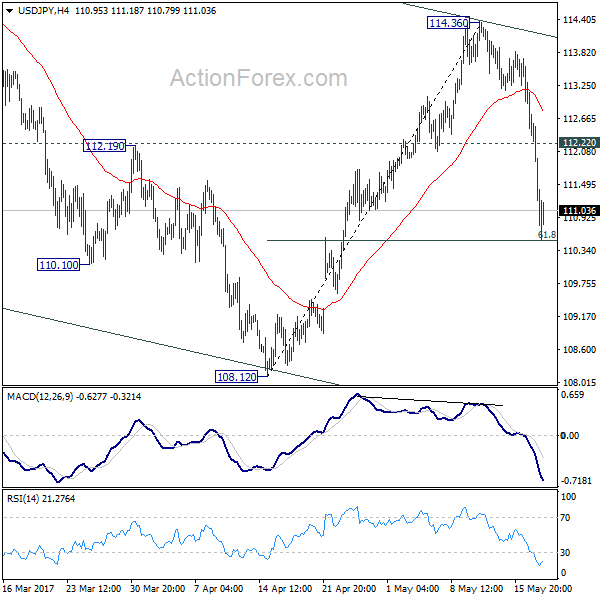
USD/JPY's fall from 114.36 extends to as low as 110.52, and recovers mildly ahead of 61.8% retracement of 108.12 to 114.36 at 110.50. There is no clear sign of bottoming yet. Break of 110.50 will bring deeper fall to 108.12 low. In that case, the whole decline from 118.65 would likely extend through 108.12 to 61.8% retracement of 98.97 to 118.65 at 106.48. On the upside, break of 112.22 minor resistance is needed to indicate completion of the fall from 114.36. Otherwise, deeper fall is still expected even in case of recovery.
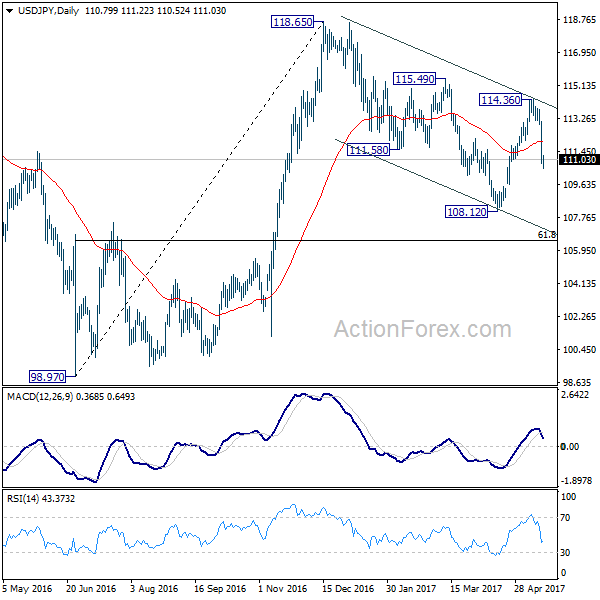
In the bigger picture, price actions from 125.85 high are seen as a corrective pattern. It's uncertain whether it's completed yet. But in case of another fall, downside should be contained by 61.8% retracement of 75.56 to 125.85 at 94.77 to bring rebound. Overall, rise from 75.56 is still expected to resume later after the correction from 125.85 completes.
DOW Tumbled on Trump Turmoil, Dollar Dived as Markets Paring Fed June Hike Bets
The financial markets are rocked as US President Donald Trump's political turmoil intensified. DOW dropped sharply by -372.82 pts, or -1.78% to close at 20606.93 overnight, the worst day since last September. S&P 500 lost -43.64 pts, or -1.82% to close at 2357.03. NASDAQ fell -158.63 pts, or -2.57% to close at 6011.24. Treasury yield also tumbled sharply with 10 year yield losing -0.113 to close at 2.216. Dollar is deeply and broadly sold off with the dollar index hitting as low as 97.33. Gold surges on Dollar weakness and breaches 1260 handle, comparing to last week's low at 1214.3. In the currency markets, Swiss Franc and Japanese Yen are trading as the strongest major currencies for the week on safe haven flow. But Euro is not far behind as the third strongest one.
Trump's Turmoil Worsens
Trump's turmoil worsened after report of his intervention on FBI investigation of former national security advisor Michael Flynn. Several congressional panels are requesting testimony from former FBI Director James Comey, fired by Trump, on the issue. At the current moment, Republican politicians generally avoided direct response to the issue while House Speaker Paul Ryan said he has full confidence on the President. But there are already some Republicans calling for new investigative panels. The Justice Department has named former FBI Director Robert Mueller as the special counsel of oversee the investigation on Russia's intervention of last year's presidential election.
Markets reacted negatively to uncertainties
Markets are so uneasy with the development as it's getting more doubtful on Trump to deliver his economic agenda. Much was priced in since last year's election on expectation of the promised corporate tax cuts from 35% to 15% and USD 1T infrastructure spending. These policy actions would now be, at the very best, deferred. Meanwhile, uncertainties have spiked much higher, risking a dysfunctional government. Former Fed chair Ben Bernanke commented on the developments and said that "one of the reasons the markets are reacting is because there's a lot of uncertainty. Things could break a lot of different ways here."
Starting to price out June hike odds
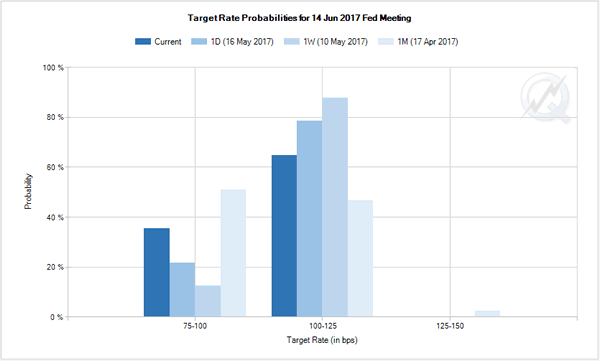
And the situation has worsen to a point that markets are starting even to price out the chance of a June Fed hike. Fed fund futures are now showing 64.6% chance of a June hike, down from 87.8% a week go.
Dollar index could be in medium term correction
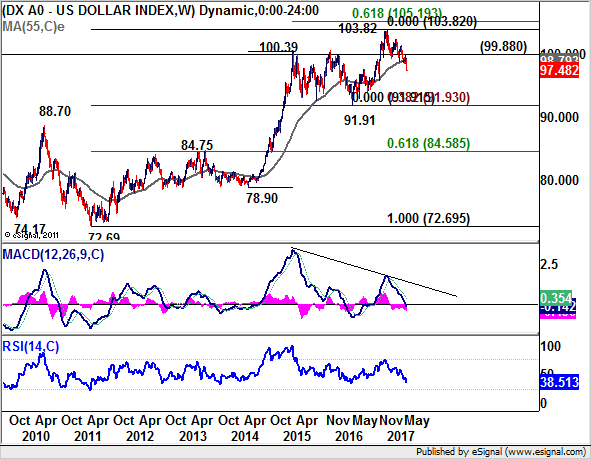
The change in market expectation is clearly reflected in the Dollar index too. Now with strong break of 55 week EMA, it's raising the chance that 103.82 is a medium term top after failing 61.8% projection of 78.90 to 100.39 from 91.91 at 105.19. That is, the five wave sequence from 72.69 could be completed. The index will remain vulnerable as long as 99.88 resistance holds. And further downside acceleration will pull the index to 91.91 cluster support (38.2% retracement of 72.69 to 103.82 at 91.91) before having strong support for sustainable rebound.
Elsewhere...
Japan GDP rose 0.5% qoq in Q1, above expectation of 0.4% qoq. GDP deflator dropped -0.8% yoy, below expectation of -0.7% yoy. Australia employment grew 37.4k in April, above expectation of 5.0k. Unemployment rate dropped to 5.7%, below expectation of 5.9%. Consumer inflation expectation rose 4.0% in May. UK retail sales will be the main feature in European session. US will release jobless claims, Philly Fed survey and leading indicators.
USD/JPY Daily Outlook
Daily Pivots: (S1) 110.02; (P) 111.57; (R1) 112.37; More...
USD/JPY's fall from 114.36 extends to as low as 110.52, and recovers mildly ahead of 61.8% retracement of 108.12 to 114.36 at 110.50. There is no clear sign of bottoming yet. Break of 110.50 will bring deeper fall to 108.12 low. In that case, the whole decline from 118.65 would likely extend through 108.12 to 61.8% retracement of 98.97 to 118.65 at 106.48. On the upside, break of 112.22 minor resistance is needed to indicate completion of the fall from 114.36. Otherwise, deeper fall is still expected even in case of recovery.
In the bigger picture, price actions from 125.85 high are seen as a corrective pattern. It's uncertain whether it's completed yet. But in case of another fall, downside should be contained by 61.8% retracement of 75.56 to 125.85 at 94.77 to bring rebound. Overall, rise from 75.56 is still expected to resume later after the correction from 125.85 completes.
Economic Indicators Update
| GMT | Ccy | Events | Actual | Forecast | Previous | Revised |
|---|---|---|---|---|---|---|
| 23:50 | JPY | GDP Q/Q Q1 P | 0.50% | 0.40% | 0.30% | |
| 23:50 | JPY | GDP Deflator Y/Y Q1 P | -0.80% | -0.70% | -0.10% | |
| 1:00 | AUD | Consumer Inflation Expectation May | 4.00% | 4.10% | ||
| 1:30 | AUD | Employment Change Apr | 37.4k | 5.0k | 60.9k | 60.0k |
| 1:30 | AUD | Unemployment Rate Apr | 5.70% | 5.90% | 5.90% | |
| 8:30 | GBP | Retail Sales M/M Apr | 1.10% | -1.80% | ||
| 12:30 | CAD | International Securities Transactions (CAD) Mar | 38.84B | |||
| 12:30 | USD | Initial Jobless Claims (MAY 13) | 240k | 236k | ||
| 12:30 | USD | Philly Fed Manufacturing Index May | 18.5 | 22 | ||
| 14:00 | USD | Leading Indicators Apr | 0.40% | 0.40% | ||
| 14:30 | USD | Natural Gas Storage | 45B |
Market Morning Briefing: The Political Turmoil In US Continues To Take Its Toll
STOCKS
Dow (20606.93, -1.78%) fell sharply yesterday over political worries in Washington. Support is seen near 20413 which could be tested before a bounce back towards 20777 is seen.
Dax (12631.61, -1.35%) also came off sharply instead of moving up towards 13000. It could test 12400 before bouncing back to higher levels.
Shanghai (3095.61, -0.28%) faced some rejection near 3120 but while above 3050, there is some scope of a rise towards 3145-3170 in the medium term.
Nikkei (19529.70, -1.44%) has come off exactly from weekly resistance near 20000 and while that holds a correction towards 19000 is possible in the coming sessions. Near term looks bearish.
Nifty (9525.75, +0.14%) looks bullish in the near term. A rise towards 10000 seems to be on the cards in the medium term.
COMMODITIES
Gold (1259) is trading at its yesterday’s high with an immediate support at 1249. If 1249 holds on a closing basis then sideways consolidation within 1249-1280 continues though the same is not our proffered view due to its overbought condition. Thus we need to keep a close watch on the price action in Dollar Index (97.44) which could give some cue on further Gold direction. We will remain bearish while it is trading below 1280 levels and a close below 1249 could open up 1230 levels as well.
We were expecting a bounce back in silver towards 16.90 levels since 11th May onwards as the scrip was highly oversold and yesterday Silver (16.90) made a intraday high of 17.03. Current trading range could be 15.70-16.90 with a bearish bias while silver is trading below 17.50 levels.
Copper (2.51) has found resistance at 2.54 levels. In the medium term 2.44 are going to be a strong support now but a close below that could open up 2.40-35 levels as well. We will remain bearish while it is trading below 2.65 levels.
Sideways consolidation in the broader ranges of 50.30-52.20 for Brent and 47.15-49.50 for WTI continues as expected. If they will manage to hold above their interim resistances of 52.20 in Brent and 49.50 in WTI, then it could implies strength in oil prices in the extreme short term time frame. Still, the bulls will be assured of strength of Brent (52.07) and WTI (48.94) only when a firm closing above 53.50 and 51.20 are made by both Brent and WTI respectively.
FOREX
The political turmoil in US continues to take its toll as Dollar cracks very sharply with the majors having their best day in quite a while.
Dollar Index (97.50) is cracking sharply in line with expectations and remains in course for our targets of 96.50-00. The best the bulls can expect at the moment is a consolidation after this sharp crack with 98.50 as ceiling but no bottoming sign is visible yet.
Euro (1.1156) has hit a high of 1.1174 so far, not too far away from our initial target of 1.1200 but at this rate of rise, even the higher target of 1.1300 may be met by the next week.
Dollar Yen (111.06) broke below 112.00 and tested the interim support of 110.50 in a sharp decline. This support area of 110.50-00 may arrest the decline for the rest of the week and a consolidation in 110.00-112.00 may be seen for a couple of sessions.
Pound (1.2964) has risen along with the other majors but the inability to break above the resistance of 1.3000 yet makes it a relative underperformer. While above 1.3000, higher targets of 1.3200-1.3400 open up, expect more sideways consolidation in 1.2850-1.3000 till the breakout materializes.
Aussie (0.7454) is out of the contracting range of 0.7380-0.7450 and closing in to the major resistance of 0.7500 which may hold in the near term and push it down once again. Only a successful break above 0.7500 may negate the possibility of seeing the downside targets of 0.7300-0.7290 and bring bullish options on the table.
Dollar Rupee (64.15) is trading at 64.37 in the NDF as the weakness of Rupee against all the majors propels it higher. In the near to medium term, the range has been established in 64.00-70 which may see a few more oscillations in the coming days. For these last 2 sessions of the week, the upside may be limited to 64.45-55.
INTEREST RATES
The US yields have come off sharply as expected. While the Dollar Index remains below 98 and moves down to lower levels, the US yields also would head to lower levels in the coming sessions.
The US-Japan 10Yr (2.20%) yield spread has come down to test immediate support just below current levels and if that holds, we could see a bounce back within the next 2-3 sessions. This could possibly indicate that there could be less downside for Dollar-Yen just now. But we also need to keep a close watch on the Nikkei, which has come off from a strong resistance.
The UK-US 10Yr (-1.17%) has broken above the long term channel resistance and could move higher in the near term, taking up the Pound also towards 1.30 and higher. Near term looks bullish.
The German-US 10Yr (-1.86%) and the Euro are rising sharply. While there is some more room on the upside for the yield spread towards -1.75%, Euro could test levels near 112.50-113.0 in the near term.
The German yields have all fallen a bit and looks bearish in the near term. Failure to sustain above immediate resistances confirm stronger bears to dominate in the coming sessions.