
Sample Category Title
Trade Idea : USD/JPY – Buy at 112.70
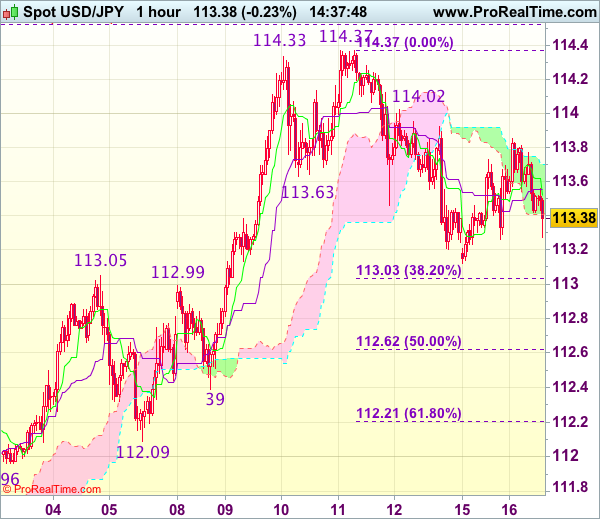
USD/JPY - 113.35
Most recent candlesticks pattern : N/A
Trend : Near term up
Tenkan-Sen level : 113.52
Kijun-Sen level : 113.56
Ichimoku cloud top : 113.70
Ichimoku cloud bottom : 113.41
Original strategy :
Buy at 112.70, Target: 113.80, Stop: 112.35
Position : -
Target : -
Stop : -
New strategy :
Buy at 112.70, Target: 113.80, Stop: 112.35
Position : -
Target : -
Stop : -
As the greenback met resistance at 113.85 and has retreated, retaining our view that further consolidation below last week’s high at 114.37 would be seen and pullback to 113.00-05 (38.2% Fibonacci retracement of 110.87-114.37 and previous resistance) cannot be ruled out, however, reckon 112.60-65 (50% Fibonacci retracement of 110.87-114.37) would limit downside and bring rebound later, above 113.85 would bring test of 114.00-05 but break of latter level is needed to signal the pullback from 114.37 has ended, bring retest of this level later.
In view of this, we are inclined to buy dollar on next decline but one should exit on such rebound as 114.37 resistance should cap upside. Below support at 112.39 would risk further weakness to 112.20-25 (61.8% Fibonacci retracement of 110.87-114.37) but still reckon previous support at 112.09 would hold from here.
ECB Started Accepting ‘Cash For Bonds’
Market movers today
Today, the Riksbank will present a proposal on target variables and possible intervals (09:30 CET). Overall, it seems likely that the Riskbank will change to target the CPIF but it seems more questionable whether it will int roduce a tolerance interval. Our assessment is that neither a change of target variable nor a new tolerance range will change the monetary policy pursued.
In Norway, GDP figures for Q1 are due out today. We estimate that mainland GDP climbed 0.5% q/q, which is above Norges Bank's project ion in the March monetary policy report (0.43%).
We estimate UK CPI inflation rose to 2.8% y/y in April from 2.3% y/y, which is higher than consensus. The fact that many UK gas and electricity companies have lifted their prices from April and the timing of Easter (April 2017, March 2016) make it more difficult to estimate inflation in April.
In Europe, relief over the French presidential election pro-EU outcome is likely to drive ZEW expectat ions upward further (supported by rising Sent ix expectat ions in May).
In the US, industrial production figures for April are due.
Selected market news
Further controversy was added to Donald T rump's short tenure at the White House with the President reportedly revealing intelligence secrets at the meeting with Russian Foreign Minister Sergey Lavrov last week. A White House official has dismissed the story as untrue, but the episode has added to the general uneasy atmosphere around the presidency among both Democrats and Republicans.
Yesterday the ECB released the first data regarding the utilisation of their altered securities lending facility. Since the ECB started accepting 'cash for bonds' (implemented mid- December 2016) the market has been looking for clues to the effectiveness and extent of the facility. The figures disclosed a 'cash for collat eral' utilisation of EUR18.1bn, which is well below the limit of EUR50bn. With this release the ECB has shown that the current securities lending facility is fully operational and has plenty spare capacity, reducing the urgency of the ECB to alter the facility a further.
Saudi Arabia and Russia's willingness to extend the supply-cut deal into March 2018 helped a further rebound in the oil price with Brent Crude trading briefly above USD52.5 per barrel but settling near the USD52 per barrel mark. However, large producers Iran and Iraq have been talking about expanding their production capacity in coming years, which does not bode well for a long-term extension of the supply cuts and could add downward pressure on the oil price.
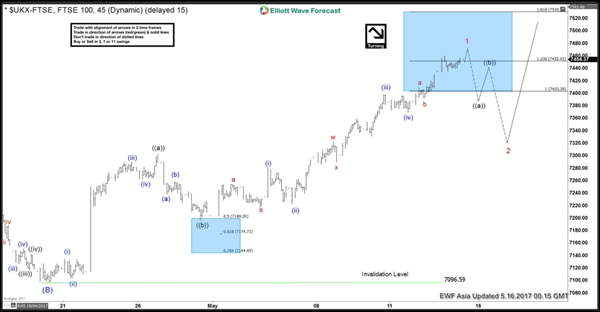
Elliott Wave View: FTSE Mature Cycle
Short Term Elliott Wave view in FTSE suggests the rally from 4/20 low (7096.6) is unfolding as a zigzag Elliott Wave structure where Minute wave ((a)) ended at 7302.57 and Minute wave ((b)) ended at 7197.28. Subdivision of Minute wave ((a)) is unfolding as an impulse where Minuttte wave (i) ended at 7134.53, Minutte wave (ii) ended at 7104.22, Minutte wave (iii) ended at 7290.82, Minutte wave (iv) ended at 7262.32, and Minutte wave (v) of ((a)) ended at 7302.57. Index has since broken above 7302.57 suggesting Minutte wave ((c)) has started.
Minute wave ((c)) is currently in progress as an ending diagonal where Minutte wave (i) ended at 7280.7, Minutte wave (ii) ended at 7222.81, Minutte wave (iii) ended at 7398.58, and Minutte wave (iv) ended at 7369.23. Index has reached 1.236 extension of the Minute ((a)) – ((b)) and thus minimum requirement has been met for Minor wave 1 to complete and cycle from 4/20 low to end, although a marginal high still can't be ruled out at this stage. Expect Index to correct cycle from 4/20 low soon within Minor wave 2 in 3, 7, or 11 swing before the rally resumes. We don't like selling the proposed pullback and expect buyers to appear again when Minor wave 2 pullback is over in 3, 7, or 11 swing.
FTSE 1 Hour Elliott Wave Chart
Market Update – Asian Session: RBA Minutes Concerned With Rising Unemployment
Asia Mid-Session Market Update: RBA minutes concerned with rising unemployment and overheating housing market; Risk sentiment briefly dented by reports of Trump intelligence gaffe with Russian diplomats
US Session Highlights
(US) MAY EMPIRE MANUFACTURING: -1.0 V +7.3E; new orders -4.4 v +7 m/m
(US) MAY NAHB HOUSING MARKET INDEX: 70 V 68E (second-highest reading since financial downturn)
Stocks opened the week upbeat on higher commodity and oil prices, with the S&P touching a new all-time high, before closing lower, but up on the day. Indices were led by mining and energy stocks. The two outperforming sectors of the S&P were Energy and Materials, gaining 0.8% and 0.9% respectively.
US markets on close: Dow +0.4%, S&P500 +0.5%, Nasdaq +0.5%
Best Sector in S&P500: Materials
Worst Sector in S&P500: Telecom
Biggest gainers: FTR +6.6%; QRVO +5.5%; NVDA +5.0%
Biggest losers: SWN -4.3%; URBN -3.1%; VIAB -2.5%
At the close: VIX 10.4 (flat); Treasuries: 2-yr 1.30% (flat), 10-yr 2.34% (flat), 30-yr 3.01% (+1bps)
US movers afterhours
AKBA Akebia and Vifor Pharma announce license agreement to provide Vadadustat to Fresenius Medical Care in the U.S. Upon FDA Approval; Vifor makes $50M investment in AKBA at $14/shr ; +16.2% afterhours
VOXX Reports Q4 $0.00 v $0.06e, R$167.4M v $167.7M y/y -9.8% afterhours
TEAR Reports Q1 -$0.82 v -$0.75e, R$6.7M v $7.0Me; -15.0% afterhours
Key economic data
(AU) AUSTRALIA APR NEW MOTOR VEHICLE SALES M/M: 0.3% V 1.9% PRIOR; Y/Y: 0.1% V -3.0% PRIOR
Asia Session Notable Observations, Speakers and Press
Asian equities mixed despite the more pronounced gains on Wall St as political risk in the shape of a Trump intelligence gaffe during his meeting with Russian diplomats last week sparked calls for Congressional inquiry. JPY traded slightly firmer and US equity futures slightly softer in early Asian hours. Australia miners and AUD faring better as precipitous decline in iron ore appears to have abated in spite of more disappointing economic data out of China this weekend. Economic calendar and FX volatility otherwise compressed. RBA policy meeting minutes produced a very minor upside ripple, reiterating concern over inflation but also inserting property price sensitivity and risk into its analysis.
Politics
(RU) Pres Trump reportedly revealed highly classified intelligence information on ISIS threat to Russian Foreign Min last week that intelligence agency partners had not given permission to share - press
China
(CN) China MoF 5-yr bond suspended from trading after abnormal fluctuations
(CN) Fitch: China economy to remain stable this year - press
Australia/New Zealand
(AU) Reserve Bank of Australia (RBA) May 2nd Meeting Minutes:
Maintaining the current accommodative stance of monetary policy would be consistent with achieving sustainable growth and the inflation target over time
Developments in the labor and housing markets warrant careful monitoring. Recently announced supervisory measures designed to help mitigate household credit risks, and recent mortgage rate increases, will take some time to fully assess their impact.
(AU) Australia Trade Min Ciobo: FTA talks with Hong Kong may boost service exports
Q1 inflation data had generally increased confidence that underlying inflation would pick up to around 2% by early 2018.
Asian Equity Indices/Futures (00:00ET)
Nikkei +0.2%, Hang Seng -0.3%, Shanghai Composite -0.3%, ASX200 +0.1%, Kospi +0.1%
Equity Futures: S&P500 -0.1%; Nasdaq flat, Dax -0.1%, FTSE100 -0.2%
FX ranges/Commodities/Fixed Income (00:00ET)
EUR 1.0975-1.0990 JPY 113.40-113.80; AUD 0.7405-0.7430; NZD 0.6875-0.6905
June Gold +0.4% at 1,234/oz; June Crude Oil +0.4% at $49.06/brl; July Copper -0.4% at $2.53/lb
(US) EIA forecasts June total shale regions oil production at 5.40M bpd, +122K bbd m/m (vs +109K bpd rise in May)
iShares Silver Trust ETF daily holdings rise to 10,605 tonnes from 10,532 tonnes prior (2nd straight increase)
(CN) PBOC to inject combined CNY190B v CNY80B prior in 7-day and 14-day reverse repos
(CN) PBOC SETS YUAN MID POINT AT 6.8790 V 6.8852 PRIOR (4th consecutive firmer setting, strongest Yuan fix since Apr 24th)
(JP) Japan MoF sells ¥1.99T in 0.1% 5-year JGB bonds; avg yield -0.117% v -0.160% prior; bid-to-cover 3.59x v 3.28x prior
Asia equities notable movers
Australia
Fortescue (FMG) +2.5%, Rio Tinto 0.8%; Iron ore rebounds
BHP +0.4%; Elliott Mgt makes new case for review of petroleum business
Japan
Sharp (6502.JP) -7.6%; Sharp may acquire 10-20% of Toshiba's memory unit in a joint bid with Hon Hai - Nikkei
Mizuho (8411.JP) -1.8%; Reports FY17/17
Hong Kong
China Shenhua Energy (1088) +1.1%; Apr coal output
Phoenix TV (2008) -1.6%; Q1 result
Paradise Ent (1180) -2.4%; Q1 result
Cathay Pacific (293) -3.0%; Removed from MSCI HK
Policymakers Concerned About Overheated Housing Market: RBA Minutes
For the 24 hours to 23:00 GMT, the AUD rose 0.26% against the USD and closed at 0.7419.
LME Copper prices rose 1.2% or $66.0/MT to $5586.0/MT. Aluminium prices rose 1.0% or $19.5/MT to $1899.5/MT.
In the Asian session, at GMT0300, the pair is trading at 0.7408, with the AUD trading 0.15% lower against the USD from yesterday’s close.
According to minutes of the Reserve Bank of Australia’s (RBA) recent meeting, policy makers noted that both the labour and housing markets in Australia warranted 'careful monitoring.' Also, policymakers reiterated views that interest rates will stay at record low for the foreseeable future.
The pair is expected to find support at 0.7379, and a fall through could take it to the next support level of 0.7351. The pair is expected to find its first resistance at 0.7441, and a rise through could take it to the next resistance level of 0.7475.
The currency pair is showing convergence with its 20 Hr moving average and trading above its 50 Hr moving average.

Euro Trading Higher, Ahead Of The ZEW Survey Data Across The Euro-Zone
For the 24 hours to 23:00 GMT, the EUR rose 0.49% against the USD and closed at 1.0979.
On the data front, Italy's final consumer price index rose 1.9% on an annual basis in April, compared to a gain of 1.8% recorded in the preliminary print. In the prior month, the CPI had recorded a rise of 1.4%.
In the US, data indicated that the housing market index unexpectedly advanced to a level of 70.0 in May, pointing towards strengthening housing market. compared to market expectations for the index to remain steady at 68.0. On the contrary, the nation's New York Empire State manufacturing index surprisingly fell to a seven-month low level of -1.0 in May, defying investor consensus for an advance to a level of 7.5. In the previous month, the index had registered a reading of 5.2.
In the Asian session, at GMT0300, the pair is trading at 1.0988, with the EUR trading 0.08% higher against the USD from yesterday's close.
The pair is expected to find support at 1.0945, and a fall through could take it to the next support level of 1.0902. The pair is expected to find its first resistance at 1.1010, and a rise through could take it to the next resistance level of 1.1032.
Moving ahead, market participants await the release of ZEW survey of economic sentiment for May, across the Euro-zone along with the Euro-zone's flash 1Q GDP numbers and trade balance figures for March, slated to release in a few hours. Moreover, the US housing starts, building permits, industrial as well as manufacturing production, all for April, scheduled to release later in the day, will pique significant amount of investor attention.
The currency pair is trading above its 20 Hr and 50 Hr moving averages.

Pound Trading On A Stronger Footing, Ahead Of UK’s Crucial Inflation Data
For the 24 hours to 23:00 GMT, the GBP rose 0.09% against the USD and closed at 1.2898.
In the Asian session, at GMT0300, the pair is trading at 1.2908, with the GBP trading 0.08% higher against the USD from yesterday's close.
The pair is expected to find support at 1.2877, and a fall through could take it to the next support level of 1.2845. The pair is expected to find its first resistance at 1.2940, and a rise through could take it to the next resistance level of 1.2971.
Trading trend in the Pound today is expected to be determined by the release of Britain's consumer price index data for April, slated in a few hours.
The currency pair is showing convergence with its 20 Hr moving average and trading above its 50 Hr moving average.

Japanese Yen Trading Higher In The Asian Session
For the 24 hours to 23:00 GMT, the USD rose 0.25% against the JPY and closed at 113.63.
On the data front, Japan's preliminary machine tool orders climbed 34.7% on an annual basis in April, after recording a rise of 22.8% in the prior month.
In the Asian session, at GMT0300, the pair is trading at 113.42, with the USD trading 0.18% lower against the JPY from yesterday's close.
Earlier in the session, the nation's tertiary industry index surprisingly dropped 0.2% on a monthly basis in March, compared to a gain of 0.2% in the preceding month, while markets expected for a gain of 0.1%.
The pair is expected to find support at 113.15, and a fall through could take it to the next support level of 112.88. The pair is expected to find its first resistance at 113.77, and a rise through could take it to the next resistance level of 114.12.
Going ahead, traders would focus on Japan's industrial production for March, slated to release tomorrow.
The currency pair is showing convergence with its 20 Hr and 50 Hr moving averages

Swiss Franc Trading A Tad Higher This Morning
For the 24 hours to 23:00 GMT, the USD declined 0.56% against the CHF and closed at 0.9958.
On the economic front, Switzerland’s producer and import prices unexpectedly dropped 0.2% on a monthly basis in April, compared to market expectations for a flat reading. The index had climbed 0.1% in the prior month.
In the Asian session, at GMT0300, the pair is trading at 0.9953, with the USD trading slightly lower against the CHF from yesterday’s close.
The pair is expected to find support at 0.9930, and a fall through could take it to the next support level of 0.9907. The pair is expected to find its first resistance at 0.9997, and a rise through could take it to the next resistance level of 1.0041.
With no economic releases in Switzerland today, investor sentiment would be governed by global macroeconomic news.
The currency pair is trading below its 20 Hr and 50 Hr moving averages.

Canada’s Existing Home Sales Eased In April
For the 24 hours to 23:00 GMT, the USD declined 0.55% against the CAD and closed at 1.3629.
Macroeconomic data showed that Canada's existing home sales slid 1.7% on a monthly basis in April, following a rise of 1.1% in the previous month.
In the Asian session, at GMT0300, the pair is trading at 1.3634, with the USD trading a tad higher against the CAD from yesterday's close.
The pair is expected to find support at 1.3585, and a fall through could take it to the next support level of 1.3536. The pair is expected to find its first resistance at 1.3696, and a rise through could take it to the next resistance level of 1.3758.
The currency pair is showing convergence with its 20 Hr moving average and trading below its 50 Hr moving averages.
