Sample Category Title
Gold Steady Against Dollar, Markets Await Construction Reports
Gold has ticked higher in the Monday session. Currently, spot gold is trading at $1229.85 in the North American session. On the release front, the Empire State Manufacturing Index disappointed with a reading of -1.0, short of the forecast of 7.2 points. On Tuesday, construction numbers will be in focus, with the release of Building Permits and Housing Starts.
US numbers ended on the week on a mixed note. US consumer spending and inflation numbers fell short of estimates. CPI came in at 0.2%, short of the estimate of 0.3%. Core CPI, which excludes the most volatile items, posted a small gain of 0.1%, shy of the estimate of 0.2%. Retail Sales came in at 0.3%, compared to the forecast of 0.5%. Retail Sales rose 0.4%, short of the estimate of 0.6%. There was better news from consumer confidence, as the strong reading of 97.7 beat the forecast of 97.0 points. These numbers underscored a troubling trend where strong consumer confidence has failed to translate into increased consumer spending.
Donald Trump's firing of FBI director James Comey has stunned lawmakers and set off a political firestorm in Washington. Trump has been accused of triggering a constitutional crisis and undermining the rule of law. Comey had been conducting an investigation into possible collusion between Trump and Russia during the presidential campaign, so predictably, Comey's dismissal has raised suspicions that Trump is trying to impede the investigation by firing Comey. The crisis could heat up further, with calls in Congress to appoint an independent investigator into Trump's connections with Russia. This latest political storm has yet to shake up the markets, but a prolonged crisis could paralyze Washington and delay Trump's agenda of tax reform and increased fiscal spending.
Sterling Edges Higher, Markets Eye UK CPI
GBP/USD has posted slight gains in the North American session. In North American trade, GBP/USD is trading slightly above the 1.29 level. On the release front, there are no British economic events. Prime Minister Theresa May will take part in a Facebook Q&A session. In the US, the Empire State Manufacturing Index disappointed with a reading of -1.0, short of the forecast of 7.2 points. On Tuesday, the UK will release CPI and other inflation indicators. Over in the US, construction numbers will be in focus, with the release of Building Permits and Housing Starts.
All eyes are on British inflation indicators, which will be released on Tuesday. CPI, the primary gauge of consumer inflation, continues to move upwards, and the markets are expecting a strong gain of 2.6% in the April report. Last week, the BoE minutes indicated that if inflation is higher than predicted, it might have to respond by raising interest rates. The BoE stated in its minutes that it expected living standards to drop, as it downgraded its forecast for average earning growth to 2%, down from 3% in February. On the inflation front, the BoE raised its projection for inflation in Q1 to 2.7%, compared to 2.4% in February. According to the central bank, these forecasts were based on a "smooth" Brexit (which is by no means guaranteed, especially with the bad blood between the EU and Prime Minister Theresa May).
US numbers ended on the week on a mixed note. US consumer spending and inflation numbers fell short of estimates. CPI came in at 0.2%, short of the estimate of 0.3%. Core CPI, which excludes the most volatile items, posted a small gain of 0.1%, shy of the estimate of 0.2%. Retail Sales came in at 0.3%, compared to the forecast of 0.5%. Retail Sales rose 0.4%, short of the estimate of 0.6%. There was better news from consumer confidence, as the strong reading of 97.7 beat the forecast of 97.0 points. These numbers underscored a troubling trend where strong consumer confidence has failed to translate into increased consumer spending.
Donald Trump's firing of FBI director James Comey could have been viewed as yet another controversial move by the temperamental president, but the firing has set off a political firestorm in Washington. Trump has been accused of triggering a constitutional crisis and undermining the rule of law. Comey had been conducting an investigation into possible collusion between Trump and Russia during the presidential campaign, so predictably, Comey's dismissal has raised suspicions that Trump is trying to impede the investigation by firing Comey. The crisis could heat up further, with calls in Congress to appoint an independent investigator into Trump's connections with Russia. This latest political storm has yet to shake up the markets, but a prolonged crisis could paralyze Washington and delay Trump's agenda of tax reform and increased fiscal spending.
European Elections Dominate Euro Performance
- Sterling strengthens again after Bank of England statement
- European elections dominate Euro performance
- Disappointing data and rising oil prices weaken the US Dollar
- Chinese Inflation fails to fell commodity currencies
Pound picks up despite mixed signals
Despite the negativity coming from the Bank of England's UK growth downgrade and the release of lukewarm manufacturing and industrial sector data, the Pound has picked up, following an initial fall. We are expecting Retail Inflation, Employment and Retail Sales data this week, with a mixed bag of forecasts, so there is more volatility in store for Sterling throughout the week. Keep a close eye on the Pound's performance against its key currency partners over the coming days.
Elections dominate European focus
Election activity is the key focus for Europe and the Euro right now, with the spotlight on Germany. The success of Angela Merkel's party in North Rhine-Westphalia could be positive for the Euro, as the chance that Merkel will retain her chancellorship could give the Euro and the Eurozone a little confidence boost. Otherwise, there is little data expected this week, except the latest Eurozone Gross Domestic Product (GDP) figures and European Central Bank (ECB) Minutes.
USD-Euro one to watch...
Rising oil prices have taken their toll on the US Dollar, following further oil production restrictions. However, a member of the Federal Reserve hinted that there would be another two interest rate increases in 2017, which served to balance the USD's fortunes.
There is not a huge amount of data to come out of the US this week, other than Housing and Industrial Production results. The EUR-USD rate will be one to watch over the coming days and weeks.
China and the commodity currencies
The Australian and New Zealand Dollars were largely unaffected by muted Chinese Inflation data, but there will be a number of Australian and New Zealand data releases this week, which may have an impact.
Canadian Dollar could weaken if forecasts correct
Towards the end of this week, we will get the Canadian Retail and Inflation figures, predicted to be poor, and this could have a negative effect on the Canadian Dollar. If you are selling or planning to sell Canadian Dollars, it would be a good time to assess your risk and look to protect your rate by trading before the data is released or making use of a Stop Loss Order or Forward Contract. Speak to your currency consultant for further guidance.
Elliott Wave Analysis: EURUSD Intraday View
EURUSD is rising sharply, too fast to label this recovery as corrective, therefore I adjusted the look and are tracking now an impulsive recovery; a five wave move that is in progress so expect more upside after a pullback into wave four. Short-term resistance is near 1.1000.
EURUSD, 1H
Yen Shrugs off Strong Japanese Inflation, Mfg. Reports
USD/JPY has edged higher in the Monday session. In North American trade, the pair is trading at 113.60. On the release front, Japanese PPI posted a gain of 2.1%, above the estimate of 1.8%. Preliminary Machine Tool Orders posted a strong gain of 34.7%. In the US, the Empire State Manufacturing Index disappointed with a reading of -1.0, short of the forecast of 7.2 points. On Tuesday, construction numbers will be in focus, with the release of Building Permits and Housing Starts.
Japan started the week with solid data, but the yen failed to respond. On the inflation front, PPI has rebounded in remarkable fashion, showing improvement in 10 straight releases. The index jumped to 2.1% in April, above the forecast of 1.8%. Is inflation on the move? We won't get a look at Tokyo Core CPI and other inflation indicators until next week, but stronger numbers would put pressure on the BoJ to reconsider its ultra-loose monetary policy, which has yet to produce sustained growth or higher inflation, as was advertised by the government and the BoJ. There was more positive news from the manufacturing sector, as orders for machine tools jumped 34.7% in April, on a year-on year basis.
The yen recorded gains on Friday, as US consumer spending and inflation numbers fell short of estimates. CPI came in at 0.2%, short of the estimate of 0.3%. Core CPI, which excludes the most volatile items, posted a small gain of 0.1, shy of the estimate of 0.2%. Retail Sales came in at 0.3%, compared to the forecast of 0.5%. Retail Sales rose 0.4%, short of the estimate of 0.6%. Consumer confidence remained strong, as the reading of 97.7 beat the forecast of 97.0 points. These numbers underscored a troubling trend where strong consumer confidence has failed to translate into increased consumer spending.
Donald Trump's firing of FBI director James Comey could have been viewed as yet another controversial move by the temperamental president, but the firing has set off a political firestorm in Washington. Trump has been accused of triggering a constitutional crisis and undermining the rule of law. Comey had been conducting an investigation into possible collusion between Trump and Russia during the presidential campaign, so predictably, Comey's dismissal has raised suspicions that Trump is trying to impede the investigation by firing Comey. The crisis could heat up further, with calls in Congress to appoint an independent investigator into Trump's connections with Russia. This latest political storm has yet to shake up the markets, but a prolonged crisis could paralyze Washington and delay Trump's agenda of tax reform and increased fiscal spending.
Homebuilders Report Rising Demand for New Homes in May
The National Association of Home Builders/Wells Fargo Housing Market Index rose 2 points in May to 70, hitting its second highest level of the cycle. Demand is particularly strong in the West and South.
All Systems Go for Homebuilding?
With weather distortions now comfortably behind us, the strength we are seeing in home buying reflects a real fundamental improvement in housing demand. The present sales index rose 2 points to 76, while the future sales index jumped 4 points to 79, reaching its highest level June 2005.
Demand for single-family homes is being driven by stronger job growth and a rising supply of millennial buyers.
Demand Is Strongest in the West and South
Demand is strongest in the West and South, where population and employment growth have risen the fastest. Some of the improvement is likely coming from energy-producing areas, where job growth has ramped back up again.
Supply constraints remain a hurdle for builders. Shortages of lots and workers have kept starts below levels seen the last time the NAHB index was as high as it is today.
Elliott Wave Trade Ideas Performance Update
We sold cable last week at 1.2955 and sterling did falter below resistance at 1.2991 and retreated, we then lowered our stop to 1.2910, however, the British pound found good support at 1.2844 and has rebounded, our lowered stop at 1.2910 were tripped with 45 points profit.
A short position was also entered in EUR/JPY, however, the single currency found good support at 123.31 and has risen again today, the position was stopped at 124.55 and the pair resumed recent upmove.
No position was entered among other currency pairs.
In short, 2 positions were entered last week with total loss of 10 points and the positions are listed below.
9 May : EUR/JPY - Short at 124.00, exited at 124.55 ( - 55 points )
10 May : GBP/USD - Short at 1.2955, exited at 1.2910 (+ 45 points)
| AUD EUR/JPY EUR/GBP CAD GBP GBPJPY
Jan - 15 -275 - 35 -120
Feb + 140 -17 - 40 +11
Mar - 20 +115 +132 - 19
Apr + 30 - 40 +120 + 45
May - 55 +45
Jun
Jul
Aug
Sep
Oct
Nov
Dec
Y-T-D + 135 - 232 + 17 + 158 +45 + 45
Currencies: Euro Rally Continues
Headlines
The German Dax reached a new all-time high around the European market opening, but couldn't cling on to gains. Other European indices also trade slightly lower. US stock markets opened around 0.3% higher.
The Empire Manufacturing business sentiment unexpectedly declined from 5.2 to -1 in May while markets expected a pick-up to 7.5. The index is now at the lowest level since October 2016.
ECB chief economist Praet said that "growth still needs a high degree of accommodation." The ECB will reassess its risk assessment in June. Currently risks are more balanced, but still tilted to the downside. Praet expects the output gap to be closed sometime in 2019. Inflation pressures remain subdued at this stage.
Emmanuel Macron has appointed centre-right politician Édouard Philippe as his prime minister. Mr Philippe, the 46-year old mayor of Le Havre, is a Republican party MP close to Alain Juppé, the former prime minister who lost the Republican party's presidential nomination to François Fillon in primary elections last year.
Germany should use its rising tax revenues to invest in infrastructure projects that will enhance its growth potential, and encourage employers to raise wages to help lift euro zone inflation, the IMF said. The IMF recommendations run counter to the thinking of German FM Schaeuble.
Vladimir Putin has blamed US intelligence services for the WannaCry infection that has swept across the world, as the spread of the cyber-attack appeared to stall in Europe.
Rates
France announces new 30-yr syndicated benchmark
Global core bonds lost modest ground in dull session. Traded volumes were low, even for a Monday. Brent crude gained around $2/barrel as Saudi Arabia and Russia push to extend oil output cuts until March 2018. The higher oil price weighed slightly on core bonds. ECB chief economist Praet repeated that the EMU still needs a high degree of stimulus and that inflation is subdued. Economic growth is increasingly solid, broad-based, but the strong sentiment needs to be reflected in hard data. His comments failed to impact trading. The US empire manufacturing index unexpectedly turned negative for the first time since October last year, but received the same underwhelming receipt.
At the time of writing, the German yield curve bear steepens with yield changes ranging between 0.6 bp (2-yr) and +4.7 bps (30-yr). The underperformance of the very long end of the yield curve is supply-related. The French debt agency announced the launch of a syndicated 31-yr benchmark (May2048) in the near term. The US yield curve shifted in similar fashion with yields 0.8 bps (2-yr) to 2.3 bps (30-yr) higher. On intra-EMU bond markets, 10-yr yield spread changes versus Germany range between -2 bps and +1 bp.
Currencies
Euro rally continues
The euro remained well bid in today's very thin technical and sentiment driven session. A second tier weak US Empire Manufacturing index gave the pair some extra, albeit temporary, fuel, but it was mainly follow through buying after Friday's weak US data. Interest rate differentials were little changed at the short end, but narrowed at the longer end after the announcement of a fresh French long bond. Geopolitical tensions after the North Korean missile test and some ongoing ECB QE tapering speculation were often cited on news wires, but we think they had little to do with the euro strength.
EUR/USD started the European session on a positive footing and very gradually moved higher during the European morning session. The US NY Fed manufacturing survey disappointed as it dropped just into negative territory. EUR/USD added a few ticks and reached the 1.0980 level, up from 1.0933 at the opening. The pair seems to hesitate now that it nears the 1.10 handle and the 1.1023 recent high
USD/JPY goes nowhere
Following two down-days, USD/JPY tried to move higher at the start of the European session, but it never came further than 113.73 from 113.40. Later on, disappointment kicked in and dollar selling pushed the pair back to the 113.40, slightly helped by the weak US NY manufacturing survey. European equities lost too little ground to speak about risk aversion and safe haven flows into the yen.
EUR/GBP tests 0.85 level
EUR/GBP trading was sentiment-driven. Sterling tried to regain part of Friday's losses in Asian and early European trading, but the EUR/GBP decline stalled at 0.8458. After bottoming out, the pair followed EUR/USD higher and reached the 0.85 handle, testing first resistance (0.8509/31) which if broken would form a triple bottom on the charts. Cable went slightly higher to 1.2940 from just below 1.29 at the open, but lost again some ground and is now quoted around 1.2918. EUR/USD outperformed EUR/GBP.
Candlesticks and Ichimoku Trade Ideas Performance Update
After seeing the sharp retreat from 1.2988 last week, we took the view that a temporary top has possibly been formed, so a short position was entered at 1.2900 and although the pair did fall to 1.2844, renewed buying interest emerged there and has rebounded, the position was stopped at 1.2935.
No position was entered among other currency pairs.
In short, only 1 position was entered among all 4 currency pairs with total loss of 35 points and the position is listed below:
12 May : GBP/USD - Short at 1.2900, exited at 1.2935 (- 35 points)
| JPY EUR CHF GBP
Jan + 167 - 85 - 10 + 50
Feb + 200 +150 +93 - 59
Mar -23 -70 -23 - 35
Apr + 65 + 93 + 50 - 40
May + 5 - 35
Jun
Jul
Aug
Sep
Oct
Nov
Dec
Y-T-D + 413 + 83 +110 -119
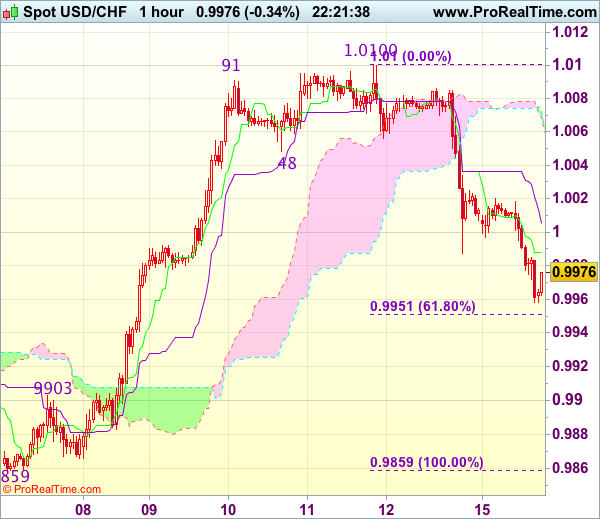
Trade Idea Wrap-up: USD/CHF – Sell at 1.0035
USD/CHF - 0.9970
Most recent candlesticks pattern : N/A
Trend : Near term down
Tenkan-Sen level : 0.9988
Kijun-Sen level : 1.0005
Ichimoku cloud top : 1.0072
Ichimoku cloud bottom : 1.0069
Original strategy :
Sell at 1.0035, Target: 0.9935, Stop: 1.0070
Position : -
Target : -
Stop : -
New strategy :
Sell at 1.0035, Target: 0.9935, Stop: 1.0070
Position : -
Target : -
Stop : -
As the greenback has fallen again after brief recovery, suggesting the fall from 1.0100 top is still in progress and further weakness to 0.9950-55 (61.8% Fibonacci retracement of 0.9859-1.0100) would be seen, break there would add credence to this view, bring subsequent fall to 0.9930-35 but price should stay well above previous resistance at 0.9903, bring rebound later.
In view of this, would be prudent to sell dollar on recovery as 1.0035-40 should limit upside. Above previous support at 1.0056 would defer and risk a stronger rebound to 1.0080 but price should falter below resistance at 1.0100-08, bring retreat later.