Sample Category Title
NY Manufacturing Activity Declines, US Dollar Stays Subdued
The latest monthly manufacturing activity report released by the New York Fed yesterday showed that the Empire State Manufacturing index slipped into negative territory, posting a reading of -1.0. The data missed expectations of 7.2 and indicated a third consecutive month of decline after data rose to a two-year high at 18.7 in February.
Both new orders and shipments fell while the labor market indicators pointed to only a modest increase during the month of May. The US dollar index fell through the day which saw the EURUSD maintain the bullish momentum from last Friday. The ICE futures, US dollar index fell 0.3% to close at 98.91.
Looking ahead, the economic calendar today will see the inflation figures from France and Italy while the UK will be releasing the monthly inflation figures which suggest that consumer prices might have accelerated at a pace of 2.6% in April. The inflation data will be followed by flash GDP numbers from the eurozone.
From the US building, permits and industrial production numbers will keep the markets busy later in the afternoon.
EURUSD intraday analysis
EURUSD (1.0986): EURUSD maintained its bullish gains yesterday with theprice now within reach of testing the 1.1000 resistance level. However, the current gains are still seen as a retracement unless we see a strong breakout above 1.1000 region. This will potentially set the stage for further gains to the upside. However, in the event of a reversal near 1.1000 resistance level, we could expect EURUSD to slip back towards the support that was established at 1.0863 - 1.0854 level. A break down below this region will then confirm a move towards 1.0750 - 1.0740 region.
USDJPY intraday analysis
USDJPY (113.51): The USDJPY managed to maintain some bullish momentum yesterday, but the daily chart shows a hidden bearish divergence that has formed. This indicates that USDJPY could be looking to slide towards 112.50 in the near term where support could be established ahead of a renewed bullish momentum. On the 4-hour chart, resistance is seen holding up at 114.00 - 113.78 region which was tested once again yesterday. Thiscould possibly signal a move towards the support level at 112.50.
XAUUSD intraday analysis
XAUUSD (1233.44): Gold prices attempted to push higher yesterday, but price managed to rise to a 7-day high at 1237.26 before pushing back lower. The failure to post any pullback towards 1221.47 regionis, however, indicative that the rally cannot be sustained further unless gold prices break out higher above 1235.00 and establish support at one of the higher levels. Resistance is seen coming in at 1250.00 which remains the upside target, while to the downside, the declines could be limited towards 1221.47 - 1221.00 region.
GBP/USD Candlesticks and Ichimoku Analysis
Weekly
• Last Candlesticks pattern: Long white candlestick
• Time of formation: 16 Jan 2017
• Trend bias: Down
Daily
• Last Candlesticks pattern: Long white candlestick
• Time of formation: 18 Apr 2017
• Trend bias: Near term up
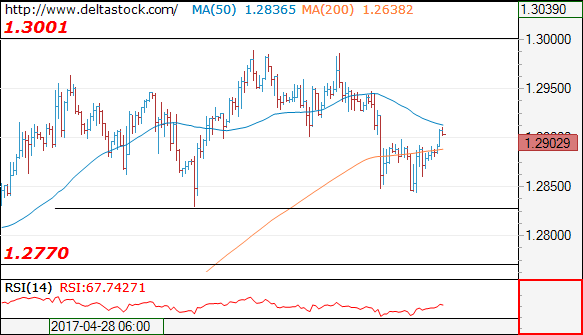
GBP/USD – 1.2928
Cable’s firmness after recent rally adds credence to our view that the rise from 1.1986 low (Jan low) is still in progress and bullishness remains for this move to bring retracement of early downtrend, hence further gain to 1.3000 psychological resistance, then 1.3050-60 would be seen, however, loss of near term upward momentum should prevent sharp move beyond 1.3090-00 and reckon 1.3140-50 (38.2% Fibonacci retracement of 1.5018-1.1986) would hold on first testing, risk from there is seen for a retreat to take place later.
On the downside, whilst initial pullback to 1..2850-60 is likely, reckon downside would be limited to 1.2800-10 support at 1.2757 should hold, bring another rise later. Only a daily close below support at 1.2757 would suggest top is possibly formed, bring weakness to 1.2700-10 but a sustained breach below the Kijun-Sen (now at 1.2697) is needed to add credence to this view, bring correction to previous resistance at 1.2616, however, downside should be limited to 1.2575 and price should stay well above 1.2500, bring another rally later.
Recommendation: Buy at 1.2770 for 1.3010 with stop below 1.2670.
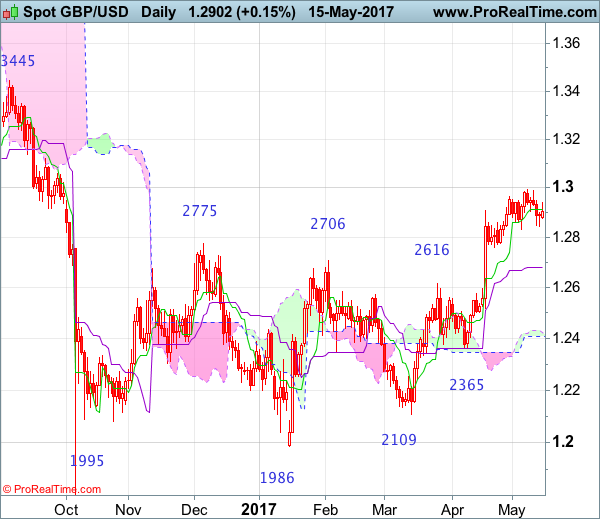
On the weekly chart, although cable has eased after faltering below psychological level at 1.3000 and initial consolidation would be seen, reckon downside would be limited to 1.2840-50 and 1.2757 support should hold, our bullish view remains for the erratic rise from this year’s low at 1.1986 to bring retracement of early decline, hence further gain to psychological resistance at 1.3000 and possibly towards 1.3090-00 would be seen, however, reckon upside would be limited to 1.3140-50 (38.2% Fibonacci retracement of 1.5018-1.1986) and price should falter well below 1.3200-10, bring retreat later.
On the downside, although initial pullback to 1.2840-50 cannot be ruled out, reckon downside would be limited to 1.2770 and bring another rise. Below previous resistance at 1.2706 would defer and suggest top is possibly formed, risk weakness to 1.2640-50, however, only a drop below another previous resistance at 1.2616 would add credence to this view, bring further fall to 1.2550-60 but reckon support at 1.2515 would hold, bring another rise later. Only a drop below 1.2500 would abort and signal top is formed instead, then test of the Kijun-Sen (now at 1.2489) would follow but support at 1.2365 should remain intact.

Currencies: EUR/USD Again Nearing The 1.10 Barrier
Sunrise Market Commentary
- Rates: Waiting game continues
Today's eco calendar contains several eco data, but we don't think they will impact trading. We expect sideways action and don't think that Trump's latest scandal will have a lasting impact on risk sentiment. If oil prices extend their rally, they could inflict some losses on core bonds. Speeches by ECB governors are wildcards in the run-up to the June policy meeting. - Currencies: EUR/USD again nearing the 1.10 barrier
The euro profited most yesterday from recent disappointing US data. EUR/USD is again nearing the recent highs. Today's US eco data might be constructive, but it's not sure they will be strong enough to change fortunes in favour of the dollar. EUR/GBP is also near a first technical resistance at 0.8509/31. Today's UK CPI data might decide on a break.
The Sunrise Headlines
- Wall Street began the week on the front foot as a rally in oil prices propelled energy stocks higher. Both the S&P 500 and Nasdaq set new intraday and closing highs after gaining 0.5%. Overnight, Asian stock markets trade mixed.
- US President Trump shared sensitive intelligence obtained from a close US ally with Russia's foreign minister and ambassador, according to US officials, jeopardizing critical intelligence-sharing agreements in the fight against IS.
- Angela Merkel and Emmanuel Macron promised to work together to deepen EU integration and reinforce the eurozone as the new French president visited the German chancellor in Berlin the day after his inauguration.
- Australia's central bank was confident core inflation would pick up by early 2018, but worries about a subdued labour market amid soaring household debt forced it to stand pat on rates, Minutes of the May meeting showed.
- Dutch coalition talks between Liberals, Christian Democrats, D66 and the Greens to form a new government collapsed over disagreements on how to tackle immigration, Edith Schippers, who led the negotiations, said.
- The Czech crown firmed to its strongest level against the euro, below EUR/CZK 26.50, since the central bank scrapped an intervention regime keeping it weak EUR/CZK > 27.00) on April 6.
- Today's eco calendar is busy with UK CPI, German ZEW, the second reading of EMU Q1 GDP, US housing starts, building permits and industrial production. ECB Nowotny and Coeuré are scheduled to speak.
Currencies: EUR/USD Again Nearing The 1.10 Barrier
EUR/USD returns to 1.10 area
On Monday, the euro remained well bid in a technically driven session. The dollar suffered further follow-through selling after Friday's weak US data. A weak US manufacturing index gave EUR/USD some additional fuel. Ongoing speculation on ECB QE tapering was also mention as supporting the euro. EUR/USD traded with a positive intraday bias and settled in the high 1.09 area later in the US. The pair closed the session at 1.0975. The dollar performed better against the yen as US equity sentiment remained constructive, with both the Nasdaq and the S&P touching all time record highs. USD/JPY finished the session at 113.79 (from 113.38).
Overnight, Asian equities took a strong start after the WS record race, but the momentum dwindled as trading preceded. The Press headlines of US President Trump revealing classified information may have caused some investors caution. USD/JPY retreated off this morning's highs in the 113.80 area and trades currently in the 113.50 area. By default EUR/USD buying persists the pair is changing hands with reach of the 1.10 barrier.
Today, the German ZEW economic sentiment is expected to improve (expectations). As both equities and the economy continue to do well, a rise is likely. EMU Q1 GDP is expected to stay unrevised. US housing starts are expected to have rebounded in April keeping them near cycle highs. Permits did better in March and are expected to have stabilized in April (also near highs). Industrial production did fine in March (+0.5% M/M) but mainly due to utility output. For April, we expect production data to be strong. So, we expect good US eco data, but they are probably no (positive) game-changer for the dollar. Negative surprises may get more attention. ECB Coeuré is a key member of the ECB executive board. He recently said as first ECB member that risks were balanced and suggested that the forward guidance might need to be changed some time in the future. While he speaks after European closures, markets will closely listen to him.
Short term trading assessment
The USD/JPY rebound ran into resistance last Thursday when equities stabilized and on Friday after soft US inflation and retail sales. A correction was upcoming after a 6 big figure gain from mid-April to mid-May. Some more corrective losses shouldn't surprise, but as long as USD/JPY 112.20 holds, the outlook for the dollar versus yen remains positive. A buy on dips of USD/JPY near these levels looks appropriate. The Fed will continue to tighten policy and the stronger labour market should ultimately lead to higher wages and inflation. Last week, it looked that EUR/USD could revisit the 1.0821/1.0778 support (gap). However, Friday's data poured some cold water on the dollar's short term comeback. The US and EMU eco calendars are thin this week, but the euro clearly gets the advantage of the doubt. EUR/USD is nearing the top of the 1.0821/1.0778 to 1.1023 range. For now, we don't preposition for a sustained break higher, but the dollar remains most vulnerable to negative surprises, from whatever source.
From a technical point of view, EUR/USD extensively tested the topside of the MT range (1.0874/1.0906 area) late March. The pair finally broke above the 1.09/1.0950 resistance, but the break wasn't confirmed. A sustained break higher would improve the ST picture. Next resistance stands at 1.1129 (62% retracement) and at 1.1366 (correction top). A decline below 1.0821 would suggest that the dollar is regaining traction against the euro.
EUR/USD again nearing the recent highs as euro remains on poleposition
EUR/GBP
EUR/GBP resistance at 0.8509/31 under test
EUR/GBP trading was sentiment-driven on Monday .Sterling tried to regain part of Friday's losses in Asian and early European trading, but the EUR/GBP decline stalled at 0.8458. Later, the pair followed EUR/USD higher and regained the 0.85 handle, testing first resistance (0.8509/31). Cable initially rebounded to the 1.2940 area, probably on USD softness, but couldn't maintain the intraday gains. EUR/GBP closed the session at 0.8510 (from 0.8476). Cable finished the day 1.2896, little changed from Friday.
Today, the UK April Price data, including the CPI will be published. Headline CPI is expected to rise 0.4% M/M and 2.6% Y/Y (from 2.3%). The core CPI is also expected substantially higher at 1.8% Y/Y to 2.3% Y/Y. The rise in UK inflation took a breather in March but this might have been due to technical factors. PPI inflation is expected to slow after a strong run over the previous months. A further rise in April is likely. However, after last week's moderate/balanced BoE approach, we think that a substantial overshoot is needed for the inflation data to support sterling. Softer data might reinforce the market feeling that a BoE interest rate is still very far away. In a day-to-day, perspective, we doubt that sterling will get big support from today's data. At the same time, the euro remains in good shape. So a further test of the 0.8509/31 resistance neckline is likely.
Recently, EUR/GBP was locked in a ST sideways range (0.83/0.85) after a substantial decline in March/April. The pair developed a bottoming out pattern with 0.84/0.8330 as a solid bottom. A breach of 0.8509/31 (previous ST tops) would improve the technical picture. We slightly prefer a EUR/GBP buy-on-dips approach. Longer term, Brexit-complications remain potentially negative for Stering
EUR/GBP: first resistance at 0.8509/31 is under test as euro is better bid across the board
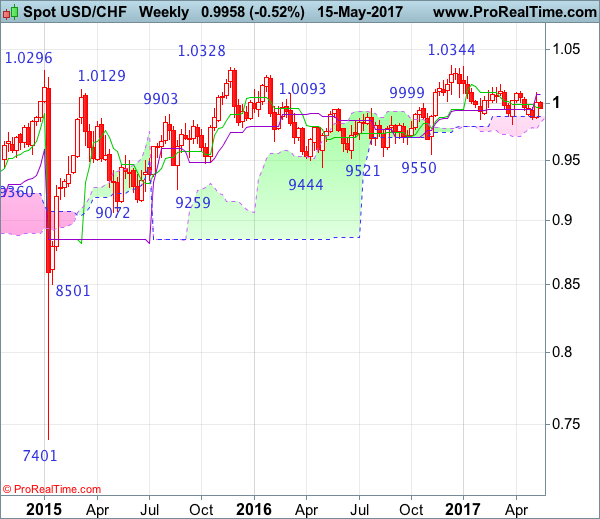
USD/CHF Candlesticks and Ichimoku Analysis
Weekly
• Last Candlesticks pattern: Shooting star
• Time of formation: 7 Mar 2017
• Trend bias: Sideways
Daily
• Last Candlesticks pattern: Morning star
• Time of formation: 9 May 2017
• Trend bias: Near term up
USD/CHF – 0.9944
Although the greenback rose to as high as 1.0100 last week, the subsequent retreat after faltering below previous resistance at 1.0108 suggests further consolidation would be seen, however, reckon downside would be limited to 0.9900-05 and bring another rebound later, above 1.0045-50 would bring retest of 1.0100-08 resistance but break there is needed to retain bullishness and signal another rise from 0.9813 low is underway for headway to 1.0150 and possibly test of resistance at 1.0171 which is likely to hold from here.
On the downside, expect pullback to be limited to 0.9900-05 and bring another rebound later. Below said support at 0.9859 would abort and risk retest of previous support at 0.9813 but only a drop below this support would indicate the decline from 1.0344 top has resumed instead and extend further fall to 0.9735-40 (76.4% retracement of 0.9550-1.0344) and later towards 0.9700, however, near term oversold condition should limit downside to 0.9650-60 and reckon 0.9600 would hold, bring rebound later.
Recommendation: Hold long entered at 0.9970 for 1.0170 with stop below 0.9870.
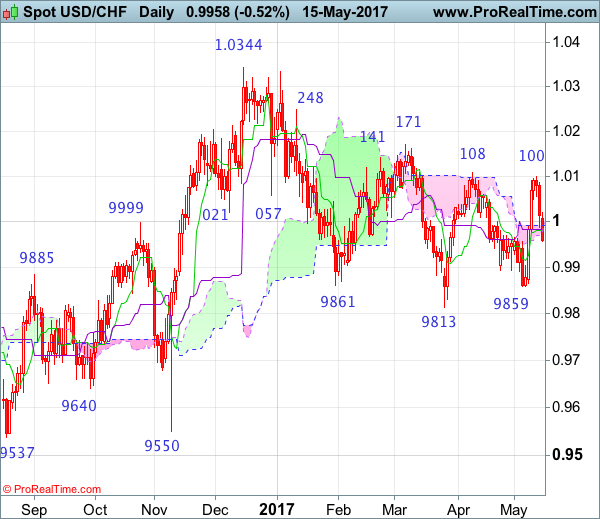
On the weekly chart, failure to extend last week’s rebound and the subsequent retreat after faltering below previous resistance at 1.0108 suggest further consolidation would be seen and weakness to 0.9900 cannot be ruled out, however, as long as support at 0.9859 holds, prospect of another rebound remains, above 1.0045-50 would bring another rise to 1.0100-08 resistance area but break there is needed to retain bullishness and signal another leg of rise from 0.9813 low is underway for test of previous resistance at 1.0171. Looking ahead, a weekly close above there is needed to signal the fall from 1.0344 (Dec high) has ended, bring further rise to 1.0248, a sustained breach above this key level would signal early upmove has possibly resumed, bring test of 1.0335-44 resistance area, above there would provide confirmation and headway to 1.0400-10 and later 1.0500 would follow.
On the downside, although initial marginal weakness from here cannot be ruled out, reckon downside would be limited to 0.9900 and bring another rebound later. Below said support at 0.9859 would bring test of strong support at 0.9813 but only break of this level would abort and signal the erratic fall from 1.0344 top is still in progress, bring further decline for retracement of early upmove to 0.9735-40, then 0.9700 but reckon downside would be limited to 0.9640-50 and price should stay well above support at 0.9550.
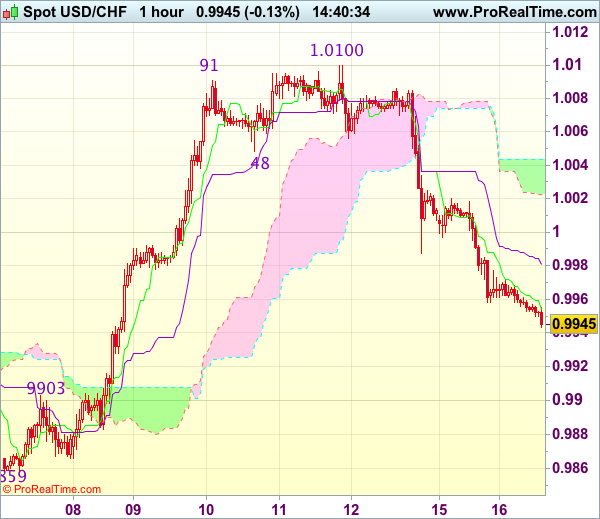
Trade Idea : USD/CHF – Sell at 1.0020
USD/CHF - 0.9943
Most recent candlesticks pattern : N/A
Trend : Near term down
Tenkan-Sen level : 0.9953
Kijun-Sen level : 0.9980
Ichimoku cloud top : 1.0044
Ichimoku cloud bottom : 1.0023
Original strategy :
Sell at 1.0035, Target: 0.9935, Stop: 1.0070
Position : -
Target : -
Stop : -
New strategy :
Sell at 1.0020, Target: 0.9920, Stop: 1.0055
Position : -
Target : -
Stop : -
As the greenback has remained under pressure after Friday’s selloff, suggesting the fall from 1.0100 top is still in progress and further weakness to 0.9930 and possibly towards previous resistance at 0.9903 would be seen, however, near term oversold condition should prevent sharp fall below 0.9875-80 and price should stay above support at 0.9859, bring rebound later.
In view of this, would be prudent to sell dollar on recovery as 1.0020 should limit upside. Above previous support at 1.0056 would defer and risk a stronger rebound to 1.0080 but price should falter below resistance at 1.0100-08, bring retreat later.
Forex Technical Analysis: EUR/USD, USD/JPY, GBP/USD
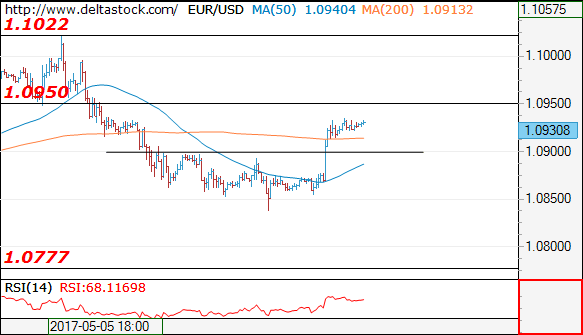
EUR/USD
Current level - 10995
The uptrend here is intact, heading for a test of 1.1022 peak. A break through the latter is likely and it will challenge 1.1080 zone. Initial intraday support lies at 1.0950.
| Resistance | Support | ||
| intraday | intraweek | intraday | intraweek |
| 1.1022 | 1.1130 | 1.0950 | 1.0770 |
| 1.1080 | 1.1300 | 1.0838 | 1.0676 |
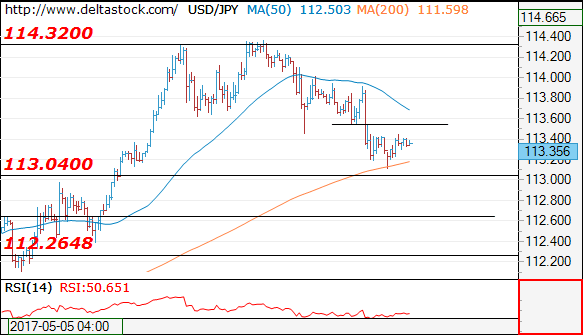
USD/JPY
Current level - 113.44
The corrective pattern above 113.00 signals a bearish outlook and I favor a break through the mentioned support to initiate a slide towards 112.00 area. Initial intraday resistance lies at 113.90.
| Resistance | Support | ||
| intraday | intraweek | intraday | intraweek |
| 113.90 | 113.50 | 113.00 | 109.40 |
| 115.60 | 115.60 | 112.35 | 108.12 |
GBP/USD
Current level - 1.2912
Still no trend dynamics here, so the intraday is absolutely neutral. Key support lies at 1.2830.
| Resistance | Support | ||
| intraday | intraweek | intraday | intraweek |
| 1.2950 | 1.3120 | 1.2830 | 1.2770 |
| 1.3000 | 1.3500 | 1.2770 | 1.2610 |
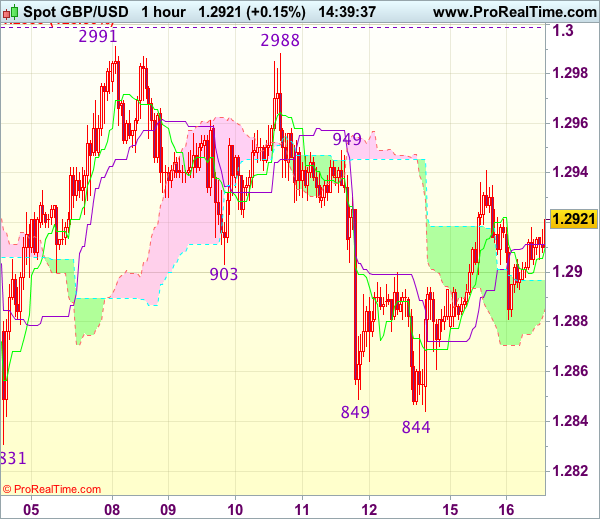
Trade Idea : GBP/USD – Stand aside
GBP/USD - 1.2921
Most recent candlesticks pattern : N/A
Trend : Near term up
Tenkan-Sen level : 1.2911
Kijun-Sen level : 1.2911
Ichimoku cloud top : 1.2897
Ichimoku cloud bottom : 1.2885
New strategy :
Stand aside
Position : -
Target : -
Stop : -
Despite yesterday’s retreat from 1.2941, as cable has rebounded again after finding support at 1.2881, retaining our view that further choppy trading would take place and another bounce to 1.2941-49 resistance cannot be ruled out, however, a firm break above there is needed to suggest correction from 1.2991 has ended at 1.2844, bring further gain to 1.2970 but said resistance at 1.2991 should hold from here. Only a break of 1.2999-00 (1.236 times projection of 1.2109-1.2616 measuring from 1.2365 and psychological resistance) would revive bullishness and extend recent upmove to 1.3040-50 first.
In view of this, would not chase this rise here and would be prudent to stand aside for now. Below said support at 1.2881 would bring weakness to 1.2860-65 but only break there would revive bearishness for test of 1.2844 support, break there would extend the fall from 1.2991 top to 1.2831 support, then 1.2805.
Is The Loonie Ready For A Correction This Week?
Key Points:
- Despite recent bearishness, the USDCAD could see some buying pressure this week.
- Technicals are strongly in favour of a pause in selling pressure.
- Gains could extend to the 1.3687 handle.
It is becoming apparent that the Loonie has potentially entered a near to medium-term downtrend over the past few sessions which could mean that the April rally is finally at its end. As a result of this, there is a temptation to have an overly bearish outlook for the pair in the week to come. However, upon taking a closer look at some of the technicals, the forecast is much less clear and we may actually have some acute bullishness or a ranging phase on our hands instead.
Firstly, closer inspection of the price action from the last week or so suggests that we have a bearish channel shaping up,as opposed to a simple downtrend. Indeed, the pair’s volatile descent is illustrating that there are some fairly rigid constraints to its decline. What’s more, last session’s slip has brought the USDCAD into conflict with the downside of these two constraints which could mean we are actually going to have a brief pause in bearish momentum.
Unfortunately, this boundary has only been tested lightly since the pair’s momentum ostensibly shifted which could cast some doubt on the likelihood of it remaining intact should the bears opt to make another push. In response to this, one could argue that the intersection of a historical reversal point around the 1.3592 handle provides a notable degree of reinforcement for support which significantly caps downside risks for the week ahead.
However, the channel and historical reversal point are not the only things hinting that the pair is set to make an about face this week. For instance, the EMA bias is incredibly bullish and is likely to be exerting some upward pressure on the pair. Moreover, stochastics are no longer overbought which leaves the Loonie with substantial freedom to move in either direction. Finally, the Bollinger Bands are highly divergent which will seriously mitigate the chances of us seeing another breakout in the immediate future.
Ultimately, from a technical perspective, there is a strong argument suggesting that we are about tosee a pause in bearish momentum orhave a rally back to the 1.3687 mark. Of course, this excludes the fundamental factors that one may need to take into consideration which could still prove to be highly bearish moving ahead. Regardless, things may not be as dire for the Loonie as it at first appears so don’t rule it out just yet.
EURGBP Falling Wedge Could Be Signalling A Near Term Break Out
Key Points:
- Price action forms a descending wedge pattern.
- Key support zone around 0.83 handle looming.
- Watch for a upside breakout in the coming days.
The Euro-Pound has seen a convincingly slow burn over the past month as price action has continued to retreat within a descending wedge pattern. Much of the near term decline was down to the volatility around the French election, but with that particular risk event proving unfounded, the path may now be clear for the pair to experience a resurgence.
Fundamentally, the Eurozone is actually experiencing some suggestion of rising inflationary prospects and the ECB is now making noises on near term rate hikes or other contractionary policies. Subsequently, the current environment for Euro longs largely matches some of the technical indicators which are suggesting upward moves ahead.
In fact, a cursory review of the charts provides an illuminating picture of the potential technical setup that is currently in play. The past few weeks has seen price action form a relatively clear descending wedge pattern, on the daily time frame. Subsequently, this pattern is continuing to constrict and squeeze price action as we currently near a key liquidity zone. In addition, the RSI and Stochastic Oscillators are starting to rise, which suggests that the momentum is shifting to the upside.However, the ADX is still within a strong decline but is currently reaching depressed levels which would tend to suggest the trend is likely to run out of steam shortly.
Subsequently, there are some significant technical factors suggesting that the pair is likely to experience a breakout from the current wedge pattern in the coming days. Although it is somewhat difficult to predict which way price action will break from within a wedge most of the indicators are suggesting it will be to the upside. Subsequently, the most likely scenario in the coming days is a swift upward movement, breaking out from the wedge, and a bullish drive towards the 0.8600 handle, and 0.8683 in extension. However, caution is the watch word of the day so wait for price action to breach a zone of resistance around 0.8560 before considering any form of an entry.
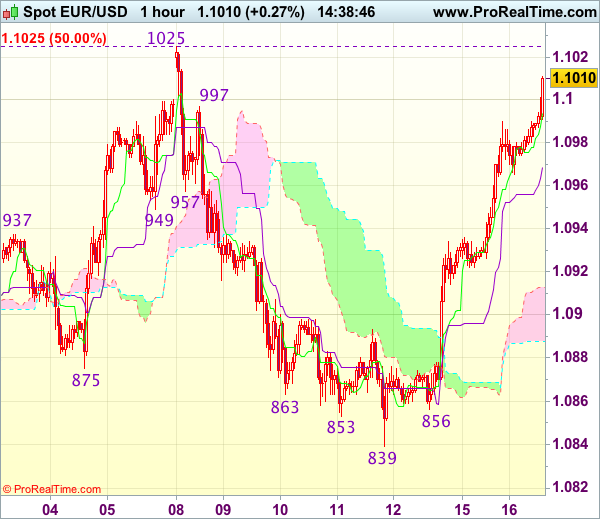
Trade Idea : EUR/USD – Hold short entered at 1.1000
EUR/USD - 1.1010
Most recent candlesticks pattern : N/A
Trend : Near term up
Tenkan-Sen level : 1.0994
Kijun-Sen level : 1.0969
Ichimoku cloud top : 1.0913
Ichimoku cloud bottom : 1.0888
Original strategy :
Sold at 1.1000, Target: 1.0900, Stop: 1.1035
Position : - Short at 1.1000
Target : - 1.0900
Stop : - 1.1035
New strategy :
Hold short entered at 1.1000, Target: 1.0900, Stop: 1.1035
Position : - Short at 1.1000
Target : - 1.0900
Stop : - 1.1035
Euro has surged again today, suggesting caution on our near term bearishness but as long as resistance at 1.1025 holds, prospect of another retreat remains, below 1.0960 would suggest an intra-day top is formed, bring weakness to 1.0920-25, break there would confirm and further fall to 1.0900 and possibly 1.0880 would follow, however, reckon downside would be limited to 1.0855-60 and support at 1.0839 should remain intact.
In view of this, we are holding on to our short position entered at 1.1000. Above said resistance at 1.1025 would abort and signal early upmove has resumed instead, bring further gain to 1.1050-55 and later 1.1075-80 before prospect of another retreat.