Sample Category Title
Australian Dollar Dived On Concerns Over China’s Iron Ore Demand Outlook
We view the recent decline in Australian dollar as a catch-up of the selloff of the iron ore price from its February peak. Spot price for 62% benchmark iron ore slumped more than 30% in 2 months after reading a peak of US$90/tones on February 21. During the period, AUDUSD had been trading within a broad range and dropped around -2%. The relatively resilience in Aussie was likely driven by the broad-based weakness in the greenback as soft dataflow had diminished expectations of a rate June rate hike. Recall the selloff of iron ore prices accelerated in March, after China's pledge reduce steel capacity. The tighter liquidity conditions in China's money markets have reinforced concerns over the government's efforts to crack down the steel industry.
Iron Ore Price Trend
Iron ore has been traded with high volatility since late last year. Spot price for 62% benchmark iron ore (62% iron content is comparable to the average quality of iron ore exported from Australia) jumped from US$55/tonne in October 2016 to US$96/tone in February 2017. One-third of the +75% gains made over the 4-month period was erased in two months, thanks to the Chinese government's pledge in early March to cut steel capacity. At the time of writing this report, the benchmark has recovered to around 69.5 from April's low of 63.5. Risk of the price is skewed to the downside as demand from China is worrisome. Indeed, China's Dalian iron ore futures slumped more than -7.6% today, their biggest one-day decline since November 2016, as futures for steel reinforcing bar(rebar) and coking coal also got dumped. The situation would likely drag the 62% iron ore benchmark, resuming its selloff.
Iron Ore and China's Steel Industry
Iron ore and coking coal are predominant inputs for steelmaking. According to World Steel Association, the traditional blast furnace/basic oxygen converter method of producing crude steel requires on average around 1.4 tonnes of iron ore and 0.8 tonnes of coking coal to produce a tonne of steel. As the world's biggest steel producer, China is also the number one iron ore importer in terms of volume. As such, china's domestic steel price, and the prices of iron ore and coking coal are closely linked.
Iron ore inventory in China soared to a record of 132.45M tones in March and stayed at an elevated 130.55M tones in April, compared with around 80B tones in mid-2015.. Over 50% (68M tones) of the stockpile was from Australia. Meanwhile, China crude steel production reached a record 72M tonnes in March and the output has remained robust in the 20 days of April.
In March, Chinese Premier Li Kequiang indicated that the government aims at closing 100-150M tonnes of steel capacity and 800 million tonnes of outdated coal capacity, by 2020. The government, however, failed to comply with its 2016 target to eliminate 45M tonnes of steel capacity with output gaining +1.2% to 808.4M tones. However, If the government is determined enough to crack down the steel capacity this time, it would mean a sharp decline in output from the current level. Moreover, given the ample supply in iron ore, a key factor of production for steel, the imports outlook would be dismal. Indeed, vessel-tracking and port data indicated that China's iron ore imports fell -3.7% m/m to 83.27M tones in April, the lowest since September 2016 other than February which was derailed by Lunar New Year. The data also signaled that much of the decline came from Australia, where China imported 53.9M tones of iron ore in April, down from 58.9M tonnes in March.
Relationship with Australian Economy
Iron ore is a commodity critical to Australia's budget, its terms of trade and its economic growth. Australia is the second largest global producer by gross weight in 2014, with 817M tonnes million tonnes produced. This accounted 39% of world production. It is the world's largest exporter of iron ore, at 786M tones in volume term and AUD 48B in value term, as of 2015-16. That is Australia is exporting over 95% of the iron ore it produces.
According to Australian Trade Commission, iron ore continued to be the country's largest export earner in 2016, accounting for AUD47.8B exports, or more than 15% of the total. Yet, this also marked a drop of AUD6.8B from the prior year, due to the impact of lower iron ore prices over the year.
As mentioned above, China's iron ore imports sank to the lowest level since September 2016. Indeed, much of the decline came from Australia, where China imported 53.9M tones of iron ore in April, down from 58.9M tonnes in March. The outlook of China's steel industry and its demand for iron ore would be influential to Australia's economic developments.
AUD/USD Elliott Wave Analysis
AUD/USD – 0.7408
AUD/USD – Wave 5 of C and (B) has possibly ended at 1.1081
Although aussie rebounded initially this week, renewed selling interest emerged at 0.7556 and has fallen again below indicated support at 0.7473, retaining our bearish count that the fall from 0.7750 top is still in progress for at least a strong correction of the rise from 0.7158 (Dec 2016 low), then further weakness to 0.7380-85 (61.8% Fibonacci retracement of 0.7158-0.7750), however, near term oversold condition should prevent sharp fall below 0.7300-10 and reckon 0.7280-85 would hold from here, bring rebound later.
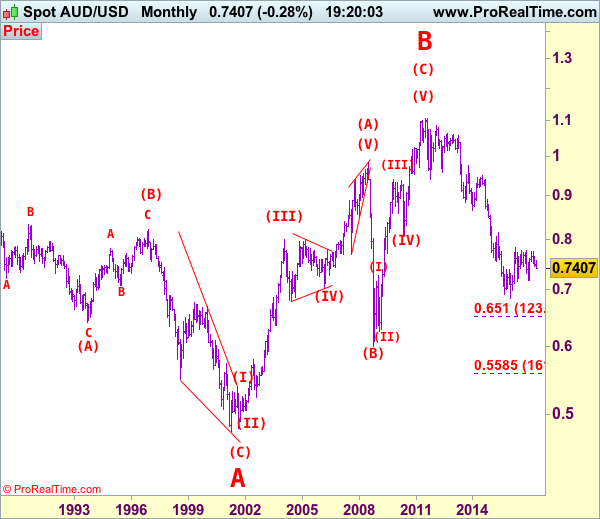
We are keeping our count that top has been formed at 1.1081 (wave 5 of V) and major correction (A-B-C-X-A-B-C) has commenced, indicated downside targets at 0.7945 (61.8% Fibonacci retracement of entire rise from 0.6007-1.1081) and 0.7750 had been met and downside bias is seen for further weakness to 0.6800, then 0.6700 but reckon 0.6500 would hold from here.
Our preferred count is that the rally from 0.6007 to 0.7270 (7 Jan 2009) is marked as wave A, the retreat to 0.6248 (2 Feb 2009) is wave B and the subsequent upmove is labeled as wave C with wave (iii) and wave (iv) ended at 0.8265 and 0.7700 respectively and wave (v) as well as 3 ended at 0.9407, then wave 4 ended at 0.8066 (instead of 0.8578). The wave 5 has met our indicated projection target of 1.1060 and could ended at 1.1081, this level is now treated as the peak of wave (C) as well as larger degree wave B, hence major fall in wave C has commenced, our initial downside target at psychological support at 0.7000 has just been met and further weakness to 0.6500 would be seen later.
On the upside, expect recovery to be limited to 0.7440-50 and bring another decline. Above previous minor support at 0.7510 would defer but only break of said this week’s high at 0.7556 would defer and suggest low is formed, risk test of another previous resistance at 0.7592, break there would add credence to this view, bring correction of recent decline to strong resistance at 0.7611 first.
Recommendation: Hold short entered at 0.7570 for 0.7390 with stop lowered to 0.7470
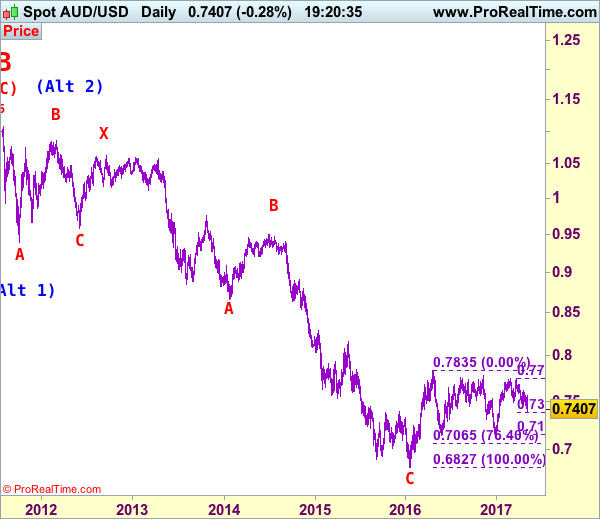
Our alternate count on the daily chart treated the top formed in 2008 at 0.9851 could be a larger degree wave I and was followed by a deep and sharp correction in wave II to 0.6007 and wave III is unfolding from there.
The long-term uptrend started from 0.4775 (2 Apr 2001) with an impulsive structure. Wave I is labeled as 0.4775 to 0.9851 (15 Jul 2008), wave II has ended at 0.6007 (Oct 2008) and wave III is still in progress which may extend further gain to 1.1265.
USDJPY – Threatens Further Upside Pressure
USDJPY - The pair rallied further on Wednesday leaving risk of more strength on the cards. On the downside, support comes in at the 112.50 level where a break if seen will aim at the 112.00 level. A cut through here will turn focus to the 111.50 level and possibly lower towards the 111.00 level. On the upside, resistance resides at the 113.00 level. Further out, we envisage a possible move towards the 113.50 level. Further out, resistance resides at the 114.00 level with a turn above here aiming at the 114.50 level. On the whole, USDJPY looks to recover further higher.
DAX Moves Higher As Macron Wins French Election Debate
The DAX has posted gains in the Thursday session, as the index trades at 12,632.50. On the release front, German and Eurozone Services PMIs continued to show expansion and were above expectations. Later in the day, ECB President Mario Draghi will speak at an event in Switzerland. On Friday, the Eurozone publishes Retail PMI, and the US releases wage growth and nonfarm payrolls reports.
The eurozone has enjoyed a solid first quarter, and more growth has meant more jobs and lower unemployment figures. Just a year ago, the eurozone unemployment rate was at 10.3%, but the rate has been steadily decreasing since then. The March release remained unchanged at 9.5%, within expectations. Germany has led the way, with the unemployment rate dropping to 5.9% in February. Unemployment rolls continue to shrink in Germany, and the decline of 15,000 unemployed persons was better than the estimate of 10,000. Services PMI reports for March have also looked solid, with the Eurozone and Germany releases pointing to expansion.
There were no surprises as the Federal Reserve stayed on the sidelines on Wednesday, holding the benchmark rate at 0.75 percent. However, the Fed rate statement was hawkish, as policymakers emphasized the positives and donwplayed a soft first quarter. The statement noted that consumer spending remains strong and that inflation was “running close” to the Fed’s 2 percent target. The Fed’s message is clearly one of optimism, as the central bank remains on track to raise interest rates twice more in 2017. The Fed’s bullish statement immediately raised the likelihood of a rate hike at June meeting, which jumped to 74 percent after the statement, up from 63% before meeting. The Fed has two key goals which have been achieved, namely full employment and an inflation rate of 2%. One area of concern is the balance sheet, which stands at $4.5 trillion. The minutes of the March meeting stated that policymakers want to start reducing this figure before the end of 2017, and we could see another reference to the balance sheet in the April minutes.
Emmanuel Macron and Marie Le Pen faced off in a television debate on Wednesday, ahead of the French election on Sunday. Polls after the feisty debate showed that about 60% of viewers felt Macron had won, which mirrors current opinion polls ahead Election Day. Macron had the most to lose from the debate, but he kept his cool and acted presidential, in contrast to Le Pen. Barring a dramatic event in the next few days, such as a terror attack, all signs are pointing to Macron becoming France’s next president. The presidential election will be followed by parliamentary elections in June.
The polling average line looks at the five most recent national polls and takes the median value, ie, the value between the two figures that are higher and two figures that are lower.
Source – BBC
French Election Timeline
May 3 – TV debate between the two remaining candidates
May 5 – [from midnight] Poll blackout
May 7 – Second round of French presidential elections. Last polls close at 19:00 BST / 14:00 EDT, with an exit poll result announced immediately.
May 11 – Official proclamation of the new President.
May 14 – [from midnight] End of Francois Hollande’s mandate
June 11 – First round of legislative elections
June 18 – Second round of legislative elections.
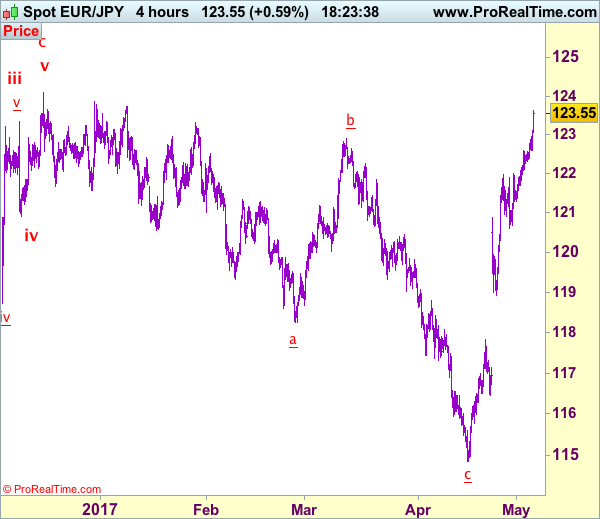
Trade Idea: EUR/JPY – Buy at 122.85
EUR/JPY - 123.45
Recent wave: wave v of (C) ended at 94.12 and major correction in wave A has ended at 149.79
Trend: Near term up
Original strategy:
Buy at 120.65, Target: 122.85, Stop: 120.05
Position: -
Target: -
Stop: -
New strategy :
Buy at 122.85, Target: 124.55, Stop: 122.25
Position: -
Target: -
Stop:-
As the single currency has surged again after brief pullback, adding credence to our view the rise from 114.85 low is still in progress and bullishness remains for further gain to 124.10 resistance, however, break there is needed to retain upside bias for resumption of early upmove to 124.50-60, then towards 125.00 but overbought condition should prevent sharp move beyond there, risk from there is seen for a retreat later.
In view of this, we are looking to buy euro on pullback as 122.85-90 should limit downside and bring another rise. Below support at 122.11 support would defer and risk correction to 121.70 but break of 121.25-30 is needed to signal top is formed, bring retracement of recent rise to 120.85-90 but support at 120.60 should remain intact.
Our latest preferred count is that wave (ii) is ABC-X-ABC which ended at 123.33 and wave (iii) is unfolding with wave iii ended at 100.77, followed by wave iv at 111.57 and wave v as well as the wave (iii) has ended at 97.04, followed by wave (iv) at 111.43 and wave (v) has ended at 94.12 which is also the end of the larger degree v, this also implied the major wave (C) has also ended there, hence major correction has commenced from there with (A) leg unfolding in its lower degree wave c which has possibly ended at 145.69. Under this count, A-B-C wave (B) has commenced with A leg ended at 136.23, wave B at 143.79 and wave C has possibly ended at 149.79.
Our larger degree count is that the decline from 139.26 is wave (C) and is sub-divided into a diagonal triangle i-ii-iii-iv-v with wave i - 105.44, wave ii- 123.33, wave iii - 97.03, wave iv - 111.43, followed by the final wave v as well as the end of wave (C) at 94.12, this also mark the bottom of larger degree wave B. Under this count, major rise in wave C has commenced as an impulsive wave with minor wave III ended at 145.69, wave V is still in progress for further gain to 150.00. Having said that, this so-called wave V could well be the first leg of larger degree 5-waver wave C and this wave C should bring at least a retest of wave A top at 169.97 (July 2008).
Trade Idea: AUD/USD – Sell at 0.7455
AUD/USD – 0.7416
Recent wave: Wave 5 ended at 1.1081 and major correction has commenced for fall to 0.7000 and then towards 0.6500-10
Trend: Near term down
New strategy :
Sell at 0.7455, Target: 0.7300, Stop: 0.7515
Position: -
Target: -
Stop:-
As aussie has fallen again after brief bounce to 0.7556 earlier this week, suggesting recent decline is still in progress and downside bias is seen for further weakness to 0.7380-85 (61.8% Fibonacci retracement of 0.7158-0.7750), then towards 0.7300, however, near term oversold condition should prevent sharp fall below 0.7245-50, bring rebound later.
In view of this, we are looking to sell aussie on recovery as 0.7455-60 should limit upside, bring another decline. Above 0.7500-10 would defer and risk rebound to said resistance at 0.7556 but break there is needed to signal low is formed instead, bring further gain to 0.7580-85 but resistance at 0.7611 should hold from here.
On the 4-hour chart, the move from 0.8066 is the wave 5 with i: 0.8860, ii: 0.8315, wave iii is an extended move ended at 1.0183, iv: 0.9706 and wave v has ended at 1.1081 (also the top of entire wave 5). The subsequent selloff is the major correction which is unfolding as ABC-X-ABC and 2nd A leg has ended at 0.8848, followed by a-b-c wave B which ended at 0.9758, hence, 2nd C wave is now in progress and indicated downside target at 0.7000 and 0.6950 had been met, so further fall to 0.6710-20 cannot be ruled out.

Euro Edges Higher As German Services PMI Beat Expectations
It's been an uneventful week for the euro, which is showing little movement in the Thursday session. Currently, EUR/USD is trading just above the 1.09 line. On the release front, German and Eurozone Services PMIs continue to show expansion and were above expectations. Later in the day, ECB President Mario Draghi will speak at an event in Switzerland. In the US, today's major event is unemployment claims, which is expected to drop to 246 thousand. On Friday, the US releases wage growth and nonfarm payrolls reports, so traders should be prepared for some movement from EUR/USD.
As expected, the Federal Reserve stayed on the sidelines on Wednesday, holding the benchmark rate at 0.75 percent. The Fed rate statement was hawkish, as policymakers emphasized the positives and donwplayed a soft first quarter. The statement noted that consumer spending remains strong and that inflation was 'running close' to the Fed's 2 percent target. The Fed's message is clearly one of optimism, as the central bank remains on track to raise interest rates twice more in 2017. The Fed's bullish statement immediately raised the likelihood of a rate hike at June meeting, which jumped to 74 percent after the statement, up from 63% before meeting. The Fed has two key goals which have been achieved, namely full employment and an inflation rate of 2%. One area of concern is the balance sheet, which stands at $4.5 trillion. The minutes of the March meeting stated that policymakers want to start reducing this figure before the end of 2017, and we could see another reference to the balance sheet in the April minutes.
The eurozone has enjoyed a solid first quarter, and more growth has meant more jobs and lower unemployment figures. Just a year ago, the eurozone unemployment rate was at 10.3%, but the rate has been steadily decreasing since then. The March release remained unchanged at 9.5%, within expectations. Germany has led the way, with the unemployment rate dropping to 5.9% in February. Unemployment rolls continue to shrink in Germany, and the decline of 15,000 unemployed persons was better than the estimate of 10,000. Services PMI reports for March have also looked solid, with the eurozone, Germany and France all posting figures pointing to expansion.
It's Election Day (again) in France on Sunday, with Emmanuel Macron and Marine Le Pen vying for the next president of France. The euro and European stock markets have been very steady in the second round of the campaign, as opinion polls continue to show a comfortable majority for Macron:
The polling average line looks at the five most recent national polls and takes the median value, ie, the value between the two figures that are higher and two figures that are lower.
Source – BBC
French Election Timeline
May 3 – TV debate between the two remaining candidates
May 5 – [from midnight] Poll blackout
May 7 – Second round of French presidential elections. Last polls close at 19:00 BST / 14:00 EDT, with an exit poll result announced immediately.
May 11 – Official proclamation of the new President.
May 14 – [from midnight] End of Francois Hollande's mandate
June 11 – First round of legislative elections
June 18 – Second round of legislative elections.
Technical Outlook: Spot Gold May Attack 100SMA / Daily Cloud Base On Extension Of Strong Post-Fed Bearish Acceleration
Spot Gold accelerated sharply lower on Wednesday, pressed by stronger dollar after Fed and met target at $1234 (Fibo 61.8% of $1197/$1295 rally/daily cloud top).
The price broke few strong supports en- route (200SMA at $1251, 55SMA at $1247 and trendline support at $1240) that weakened the structure.
Fresh weakness on Thursday probed briefly below $1234 pivot, with broken bull-trendline now acting as resistance and capping today’s action.
Fresh bearish signal would be generated on close below $1234 and $1229 (Fibo 38.2% of $1122/$1295) for extension towards next targets at $1222/20 ( daily cloud base / Fibo 76.4% / 100SMA), possibly to $1209 (50% of $1122/$1295).
Oversold slow stochastic on daily chart signals correction but no firmer signal seen so far.
Broken 200SMA is expected to cap extended corrective upticks.
Res: 1241, 1247, 1251, 1256
Sup: 1233, 1229, 1222, 1220
GOLD Strong Selling Pressures, SILVER Important Selling Pressures, CRUDE OIL Targeting Support At 47.01.
GOLD Strong selling pressures.
Gold continues its decline after the yellow metal has faded near the hourly resistance at 1295 (18/04/2017 high). Hourly support located at 1260 (26/04/2017 low) has been broken. The road is wide-open for further decline.
In the long-term, the technical structure suggests that there is a growing upside momentum. A break of 1392 (17/03/2014) is necessary ton confirm it, A major support can be found at 1045 (05/02/2010 low).
SILVER Important selling pressures.
Silver continues its decline. Strong support given at 16.82 (15/03/2017 low) has been broken. Strong resistance is given at a distance at 19.00 (09/11/2017 high). Expected to see continued bearish pressures until at least $16.
In the long-term, the death cross indicates that further downsides are very likely. Resistance is located at 25.11 (28/08/2013 high). Strong support can be found at 11.75 (20/04/2009).
CRUDE OIL Targeting support at 47.01.
Crude oil is trading lower towards key support given at 47.01 (22/01/2017 low). Resistance for a short-term bounce can be found at 50.71 (old support) and 53.70 (12/04/2017 high).
In the long-term, crude oil has recovered after its sharp decline last year. However, we consider that further weakness are very likely. Strong support lies at 24.82 (13/11/2002) while resistance can now be found at 55.24 (03/01/2017 high).
EUR/JPY On Its Way Towards Resistance At 123.31, EUR/GBP Trading Sideways, EUR/CHF Ready For A New Leg Lower.
EUR/JPY On its way towards resistance at 123.31.
EUR/JPY's buying pressures are there. Key resistance area given around 122.00 has been broken. Strong resistance stands at 123.31 (27/01/0217 high). Major support is given at 114.90 (18/04/2017low). Expected to see further increase.
In the longer term, the technical structure validates a medium-term succession of lower highs and lower lows. As a result, the resistance at 149.78 (08/12/2014 high) has likely marked the end of the rise that started in July 2012. Strong support at 94.12 (24/07/2012 low) looks nonetheless far away.
EUR/GBP Trading sideways.
EUR/GBP is trading mixed. The technical structure remains negative as long as the resistance at 0.8530 (25/04/2017 low) holds. Expected to show continued weakness until support given at 0.8304 (05/12/2017 low).
In the long-term, the pair has largely recovered from recent lows in 2015. The technical structure suggests a growing upside momentum. The pair is trading above from its 200 DMA. Strong resistance can be found at 0.9500 psychological level.
EUR/CHF Ready for a new leg lower.
EUR/CHF's selling pressures are increasing. Despite the sharp increase and the recent bullish breakout which is very likely psychological, we believe that the medium-term pattern suggests us to see at some point renewed bearish pressures towards key support that can be found at 1.0623 (24/06/2016 low).
In the longer term, the technical structure is mixed. Resistance can be found at 1.1200 (04/02/2015 high). Yet,the ECB's QE programme is likely to cause persistent selling pressures on the euro, which should weigh on EUR/CHF. Supports can be found at 1.0184 (28/01/2015 low) and 1.0082 (27/01/2015 low).