Sample Category Title
EUR/USD Mid-Day Outlook
Daily Pivots: (S1) 1.0865; (P) 1.0900 (R1) 1.0919; More....
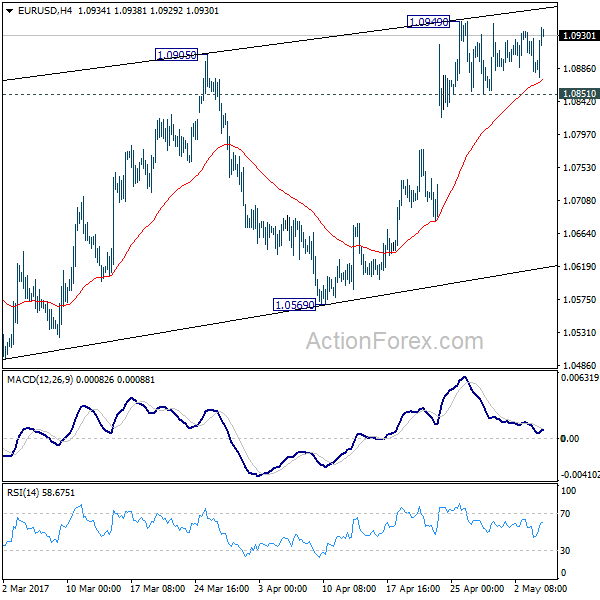
EUR/USD recovers strongly today after being supported above 4 hour 55 EMA. But it's staying below 1.0949 temporary low. Intraday bias remains neutral for the moment. At this point, further rise is still in favor as long as 1.0851 minor support holds. However, choppy rebound from 1.0339 is seen as a correction. Hence we'd look for topping again on next rise. Meanwhile, on the downside, break of 1.0777 will turn turn bias to the downside for 1.0851 support first.
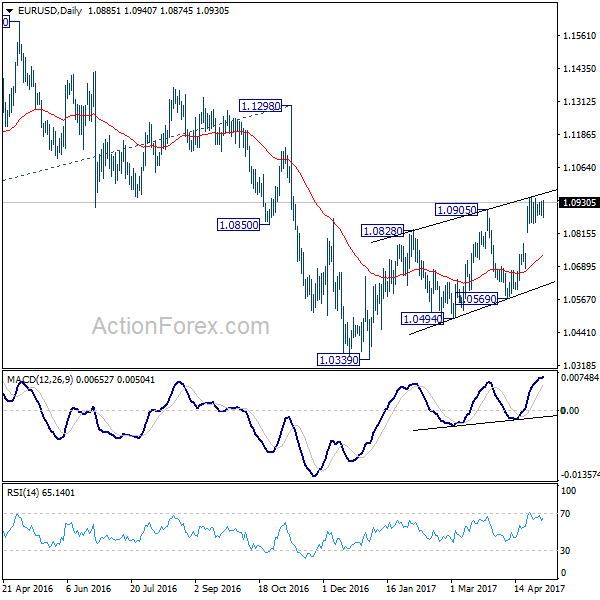
In the bigger picture, as long as 1.1298 key resistance holds, whole down trend from 1.6039 (2008 high) is still expected to continue. Break of 1.0339 low will send EUR/USD through parity to 61.8% projection of 1.3993 to 1.0461 from 1.1298 at 0.9115. However, considering bullish convergence condition in weekly MACD, break of 1.1298 will indicate term reversal. This would also be supported by sustained trading above 55 week EMA.
Dollar Lower Despite Sharp Fall in Initial Jobless Claims, Euro and CAC Lifted by French Macron
Dollar trades softer against European majors as the brief lift from FOMC statement fades. Economic data from US are solid but provide little support to the greenback. Initial jobless claims dropped -19k to 238k in the week ended April 29, below expectation of 246k. Continuing claims dropped 23k ti 1.96m, lowest in 17 year. Challenger report showed -42.9% yoy fall in planned layoff in April. Trade deficit narrowed slightly to USD -43.7b in March. Non-farm productivity dropped -0.6% in Q1 while unit labor costs rose 3.0%.
French stocks and Euro surges
French stocks and Euro surges as pro-Euro centrist Emmanuel Macron performed well in the final TV debate against EU-sceptic far-right Marine Le Pen. CAC is trading up 0.95% at the time of writing and hit the highest level in more than nine years. According to a viewers poll by French broadcaster BFMTV, 63% of viewers voted Macron as the "most convincing" of the pair after the debate. According to latest running poll average, Macron is still having 18% lead over Le Pen and is still widely tipped to win the presidential election this Sunday. Released from Eurozone, retail sales rose 0.3% mom in March. Eurozone services PMI was revised higher to 56.4 in April. Italy services PMI rose sharply to 56.2 in April. Also from Europe, SECO consumer confidence dropped to -8 in April.
UK PMI services shone
UK PMI services rose to 55.8 in April, up from 55.0, and beat expectation of 54.6. That's also the highest level this year. Markit noted that "UK business activity growth gained momentum for a second successive month in April, with a hat-trick of faster growth signalled by the three PMI surveys." And, "the improvement in the survey data indicates that economic growth has revived after having slowed sharply in the first quarter of the year." Countering weakness in household-facing business, UK economy could achieve 0.4% growth in Q2 as a whole. Also from UK, mortgage approvals dropped to 67k in March. M4 Money supply rose 0.3% mom in March.
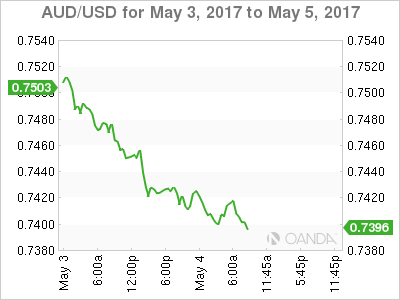
Aussie catching up the slump iron ore prices
Recent decline in Australian dollar is viewed as a catch-up of the selloff of the iron ore price from its February peak. Spot price for 62% benchmark iron ore slumped more than 30% in 2 months after reading a peak of US$90/tones on February 21. During the period, AUDUSD had been trading within a broad range and dropped around -2%. The relatively resilience in Aussie was likely driven by the broad-based weakness in the greenback as soft dataflow had diminished expectations of a rate June rate hike. Recall the selloff of iron ore prices accelerated in March, after China's pledge reduce steel capacity. The tighter liquidity conditions in China's money markets have reinforced concerns over the government's efforts to crack down the steel industry. More in Australian Dollar Dived On Concerns Over China's Iron Ore Demand Outlook
EUR/USD Mid-Day Outlook
Daily Pivots: (S1) 1.0865; (P) 1.0900 (R1) 1.0919; More....
EUR/USD recovers strongly today after being supported above 4 hour 55 EMA. But it's staying below 1.0949 temporary low. Intraday bias remains neutral for the moment. At this point, further rise is still in favor as long as 1.0851 minor support holds. However, choppy rebound from 1.0339 is seen as a correction. Hence we'd look for topping again on next rise. Meanwhile, on the downside, break of 1.0777 will turn turn bias to the downside for 1.0851 support first.
In the bigger picture, as long as 1.1298 key resistance holds, whole down trend from 1.6039 (2008 high) is still expected to continue. Break of 1.0339 low will send EUR/USD through parity to 61.8% projection of 1.3993 to 1.0461 from 1.1298 at 0.9115. However, considering bullish convergence condition in weekly MACD, break of 1.1298 will indicate term reversal. This would also be supported by sustained trading above 55 week EMA.
Economic Indicators Update
| GMT | Ccy | Events | Actual | Forecast | Previous | Revised |
|---|---|---|---|---|---|---|
| 01:30 | AUD | Trade Balance (AUD) Mar | 3.11B | 3.33B | 3.57B | |
| 01:45 | CNY | Caixin China PMI Services Apr | 51.5 | 52.6 | 52.2 | |
| 05:45 | CHF | SECO Consumer Confidence Apr | -8 | 3 | -3 | |
| 07:45 | EUR | Italy Services PMI Apr | 56.2 | 53.7 | 52.9 | |
| 07:50 | EUR | France Services PMI Apr F | 56.7 | 57.7 | 57.7 | |
| 07:55 | EUR | Germany Services PMI Apr F | 55.4 | 54.7 | 54.7 | |
| 08:00 | EUR | Eurozone Services PMI Apr F | 56.4 | 56.2 | 56.2 | |
| 08:30 | GBP | Services PMI Apr | 55.8 | 54.6 | 55 | |
| 08:30 | GBP | Mortgage Approvals Mar | 67K | 67K | 68K | |
| 08:30 | GBP | M4 Money Supply M/M Mar | 0.30% | 0.20% | -0.30% | -0.20% |
| 09:00 | EUR | Eurozone Retail Sales M/M Mar | 0.30% | 0.10% | 0.70% | |
| 11:30 | USD | Challenger Job Cuts Y/Y Apr | -42.90% | -2.00% | ||
| 12:30 | CAD | International Merchandise Trade (CAD) Mar | -0.1B | 0.3B | -1.0B | -1.1B |
| 12:30 | USD | Non-Farm Productivity Q1 P | -0.60% | 0.00% | 1.30% | |
| 12:30 | USD | Unit Labor Costs Q1 P | 3.00% | 2.60% | 1.70% | |
| 12:30 | USD | Trade Balance Mar | -43.7B | -44.9B | -43.6B | -43.8B |
| 12:30 | USD | Initial Jobless Claims (29 APR) | 238K | 246K | 257K | |
| 14:00 | USD | Factory Orders Mar | 0.60% | 1.00% | ||
| 14:30 | USD | Natural Gas Storage | 74B |
Trade Idea Update: EUR/USD – Buy at 1.0900
EUR/USD - 1.0930
Original strategy :
Buy at 1.0900, Target: 1.1000, Stop: 1.0870
Position : -
Target : -
Stop : -
New strategy :
Buy at 1.0900, Target: 1.1000, Stop: 1.0870
Position : -
Target : -
Stop : -
Although the single currency fell briefly to 1.0875, lack of follow through selling and current rebound suggest consolidation with upside bias would be seen and test of indicated resistance at 1.0951 (last week’s high) would be seen, however, break there is needed to signal recent upmove from 1.0340 low has resumed for headway to 1.0975-80 and possibly towards 1.1000 but price should falter below 1.1025 (50% projection of 1.0602-1.0951 measuring from 1.0851).
In view of this, we are looking to buy euro on dips. Below intra-day support at 1.0875 would prolong consolidation below said resistance at 1.0951, bring correction towards support at 1.0851 but price should stay above 1.0821 support, bring another rise later.
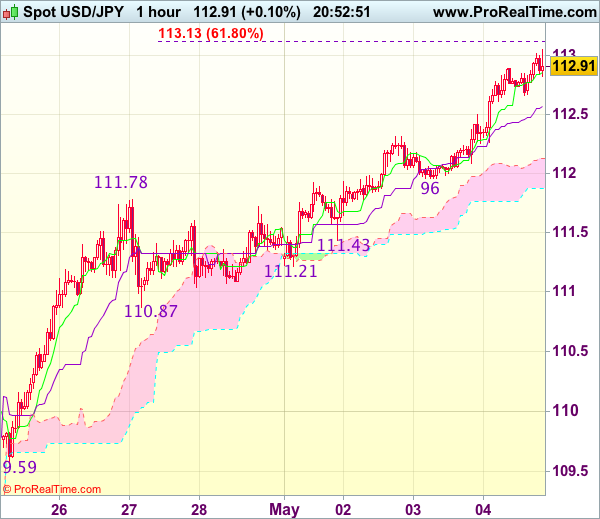
Trade Idea Update: USD/JPY – Buy at 112.50
USD/JPY - 112.88
Original strategy :
Buy at 112.00, Target: 113.00, Stop: 111.65
Position : -
Target : -
Stop : -
New strategy :
Buy at 112.50, Target: 113.50, Stop: 112.15
Position : -
Target : -
Stop : -
As the greenback has surged again after finding renewed buying interest at 111.96 yesterday, adding credence to our view that recent upmove is still in progress and bullishness remains for further subsequent gain to 113.10-15 (61.8% projection of 108.13-111.78 measuring from 110.87) but near term overbought condition should limit upside to previous resistance at 113.54 and reckon 113.75-80 (76.4% retracement of 115.51-108.13) would hold, risk from there has increased for a retreat to take place later.
In view of this, would not chase this rise here and would be prudent to buy dollar on subsequent pullback as 112.45-50 should limit downside. Only below indicated support at 111.96 would defer and suggest top is formed, bring correction of recent rise to previous resistance at 111.78.
Macron has Euro Markets on Firm Footing
Thursday May 4: Five things the markets are talking about
In Europe, assets get a further boost from French centrist Emmanuel Macron, who retains the poll lead (59% vs. 41%) after last night's TV debate with National Front leader Marine Le Pen. They face off in the second, and final, Presidential vote this Sunday.
The Fed did what was expected on Wednesday, kept rates steady. The accompanying FOMC statement cited recent economic data weakness, but did not change their current stance on the progression of interest rate increases.
The statement also mentioned that the U.S labor market continued to show signs of strength and that consumer spending was again solid, with inflation close to target.
In translation, the Fed remains on course for a further two rate hikes this year.
Currently, Fed-funds futures show that investors see a +71% chance that the Fed will raise rates at its next meeting in June. Over coming weeks, the key will be U.S economic data, starting with tomorrow's non-farm payroll (NFP) print.
1. Global indexes mixed reaction
Asian stocks retreated overnight, taking their cues from a subdued session on Wall Street. With Japan closed for the Golden Week holiday, market activity was again relatively subdued.
In China, stocks pared their earlier losses to trade flat, as gains in small-caps offset a cooling in China's services sector growth (see below) to its slowest in 12-months in April - fears of slower economic growth continues to dent business confidence.
In Hong Kong, the Hang Seng dropped -0.4%, while Aussie S&P/ASX 200 Index lost -0.3%, pressured by a fall in commodity prices, in particular iron ore on weaker China data.
In Europe, regional indices are trading a tad higher on the back of continued strong corporate earnings and continued confidence from the FOMC. Financials are supporting the Eurostoxx, while an uptick in commodity prices has the FTSE in the black in early trade.
U.S stocks are set to open higher (+0.3%).
Indices: Stoxx50 +0.7% at 3611, FTSE +0.3% at 7258 , DAX +0.70% at 12615, CAC-40 +0.8% at 5341, IBEX-35 +0.8% at 10927, FTSE MIB +1.3% at 21036, SMI +0.4% at 8931, S&P 500 Futures +0.3%
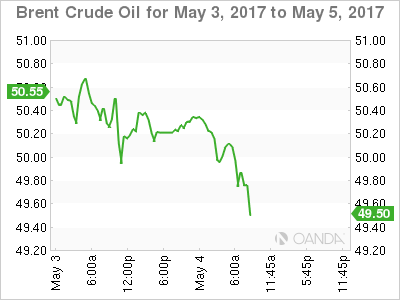
2. Oil down on lower than expected drop in U.S inventories.
Oil prices are on the back foot for a fourth consecutive session overnight, nearing their lowest level in two month after data showed a lower than expected decline in U.S inventories.
Yesterday's EIA data showed crude inventories fell -930k barrels in the week to April 28, against expectations for a decrease of -2.3m barrels.
Note: Stocks have steadily declined over the last month, but at +527.8m barrels they remain just -7m barrels off a record high.
Brent crude oil futures are down -32c at +$50.47 a barrel, while U.S West Texas Intermediate (WTI) futures are also down -32c at +$47.50 a barrel.
The market still expects OPEC and its non-OPEC partners to extend last November's cut in production deal to keep up to -1.8m bpd off the market later this month, but failure to do so could see crude 'bulls' aggressively unwind their remaining long positions.
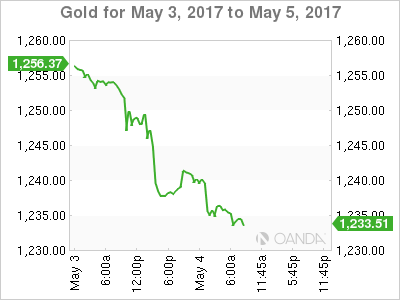
Gold prices (-0.3% to +$1,234.52 per ounce) trade atop of their six week low, pressured by the dollar's rise on expectations that the Fed may raise interest rates as early as next month. It fell -1.5% yesterday - its worst single-day drop since late November.
3. Euro French yield spreads tighten
Ahead of Sunday's second round French presidential vote the markets have already priced in a win by centrist Emmanuel Macron over Marine Le Pen and have started to concentrate on other drivers. Despite the small shift in polls after last nights live TV debate has not changed the picture materially, nor caused real new fears of an upset on Sunday. Euro analysts expect markets to show slightly more relief on Monday, but nothing compared to the post-first round results.
With French voters going to the polls, the spread between French 10-years (OAT's) and the German 10-year Bund have now fallen to the lowest level since November after the debate. OAT's now yield +0.40%, +1 bps more than Bunds, down from as much as +0.78% ahead of the first round of the election.
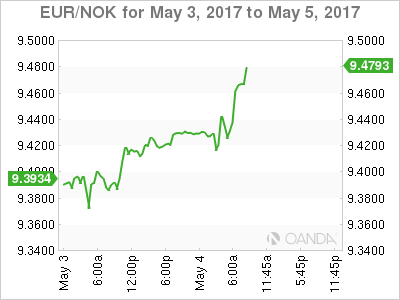
Elsewhere, Norway's central bank (Norges) this morning left its benchmark interest rate unchanged (+0.5%), as expected, and signalled that it is in no rush to raise rates. Governor Olsen said that the "the outlook and the balance of risks for the Norwegian economy do not appear to have changed substantially since the March report."
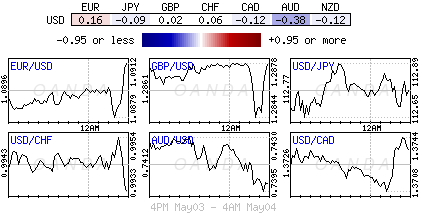
4. 'Big' dollar gives up some FOMC gains
The USD is a tad softer against the 'majors' after printing its two-week highs post FOMC rate decision yesterday - U.S policy makers have kept the door ajar for a June rate hike.
The EUR/USD is holding well above the €1.09 psychological level (€1.0930) and within striking distance of re-testing last week five-month highs of €1.0950. Through here, the single unit is expected to gather support to test €1.1025.
Sterling has found some support post service PMI data (see below), GBP/USD is hovering just below the £1.29 level. USD/JPY remains atop of its multi-week highs as the pair edges towards the ¥113 region. The AUD/USD (A$0.7411) remains under press from weaker commodity prices on the back of disappointing Chinese data (see below), in particular iron ore.
5. Mixed global PMI's, Aussie trade stronger
Overnight, China Caixin Services PMI hit an eleven-month low with its fourth consecutive decline (51.5 vs. 52.2), pressured by new-orders rate of growth slowing. The employment component growth also eased to its weakest level this year, while cost pressures eased across all sectors.
Down-under, the Aussie Trade Balance saw its fifth straight month of surplus, with export growth edging higher to +2.0% from +1.5%, while imports were up +5% vs. a decline of -5% in prior month. Iron ore shipments rose to three-month high.
Earlier this morning, U.K data for services PMI for April came in stronger than expected, rising to 55.8 from 54.6 in March, above the consensus forecast of 55.0. Coupled with the previously released measures for manufacturing and construction, which had also surprised on the upside, could suggest the U.K economy is picking up early steam in Q2 after Q1's sharp slowdown.
Finally, the composite PMI for the eurozone (activity in the manufacturing and services sectors) rose to 56.8 in April from 56.4 in March, hitting a six-year high.
Note: The April reading was raised from a preliminary estimate of 56.7.
Sterling, Euro and Dollar in Focus
Asian stocks retreated on Thursday following the mixed cues from Wall Street overnight, after the Federal Reserve signaled towards an increase in US interest rates later this year. In Europe, equities were buoyed by corporate earnings and optimism over Emmanuel Macron winning the second round of the French Presidential election. Although Wall Street was pressured by the Fed hawks on Wednesday, Europe's upside momentum and solid corporate earnings could help bulls claw back recent losses.
Sterling buoyed by solid Services PMI
Sterling lazily strolled towards 1.2900 during trading on Thursday after UK Services PMI for April unexpectedly rose to a four-month high at 55.8. With the construction, manufacturing and services sector in the UK all displaying signs of resilience against Brexit woes in April, Sterling could be supported in the short term. With uncertainty still a dominant theme with regards to Brexit, investors may start to overlook the improving fundamentals with an increased focus on Brexit negotiations. Hard Brexit fears remain rife with the current dispute over the €100 billion "Brexit bill" acting as the first major obstacle of many. From a technical standpoint, the GBPUSD could appreciate towards 1.3000 if bulls maintain control above 1.2875. In an alternative scenario, repeated weakness below 1.2875 should encourage a decline towards 1.2775.
Dollar revived by Fed hawks
The Greenback popped higher on Wednesday after the Federal Reserve surprised markets by maintaining a hawkish stance, despite the softening outlook for the US. Although economic data has been mixed and first quarter growth sluggish at 0.7%, the committee viewed this as transitory, with economic activity expanding at a moderate pace as the stance of monetary policy is adjusted. With expectations heightened over the Federal Reserve raising US rates further, and the CME Group FedWatch tool displaying a 74% probability of a rate hike in June, the Dollar could remain buoyed.
Investors may direct their attention towards the pending US unemployment claims report, which could support the Dollar further if unemployment falls below estimates. From a technical standpoint, although the Fed hawks inspired Dollar bulls on Thursday, the Dollar Index still remains under pressure on the daily charts. A breakout above 99.40 should encourage a further incline towards 99.50 and 99.80 respectively. On the other hand, repeated weakness under 98.80 should open a path to 98.50.
Euro higher on Macron optimism
The Euro glided higher on Thursday as investors maintained optimism over Emmanuel Macron winning the second round of the French Presidential election this weekend. Bullish investors also took advantage of the positive Services PMI data from Europe to propel the EURUSD towards 1.0930 as of writing. With the current polls showing Macron holding a solid 20 point lead over Marine Le Pen, it may be safe to say that a Macron victory has already been "baked into" market pricing. With the French Presidential election saga slowly coming to an end, investors may direct their focus towards the French parliamentary election on June 11 and 18.
Although the EURUSD is currently trading around five-month highs, the currency does feel undervalued, especially when factoring in how Economic data from Europe continues to exceed expectations. I feel that political risk and uncertainty has dictated the value of the Euro this year with economic fundamentals becoming somewhat secondary. While a Macron victory may send the EURUSD above 1.1000, an unanticipated Marine Le Pen triumph could expose prices to extreme downside risks, with parity still a possibility.
Trade Idea: GBP/USD – Buy at 1.2865
GBP/USD – 1.2885
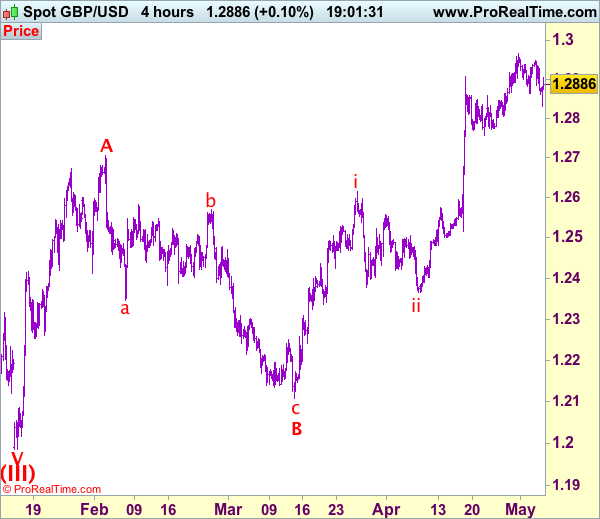
Recent wave: Wave V of larger degree wave (III) has ended at 1.1986 and major correction has commenced from there for gain to 1.3000 and 1.3140-50
Trend: Near term up
Original strategy :
Buy at 1.2770, Target: 1.2960, Stop: 1.2710
Position: -
Target: -
Stop: -
New strategy :
Buy at 1.2865, Target: 1.3025, Stop: 1.2805
Position: -
Target: -
Stop:-
Although cable slipped initially to 1.2831, the subsequent rebound suggests consolidation with mild upside bias would be seen for gain to 1.2948 but break there is needed to signal the retreat from 1.2965 has ended, bring retest of this level, break there would confirm recent upmove has resumed and extend gain to psychological resistance at 1.3000 but overbought condition should limit upside to 1.3050 and price should falter below 1.3100. We are keeping our view that the wave c as well as larger degree wave B has ended at 1.2109, hence impulsive wave C has commenced from there with wave i of C ended at 1.2616, follow by a correction to 1.2365 (end of wave ii) and wave iii rally is unfolding, hence further gain to indicated upside targets would be seen.
Our preferred count on the daily chart is that cable's rebound from 1.3500 (wave (A) trough) is unfolding as a wave (B) with A ended at 1.7043, followed by triangle wave B and wave C as well as wave (B) has ended at 1.7192, the subsequent selloff is the larger degree wave (C) which is still unfolding with minor wave (III) of larger degree wave 3 ended at 1.1986, hence wave (IV) correction is in progress which could either be a triangle wave (IV) of a complex formation but upside should be limited to 1.3500 and price should falter well below 1.4000, bring another decline in wave (V) of 3 for weakness to 1.1500, then 1.1200.
On the downside, expect pullback to be limited to 1.2850-60 and bring another rise later. Below said support at 1.2831 would risk weakness to support at 1.2805 but break there is needed to signal a temporary top is possibly formed, bring retracement of recent rise to support at 1.2757 and bring another rise later. A drop below this level would defer and signal a temporary top is formed instead, risk correction of recent upmove to 1.2700-10 later.
Trade Idea: GBP/JPY – Buy at 144.50
GBP/JPY - 145.55
Recent wave: Medium term low formed at 120.50 and (A)-(B)-(C) major correction has commenced with (A) leg ended at 148.45, hence wave (B) is unfolding for retreat to 131.00-10.
Trend: Near term up
Original strategy:
Buy at 142.55, Target: 145.00, Stop: 141.95
Position: -
Target: -
Stop: -
New strategy :
Buy at 144.50, Target: 146.50, Stop: 143.90
Position: -
Target: -
Stop:-
As sterling has maintained a firm undertone after recent rally, adding credence to our bullish count that recent upmove from 135.60 is still in progress and may extend further gain to 146.00-10, then 146.50, however, near term overbought condition should limit upside to 147.00-10 and price should falter well below previous chart resistance at 148.45, bring retreat later.
In view of this, would not chase this rise here and would be prudent to buy sterling on pullback as 144.40-50 should limit downside. Below 144.00 would defer and risk correction to 143.75-80 but reckon support at 143.15 would limit downside and price should stay well above previous resistance at 142.10-15, bring another upmove.
Our preferred count is that larger degree wave V with circle is unfolding from 251.12 with wave (I) 219.34, (II): 241.38 and wave (III) is subdivided into 1: 192.60, 2: 215.89 (23 Jul 2008) and wave 3 ended at 118.87 earlier in 2009. The correction from there to 162.60 is wave 4 which itself is a double three and is labeled as first a-b-c ended at 151.53, followed by wave x at 139.03, 2nd a ended at 162.60, 2nd b at 146.75 and 2nd c leg of wave 4 ended at 163.00. Therefore, the decline from 163.00 to 116.85 is now treated as wave 5 which also marked the end of larger degree wave (III), hence wave (IV) major correction has commenced for retracement of the wave (III) from 241.38 and upside target at 183.95-00 (50% Fibonacci retracement of the wave (II) from 241.38) had been met, a drop below 160.00 would suggest wave (IV) has ended at 195.85, bring decline in wave (V) for initial weakness to 130 (already met) and 120.

EUR/CAD Elliott Wave Analysis
EUR/CAD – 1.5010
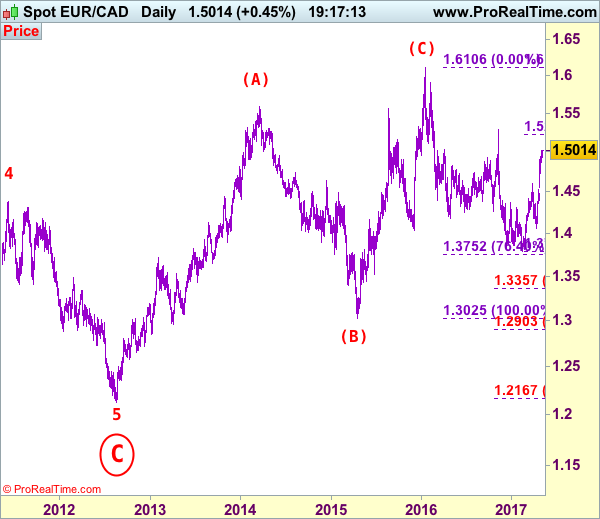
EUR/CAD: Wave 4 ended at 1.4380 and wave 5 as well as circle wave C has possibly ended at 1.2129, major (A)-(B)-(C) correction has commenced and indicated target at 1.6000 had been met.
As the single currency has risen again after finding renewed buying interest at 1.4733 late last week, adding credence to our view that low has been formed earlier at 1.3784 and bullishness remains for there rise from there to bring a stronger retracement of recent decline to 1.5050, then 1.5140-50, however, near term overbought condition should prevent sharp move beyond 1.5215-20 (61.8% Fibonacci retracement of 1.6106-1.3784), risk from there is seen for a retreat later.
Our latest preferred count is that larger degree wave [C] from 1.3289 as well as circle wave B ended at 1.7509 in Dec 2008 with (A): 1.6325, (B): 1.4719 followed by wave (C) at 1.7509, hence circle wave C is unfolding with wave 1 ended at 1.5186 (diagonal wave 1), wave 2 at 1.6096, impulsive wave 3 has ended at 1.2451, followed by wave 4 at 1.4380, in view of recent strong rebound, we are now treating the wave 5 as well as larger degree circle wave C has ended at 1.2129, hence (A)-(B)-(C) correction has commenced from there with impulsive wave (C) now unfolding and indicated initial upside target at 1.6000 had been met and reckon 1.6500 would hold.
On the downside, whilst pullback to 1.4900-10 is likely, reckon downside would be limited to 1.4800 and renewed buying interest should emerge above 1.4750-60 and bring another rise to aforesaid upside targets. Only below previous resistance at 1.4600 would abort and signal top is formed instead, bring weakness to 1.4530-35 but downside should be limited to 1.4480-85 and price should stay well above support at 1.4397, bring another rally later.
Recommendation: Buy at 1.4770 for 1.5050 with stop below 1.4670.
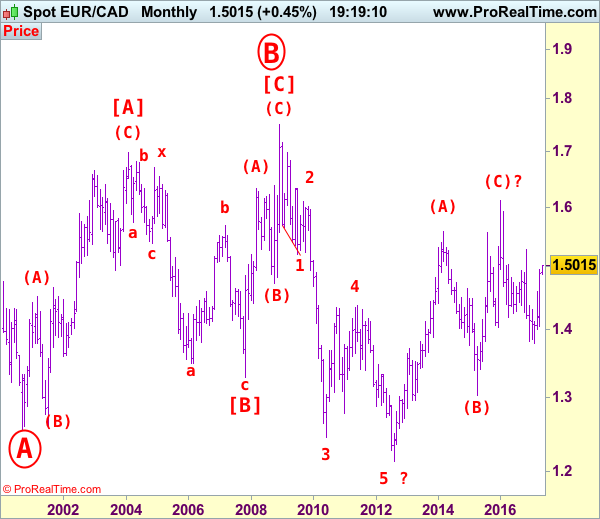
On the bigger picture, our long-term count on the monthly chart is that a big sideways consolidation from 2000 low of 1.2557 has possibly ended at 1.7509 as circle wave B with [A]: 1.6976 ( (A): 1.4513, (B): 1.2612, (C): 1.6976), wave [B]: 1.3289 is a double three with 1st a-b-c: 1.5384, x: 1.6709 and 2nd a-b-c: 1.3289. As indicated above, the wave [C] has ended at 1.7509. The selloff from there is now unfolding which itself should be labeled as an impulsive wave with wave 1: 1.5186 (diagonal wave 1), followed by wave 2: 1.6096 and wave 3: 1.2451, wave 4: 1.4380, wave 5 as well as larger degree circle wave C has possibly ended at 1.2129 and major correction has possibly commenced for retracement of recent decline towards 1.4000, then 1.4180-90 (38.2% Fibonacci retracement of 1.7509-1.2129). Below said support at 1.2129 would risk weakness to psychological support at 1.2000 and then 1.1851 (50% projection of 1.7509-1.2451 measuring from 1.4380) but reckon 1.1500 would remain intact, bring reversal later.
BTUSD Trading In A BIG Three Wave Rally
BTCUSD may be trading in a higher degree A-B-C rally, with current price trading within the final stages of wave C. That said price may still see higher prices within the unfolding wave C, but still let's be aware of probable reversals that may happen in weeks or months ahead.
BTCUSD, Daily