Sample Category Title
Elliott Wave View: NZDUSD Downside Resumes
Revised Elliott Wave view in NZDUSD suggests the decline from 3/21 high (0.709) is unfolding as a triple three Elliott Wave structure where Minute wave ((w)) ended at 0.6905, Minute wave ((x)) ended at 0.7053, Minute wave ((y)) ended at 0.6844 and Minute second wave ((x)) is proposed complete at 0.6968. Minute wave ((z)) is in progress and unfolding as a double three Elliott Wave structure where Minutte wave (w) ended at 0.6835 , and Minutte wave (x) is in progress to correct cycle from 5/2 high before pair resumes lower again. We don’t like buying the pair and expect bounces in Minutte wave (x) to find sellers in 3, 7, or 11 swing for more downside provided that pivot at 0.6968 high remains intact.
NZDUSD 1 Hour Elliott Wave Chart
Market Morning Briefing: Dollar Has Reversed Its Gains Ahead Of The US Jobs Data Tonight
STOCKS
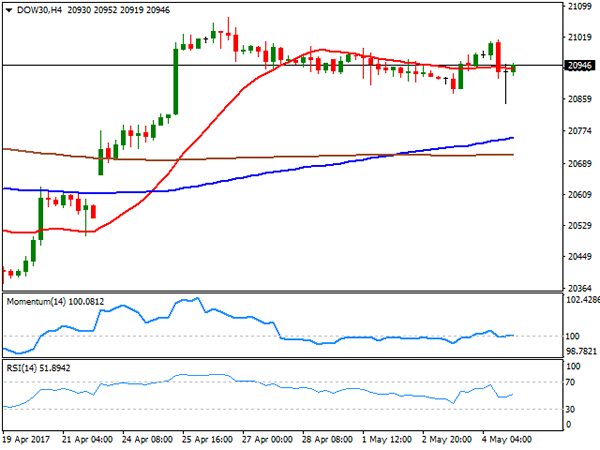
Dow (20951.47, -0.03%) closed lower and lack of any directional momentum just now is keeping the price stable. While below 21000, we could expect a test of 20800-20600 levels before again starting to rise from there.
Dax (12647.78, +0.96%) has broken the resistance on the daily candle charts but looking at the 3-day and weekly charts, the index is at crucial resistance levels and if it breaks on the upside, further rally towards 12750 and higher is possible. Else a corrective dip from current levels could be expected.
Shanghai (3098.24, -0.93%) has just broken below 3100 and may re-test 3075. A break below 3075 could be an important cue to initiate a fresh fall else a sharp bounce from 3075 is needed to take it towards 3150/75 and higher.
Nifty (9359.90, +0.51%) has been moving in line with expectation. Important resistance at 9400 remains intact and could hold in the medium term.
COMMODITIES
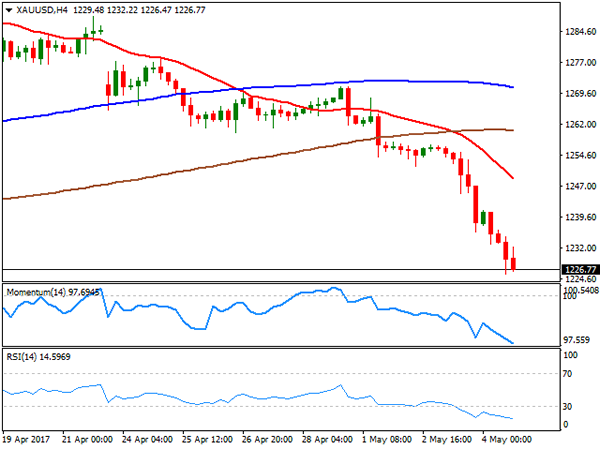
Gold (1228) had failed to close above 1239 levels and moved lower against our expectation. It is hovering around its crucial support of 1228. A close below 1228could open up 1188 levels as well. The bias would remain bearish while it is trading below 1256 levels. The scrip id highly oversold in near term time frame thus a possibility of a corrective bounce towards 1240-50 can’t be ruled out.
Similar kind of chart has been formed in silver (16.32) also as it is trading below 16.94 levels. The bias will remain bearish while it is trading below 17.50 levels though a possibility of a rise towards 17 levels can’t be ruled out due to short term oversold condition.
Copper (2.50) is hovering around its crucial support at 2.50 levels, within its trading range of 2.45-2.54. A close below 2.50, which is less preferred, could open up 2.45 levels as well.
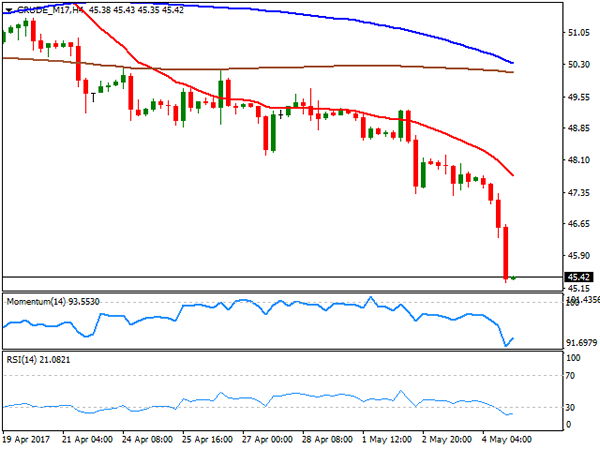
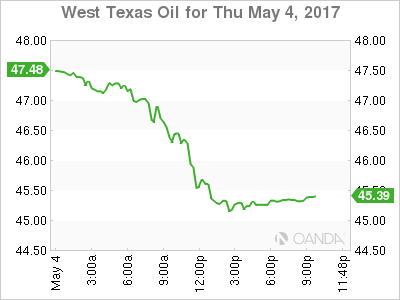
WTI (45.41) had moved lower in line with our expectation and hovering around its support at 45.35 levels. A close below that could open up 44.58 and 41.62 levels respectively. Brent (51.73) may consolidate within 50-52 levels for few more sessions though the possibility of a corrective bounce towards resistance can’t be ruled out. We will remain bearish while Brent and WTI are trading below 53 and 51 levels respectively.
FOREX
Dollar has reversed its gains ahead of the US Jobs data tonight and the second round of French election on Sunday but the major trend is still not clear at the moment. By Monday, clarity can be expected.
Dollar Index (98.82) has lost all its gains made in the previous session after its failure to rise above the resistance of 99.50 we have been watching for the last week. Immediate support comes at 98.50 below which comes the major support of 98.30-20 which may hold on the first testing.
Euro (1.00980) has risen sharply as it tests the resistance zone of 1.0970-1.1000 now. A break above 1.10 may open up much higher levels starting with 1.1100 but we would prefer to wait for the breakout to take place first.
Dollar Yen (112.58) is stalling near the resistance of 113.00 as expected but it is not clear yet if the resistance will be able to reject the price sharply enough to trigger any considerable correction. Wait and watch for another couple of sessions.
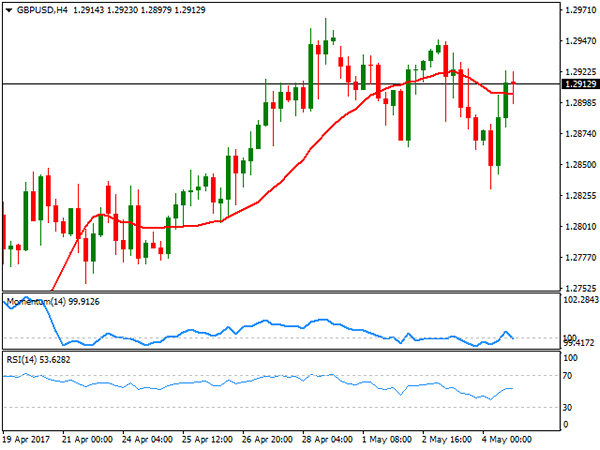
Pound (1.2918) has bounced back exactly from our support of 1.2830 and our immediate target of 1.3000 may be met in the next 1-3 sessions.
The crash in the commodities this week has hit Aussie (0.7388) hard. The currency is testing the support of 0.7380-70 repeatedly for the last 2 sessions which must be protected by the bulls for any immediate chance of recovery. Failure to hold 0.7370 may open up much lower levels of 0.7300 but the chances of a bounce back can’t be fully discarded yet.
It has been one of the quietest days for Dollar Rupee (64.1750) in the recent weeks as it barely moved away from 64.20 in the entire session. On the other hand, this crash in volatility implies a sharp move coming in the next 2-4 sessions and the direction can be down if the pair fails to rise above 64.40 in the meanwhile.
INTEREST RATES
The Japan-US 10Yr (2.34%) is rising as expected and could heads towards 2.4% in the coming sessions. In that case we could expect a rise in Nikkei an d Dollar Yen too in the near term.
The German-US 10Yr (-1.97%) and the 2yr (-2.01%) have bounced from immediate support levels and have decent potential on the upside. While the yield spread looks bullish, Euro could head higher in the near term.
The US and the UK yields are rising and could move up for the next 2-sessions while the Japan yields are almost stable. The German yields have also moved up sharply and are heading immediate resistance levels from where a rejection is possible.
Foreign Exchange Market Commentary: EUR/USD, USD/JPY, GBP/USD, GOLD, WTI CRUDE, DJIA, FTSE100, DAX
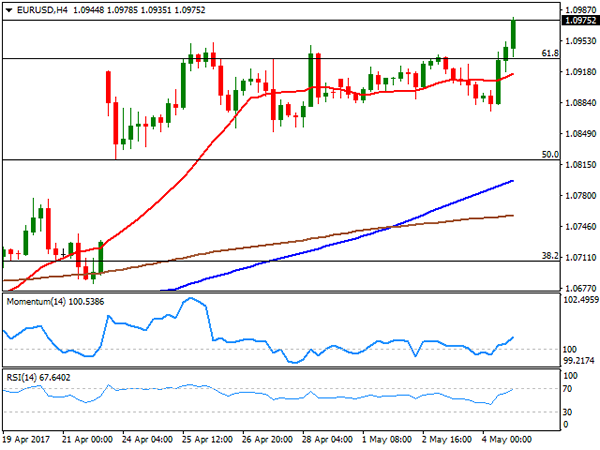
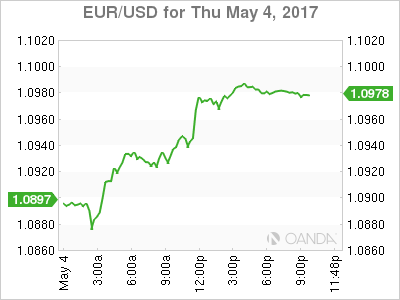
EUR/USD
The EUR/USD pair not only trimmed the late Wednesday shallow FED-triggered losses, but also managed to surge to a fresh 2017 high of 1.0978 in the American afternoon, holding nearby by the end of the end. The American dollar came under pressure early London, following another round of strong European data, as the final Markit services and composite PMIs for the region confirmed growth accelerated to its fastest pace in six-years at the beginning of the second quarter. April EU composite PMI printed 56.4, better than the initial estimate of 56.2, while German reading came at 56.7, also beating preliminary estimates, but below March's peak of 57.1.
European equities rallied, helping Wall Street to open higher, but US stocks were unable to hold on to gains, plummeting alongside with the greenback, despite some positive minor employment reports. Weekly unemployment claims fell by more than expected in the week ending April 29, down to 238K from a previously unrevised 257K. During the first quarter of the year, the Unit labor cost in the country rose by 3.0%, beating expectations, although labor productivity in the nonfarm business sector decrease at an annual rate by 0.6%. The US will release its monthly Nonfarm Payroll report this Friday, although seems it would be able to do little for the greenback, even if the number surprises to the upside, as the Fed has already offered its stance, and is not worried about employment. Another negative surprise, on the other hand, will probably have a major effect on the market, fueling dollar's losses against its high-yielding counterparts.
From a technical point of view, the pair is now bullish, facing an immediate resistance at the 1.1000 psychological level, but given the latest bullish breakout, chances are of another leg higher through it. In the 4 hours chart, the 20 SMA has gained some upward strength far below the current level, whilst technical indicators finally detached from their mid-lines, heading higher within positive territory. Additionally, the pair was trading around 1.1020 ahead of the outcome of the US election last November, which means that if the price manages to settle above it ahead of the weekly close, the pair has scope to extend its rally up to 1.1260 next week.
Support levels:1.0950 1.0900 1.0855
Resistance levels: 1.1000 1.1045 1.1080
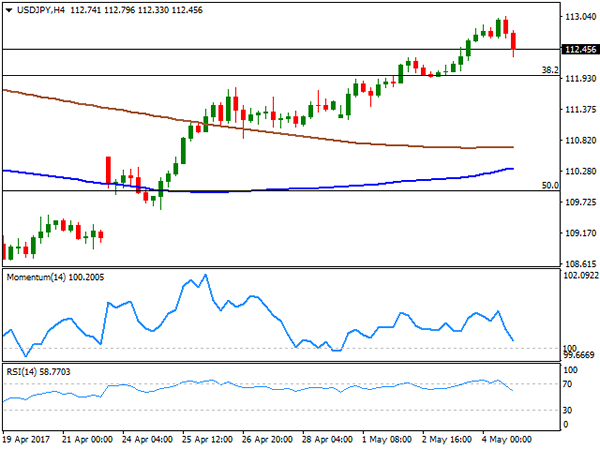
USD/JPY
The USD/JPY pair traded as high as 113.04, level last seen mid March, before turning sharply lower and ending the day in the red around 112.45, as dollar's bulls gave up in the American session. There was not a certain catalyst behind the negative sentiment towards the US currency, although the movement accelerated after the DYX broke below the 99.00 level, not flirting with its weekly lows. US stocks plunged but trimmed half of their daily losses ahead of the close, while US Treasury yields surged to fresh weekly highs, limiting yen's gains. The pair briefly surpassed its 100 DMA but stands now a few pips below it, unable to confirm the break of the critical dynamic resistance, currently at 112.50. In the 4 hours chart, technical indicators have pulled sharply lower from overbought levels, now nearing their mid-lines but still holding within positive territory, whilst the 100 SMA kept advancing far below the current level, and the 200 SMA. The bearish move can extend intraday down to 112.00, without actually affecting the dominant trend, although below this last, the risk turns towards the downside, targeting the 111.20.
Support levels: 112.00 111.60 111.20
Resistance levels: 112.45 112.90 113.30
GBP/USD
The British Pound ended up recovering the 1.2900 level against the greenback, after the pair fell down to a fresh weekly low of 1.2830. The GBP/USD found a reason to recover the upside in the April UK Markit services PMI, as the index surged to a four-month high of 55.8, amid strong demand from overseas that offset local consumer spending, according to the official report. On a down note, mortgage approvals fell to a six-month low in March, down to 66,837 from 67,926 in February, a result of higher inflation. Also, households’ M4 flows softened a little further and were £3.0 billion, while private non-financial corporations’ M4 flows picked up to £3.5 billion, and were above the recent average flows. From a technical point of view, the upward potential seems limited as the pair has set a lower low and a lower high daily basis, although it would take an extension below 1.2770 to confirm a steeper slide in the pair. In the 4 hours chart, the technical outlook remains neutral, with the price still hovering around a horizontal 20 SMA, and indicators unable to move away from their mid-lines.
Support levels: 1.2880 1.2830 1.2795
Resistance levels: 1.2965 1.3010 1.3060
GOLD
Gold prices plunged this Thursday, with spot ending the day at $1,226.50 a troy ounce, in spite of broad dollar's weakness. The commodity fell to its lowest in seven weeks, still undermine by US Federal Reserve upbeat tone late Wednesday, which supported the case for a rate hike in June, and receding political uncertainty in Europe, moreover after French centrist candidate, Emmanuel Macron, was seen as the "most convincing" candidate after the televised debate. From a technical point of view, gold is set to continue falling, given that in the daily chart, it broke below its 100 DMA for the first time since late January, now trading below all of its moving averages, whilst technical indicators maintain strong bearish slopes within negative territory. In the shorter term, and according to the 4 hours chart, the metal is also biased lower, as technical indicators maintain their strong downward momentum, despite being in extreme oversold territory, whilst the 20 SMA turned sharply lower after breaking below the largest ones.
Support levels: 1,225.60 1,214.10 1,203.80
Resistance levels: 1,232.60 1,242.50 1,250.90
WTI CRUDE OIL
Crude oil prices fell to their lowest in six months, with West Texas Intermediate crude futures plummeting almost 5% daily basis to $45.28 a barrel. The slide came after OPEC delegates downplayed chances of a deeper output cut, despite an extension beyond June is still on the table. News that the political tensions are set to decrease in Libya as two of the country's largest fractions made progress towards a deal, fueled the decline as the country's production could rise to 1.5 million barrels in a few months. The OPEC is meeting by the end of this month in Vienna. After the sharp decline, technical indicators in the daily chart entered oversold territory, maintaining their strong downward slopes at the end of the day, supporting some additional declines ahead. In the 4 hours chart technical indicators have pared losses but remain at oversold levels, whilst the bearish 20 SMA turned sharply lower, now around 47.75. The 45 figure has proved strong in the past, although a break below the level is now possible, with scope then to test the 42.50 region.
Support levels: 47.10 46.60 46.00
Resistance levels: 47.90 48.50 49.20
DJIA
Wall Street closed mixed, but not far away from its opening levels, trimming sharp intraday losses. After starting the session with a strong footing, following the lead of European equities, US stocks plunged, with the DJIA trading almost 100 points lower at one point, to finally settle for the day at 20,951.47, down by 6 points, while the Nasdaq Composite and the S&P posted modest advances, up by 2 and 1 point respectively to 6,075.34 and 2,389.52. Within the DJIA, United Health Group closed the day 0.92%, leading winners list, followed by 3M that added 0.82%. Caterpillar was the worst performer, down by 2.14%, followed by Chevron ad Exxon Mobil, both lower on plunging oil prices. From a technical point of view, the Dow maintains the neutral-to-bullish stance seen on previous updates, although with the downward potential limited, given that in the daily chart, the index presents another doji above all of its moving averages, whilst technical indicators keep consolidating well above their mid-lines, but with no certain directional stance. In the 4 hours chart, the index closed the day around a horizontal 20 SMA, while technical indicators turned flat around their mid-lines, erasing an early intraday spike and still failing to provide directional clues.
Support levels: 20,896 20,845 20,790
Resistance levels: 20,952 21,013 21,071
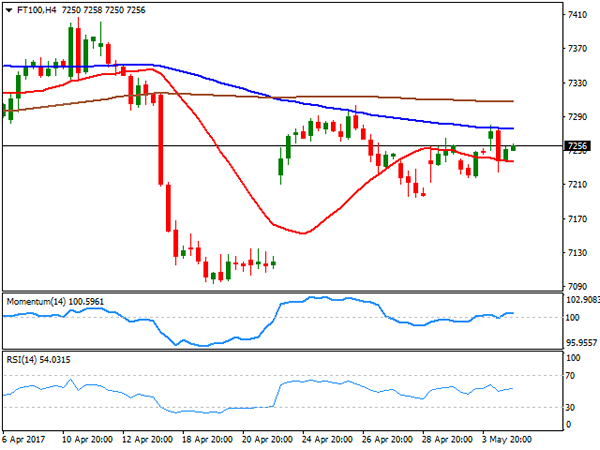
FTSE100
The FTSE 100 posted a modest advance this Thursday, adding 12 points or 0.19% to close at 7,248.10. A strong Pound offset positive earnings reports, limiting gains in local shares. Among major movers was HSBC that reported a 19% fall in first-quarter profits, less than market's forecast, with shares ending 2.88% higher. International Consolidate Airlines Group led advancers with a 2.97% gain, while fashion retailer Next was the worst performer, down by 5.1% after reporting falling sales and trimming the top end of its full-year profit forecast. Mining-related equities were under pressure, with Antofagasta shedding 4.69% and Anglo American down by 4.69%. The daily chart shows that the benchmark settled around a bearish 20 SMA, whilst technical indicators remain within bearish territory and lean modestly towards the downside, limiting chances of a steeper recovery. In the 4 hours chart, the technical outlook for the index is neutral, given that its currently developing between flat 20 and 100 SMAs, whilst technical indicators aim marginally higher within neutral territory, in line with the longer term perspective.
Support levels:7,215 7,173 7,126
Resistance levels: 7,303 7,340 7,384
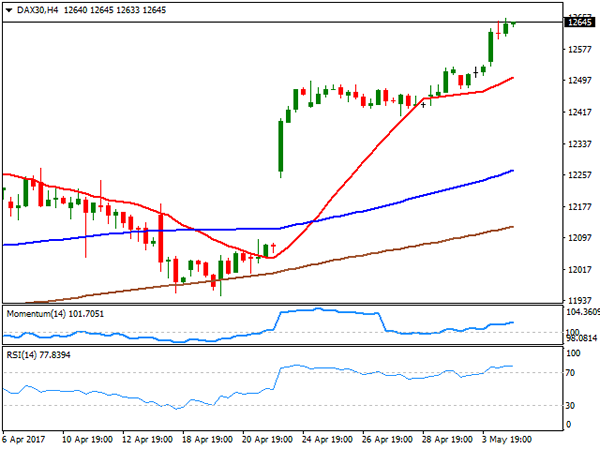
DAX
The German DAX reached an all-time high this Thursday, ending the day 121 points higher at 12,647.78, backed by strong earnings reports all through the region, and a continued improvement in market's mood ahead of the final round of French presidential election next Sunday. Within the German benchmark, Commerzbank was the best performer, adding 2.83%, followed by Deutsche Post that closed 1.98% higher. Only five members closed down, led by Infineon Technologies that shed 2.18%. The daily chart for the benchmark supports a continued advance as technical indicators resumed their advances, with the RSI currently at 73 and moving averages gaining upward strength far below the current level. In the shorter term, and according to the 4 hours chart, the technical picture is also bullish, with technical indicators slowly regaining the upside after a period of consolidation within overbought readings.
Support levels: 12,629 12,583 12,530
Resistance levels: 12,656 12,690 12,730
EUR/USD Triangle Breakout
After EUR/USD Gapped up when Macron won the first round of French Presidential Elections, price consolidated into the following triangle:
EUR/USD Daily:
Now, as we head into NFP day, the Euro has rallied out of it.
The overnight US reports including Unemployment claims, showed a greater than expected fall (238K vs 244K). Factory Orders also gained less than market consensus (+0.2% vs +0.4%) to put a damper on the US Dollar. With the market expectation for NFP being a 194K rise, this can be seen as the market positioning itself early as traders get nervous about those high expectations being met.
Just remember that while NFP is big as always, it’s still all about the French Election and I’ve marked the EUR/USD chart as to the obvious fallout if things go to plan.
A Cocktail Of Concerns
A Cocktail of Concerns
Despite all the market-friendly US political headlines hitting the wires early in Asia, the collapse in oil prices saw WTI plunge as the market continues to probe for a bottom amid oversupply concerns is taking center stage
Besides the obvious momentum play that is unfolding from a technical perspective, the slide exacerbated when OPEC members made light of the chance of expanding production cuts at the May 25 open summit. With open interest topping near record highs, WTI plummeted from $47.60 region to near $45.20 alarmingly close to the core psychologically $45.00 level which if broken could send the oil pits into complete disarray and will likely have far-reaching consequences for both equity and currency markets near term.
Oil's slide overnight has driven energy sector stocks lower, over 2% weighing on the broader Indices. And the USD moved lower on risk aversion play (JPY) but gained on Petro currencies.This morning's focus has shifted to the negative commodity narrative from the positive FOMC dynamic.
On the political front, the passage of President Trump's healthcare reform was met with little market fanfare as dealers now await the knock down drag ‘em out battle that will likely unfold as the bill moves to the Senate for approval.
Australian Dollar
AUD hit its lowest level against USD in four months as China commodity prices nosedived. Demand concerns from the Mainland are melting with supply concerns from Australia.
With Mainland interest rates rising and a June US rate hike all but inked, investor sentiment is turning soggy as there's a chance that policy tightening in the world's two largest economies could lead to a slowdown in global growth.
China's liquidity drain to subdue financial risk has seen its short-term interest rates move to a two-year high. With a weak manufacturing PMI, followed by April's service sector growth coming in at its slowest in nearly a year; 51.2 , China's growth concerns amidst rising domestic interest rates is worrying. This toxic combination of higher rates amidst slower growth is clearly weighing on China's commodity market sentiment.
Also, China's crackdown on leverage in the attempt to deflate the financial risk bubble is also weighing on futures and other financial product as investors are forced to pair back positions for fear of regulatory reprisal. The knock-on effect has seen China's financial markets buckle as the dealers and banks scramble for funds.,
On the domestic front, Australia's trade data was also soft: The country's surplus for March has been reduced to AUD3.11bn, from AUD3.66bn in February which just compounded matters.
While the Aussie remains stubbornly supported above .7400 on little more than a wing and a prayer, let's see if this morning's RBA Monetary Policy Statement provides that much needed divine intervention.
In early AUD trade there's apprehension to drive the Aussie much lower ahead of NFP, but with what's transpiring in the commodity markets, it's hard not to remain bearish on the Aussie and the commodity bloc in general.
Japanese Yen
Despite rising US yields, USDJPY could not make steam above the critical top or drop 113.00 level. Heading into tonight's NFP and Fed speaks with oil prices weighing on risk sentiment, dealers better lighten long dollar inventory. While a Fed flip flop is very unlikely, there is a cocktail of concerns entering tonight's payrolls data where the headline will be noted, but expected to be strong after last month's massive disappointment. However, dealers are very much keying on the hourly wage growth in the Friday report which has remained stubbornly stagnant
Bear in mind; the USDJPY is the most correlated currency pairs linked to Treasury 10y yields, so on a bullish NFP outcome and mildly hawkish delivery from Yellen; the USDJPY will likely push through 113.00.
Euro
Now with the cantankerous French election debate out of the way and the odds widening for a Macron win, we're beginning to see some event preposition, but the catalyst came from the most unlikely place.The Italian services PMI, generally an insipid data print, came in well above expectations and fired the Euro bulls into action. The market view is still higher EU yields higher, and higher EURO scenario provided no weekend surprise. And with equity inflow already surging into in EU capital markets, the Euro should pop higher next week.
Dollar Gains Against Commodity Currencies Ahead Of NFP
Oil price hits 2017 lows dragging petrocurrencies down
The US dollar is mixed against major pairs awaiting the release of the U.S. non farm payrolls (NFP) on Friday, May 5 at 8:30 am EDT. The US is expected to have added 190,000 jobs in April with a slight rise of the unemployment rate to 4.6 percent. The bad weather in March was responsible for a drop in the pace of job growth with only 98,000 jobs added. The ADP private payrolls report on Wednesday, showed a healthy increase of 177,000 new positions and the weekly unemployment claims came in lower than expected on Thursday at 238,000. Employment has been the strongest pillar of the economic recovery in the US and if it manages to continue to add jobs at a steady pace the Fed will keep the June rate hike on the table boosting the USD.
The French presidential election is heading to the second round vote scheduled for Sunday. The televised debate between the two candidates Emmanuel Macron and Marine Le Pen was a lively affair, where both managed to score points but in the end it is the centrist Mr. Macron who continues to hold a considerable lead ahead of the final vote but the lessons of the Brexit referendum and the US election should not be ignored.
The EUR/USD gained 0.561 percent in the Thursday session. The single pair is trading at 1.0969, the highest level this year as the lower threat of Frexit after the French debate last night and mixed US economic data in first quarter has the EUR appreciating versus the greenback.
The EUR has advanced despite the U.S. Federal Reserve still keeping the June rate hike option. The European Central Bank (ECB) will continue to diverge from the Fed by keeping its bond buying program in place until the signs of recovery are solid enough. In contrast the US central bank has called the softness of the first quarter as transitory and will look to data for an improvement that shows the economy is turning the corner that could come as early as this Friday with the release of the NFP report.
Oil lost 4.524 percent in the last 24 hours. The price of West Texas is trading at $45.25 a price level similar to that before the OPEC agreed to its production cut. The lack of gasoline demand ahead of driving season in the United States has raised anxiety about the global supply glut of crude and distillates even as the OPEC and other major producers have agreed to cut supply.
US shale producers have ramped up production taking advantage of the price stability of the OPEC deal and forcing the organization into extending the original six month period. The OPEC and other producers will meet on May 25 to discuss the extension.
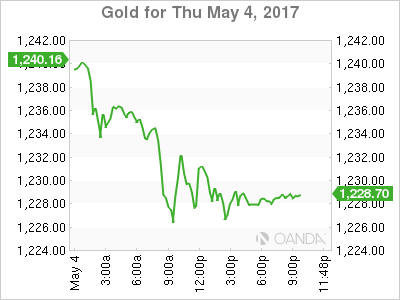
Gold lost 1.655 percent in the Thursday session. The yellow metal is trading at $1,228.17 headed towards the worst level of 2017 after the U.S. Federal Reserve kept rates unchanged but kept market optimism about a rate hike in June and the GOP was able to pass the vote on health care reform through the House of representatives. The Jobs report on Friday could prove to boost the USD against the metal if warmer weather translated into higher job gains than expected. With lower political risk and higher interest rate forecasts the metal continues trending down.
The French elections will take place on Friday but political risk has been reduced after Macron did well in the debate and is extending his lead to above 60 percent.
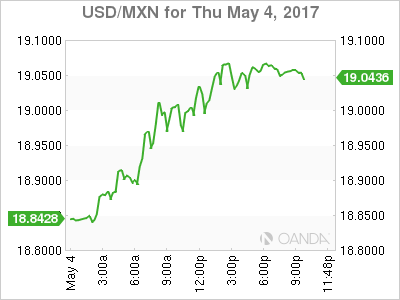
The USD/MXN gained 1.311 percent in the last 24 hours. The pair is trading at 19.0545 after the oil drop has dragged the peso lower. Mexican trade data released today showed that the pressure from Donald Trump that drove the currency lower helped exports that recorded an all time high with a 14% gain over last quarter. The Trump administration could use the data to argue for an uneven trade relationship with Mexico when it renegotiates the NAFTA agreement.
The drop in commodity prices also hurt the peso after the currency had recovered in 2017 after enduring the ire of candidate and eventual US President Trump.
Market events to watch this week:
Friday. May 5
8:30am CAD Employment Change
8:30am USD Average Hourly Earnings m/m
8:30am USD Non-Farm Employment Change
Reflation Flop
A rout in commodities threatens to derail the reflation theme that dominated early 2017 trading .The euro was the top performer Thursday while the Australian dollar lagged. A number of charts broke out. As we near Sunday's final round in the French Elections, the existing EUR trade shall remain open ahead, alongside another EUR trade to be opened on Friday after the US jobs report.
Oil and iron ore were hardest hit in a broad commodity rout on Thursday. Crude finished down nearly 5% and Dalian exchange ore was halted limit down after a 7.3% drop. It didn't stop there with wheat, copper and gold among many raw materials that were hit hard.
The Australian dollar fell to the lowest since January 10 and USD/CAD hit a 14-month high. For USD/CAD, it was the 10th consecutive day of gains.
Aside from terms of trade from exporters, the drop in commodities threatens to undermine the idea that 2017 is the return to the old normal. Oil is back to where it was before the OPEC cut despite the strongest signals yet that an extension is coming. The weakness will be a drag on fuel costs and inflation.
A divide in central banking that doesn't get much attention could be characterized as the Fed-bloc against the ECB-bloc. The Fed believes that inflation early this year was due to economic tightness and that it's sustainable, if not accelerating. The ECB believes it's temporary because of baseline effects from the early-2016 commodity price crunch.
The debate will take time to settle but either way the falls in commodity prices will sap the urgency from the hawks. In the meantime, the US dollar has the most to lose. By embracing reflation, the Fed (and the US dollar) have the most to lose if it fails.
Economic news on Thursday included a disappointing factory orders report but better revisions to durable goods orders and shipments. It also included a narrower US trade deficit, low jobless claims and House Republicans narrowly voting for healthcare reform in what is the first real step towards repealing and replacing Obamacare.
The big story in markets was on the charts. EUR/USD broke the April high and is now testing 1.1000. Oil broke the March low and crashed below. Gold hit the lowest since March 20. AUD and NZD fell below the recent lows. USD/JPY hit the highest since March 16 before reversing to finish lower. That ended a 5-day winning streak.
Asia-Pacific traders will have a chance to digest it all with a light calendar before US nonfarm payrolls and Canadian employment later. One highlight on the calendar is the quarter RBA statement and that could offer some insight on where they see rates headed next.
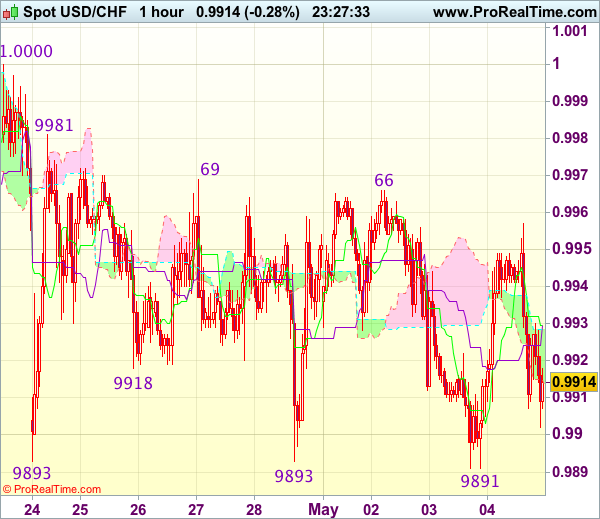
Trade Idea Wrap-up: USD/CHF – Stand aside
USD/CHF - 0.9910
Most recent candlesticks pattern : N/A
Trend : Near term down
Tenkan-Sen level : 0.9930
Kijun-Sen level : 0.9930
Ichimoku cloud top : 0.9929
Ichimoku cloud bottom : 0.9915
New strategy :
Stand aside
Position : -
Target : -
Stop : -
Despite yesterday’s brief fall to 0.9891, lack of follow through selling on break of previous support at 0.9893 and the subsequent rebound has retained our view that further consolidation is in store and test of 0.9966-69 resistance cannot be ruled out, however, a break of 0.9981 is needed to signal low is formed, bring a stronger rebound to 1.0000-08 resistance, above there would confirm a temporary low has been formed at 0.9891, bring retracement of recent decline to 1.0020-30 (61.8% Fibonacci retracement of 1.0108-0.9891) but price should falter well below resistance at 1.0067.
On the downside, below 0.9905-10 would bring retest of 0.9891 but break there is needed to confirm recent decline from 1.0108 top has resumed and extend weakness to 0.9865-70 (2 times extension of 1.0108-1.0008 measuring from 1.0067), however, support at 0.9831 would hold from here, bring rebound later. As near term outlook is still mixed, would be prudent to stand aside for now.
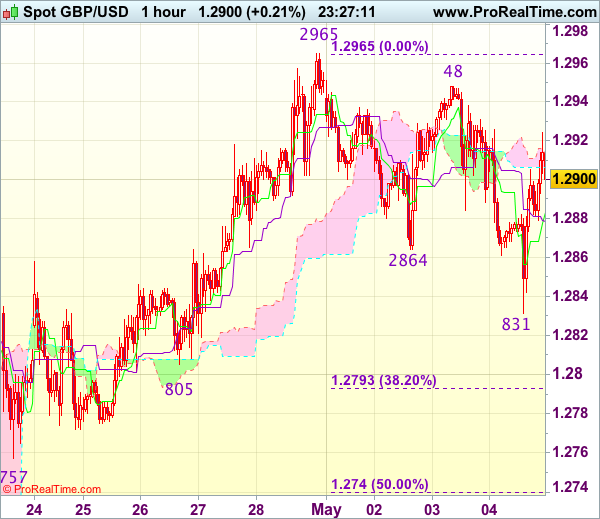
Trade Idea Wrap-up: GBP/USD – Buy at 1.2790
GBP/USD - 1.2908
Most recent candlesticks pattern : N/A
Trend : Near term up
Tenkan-Sen level : 1.2883
Kijun-Sen level : 1.2879
Ichimoku cloud top : 1.2914
Ichimoku cloud bottom : 1.2906
Original strategy :
Buy at 1.2790, Target: 1.2910, Stop: 1.2755
Position : -
Target : -
Stop : -
New strategy :
Buy at 1.2790, Target: 1.2910, Stop: 1.2755
Position : -
Target : -
Stop : -
Although cable has rebounded after intra-day brief fall to 1.2831, reckon upside would be limited to 1.2925-30 and near term downside risk remains for the corrective fall from 1.2965 to bring retracement of recent upmove, below said support at 1.2831 would extend weakness to 1.2790-95 (38.2% Fibonacci retracement of 1.2515-1.2965) where renewed buying interest should emerge, bring another rise later. Above 1.2948 would bring retest of 1.2965, break there would confirm upmove has resumed for headway towards 1.2990-00 (1.236 times projection of 1.2109-1.2616 measuring from 1.2365 and psychological resistance).
In view of this, would not chase this rise here and would be prudent to buy cable on further subsequent pullback as downside should be limited to 1.2790-95. A drop below previous support at 1.2757 would abort and signal top is formed instead, bring correction to 1.2740 (50% Fibonacci retracement of 1.2515-1.2965) first.
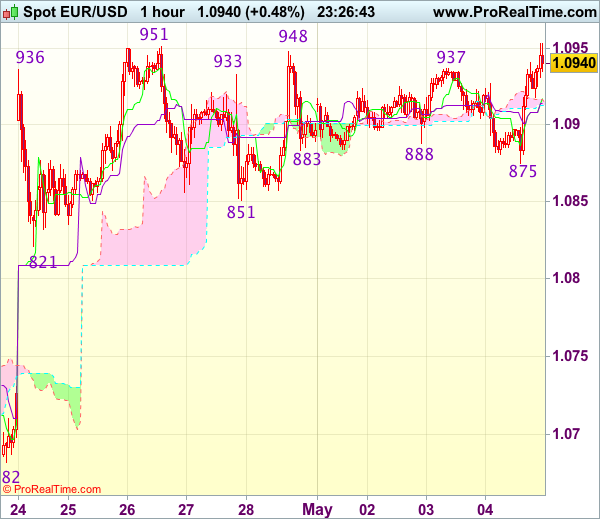
Trade Idea Wrap-up: EUR/USD – Buy at 1.0900
EUR/USD - 1.0940
Most recent candlesticks pattern : N/A
Trend : Near term up
Tenkan-Sen level : 1.0917
Kijun-Sen level : 1.0914
Ichimoku cloud top : 1.0917
Ichimoku cloud bottom : 1.0913
Original strategy :
Buy at 1.0900, Target: 1.1000, Stop: 1.0870
Position : -
Target : -
Stop : -
New strategy :
Buy at 1.0900, Target: 1.1000, Stop: 1.0870
Position : -
Target : -
Stop : -
Although the single currency fell briefly to 1.0875, lack of follow through selling and current rebound suggest consolidation with upside bias would be seen and test of indicated resistance at 1.0951 (last week’s high) would be seen, however, a firm break above there is needed to signal recent upmove from 1.0340 low has resumed for headway to 1.0975-80 and possibly towards 1.1000 but price should falter below 1.1025 (50% projection of 1.0602-1.0951 measuring from 1.0851).
In view of this, we are looking to buy euro on dips. Below intra-day support at 1.0875 would prolong consolidation below said resistance at 1.0951, bring correction towards support at 1.0851 but price should stay above 1.0821 support, bring another rise later.