
Sample Category Title
USD/CAD Candlesticks and Ichimoku Analysis
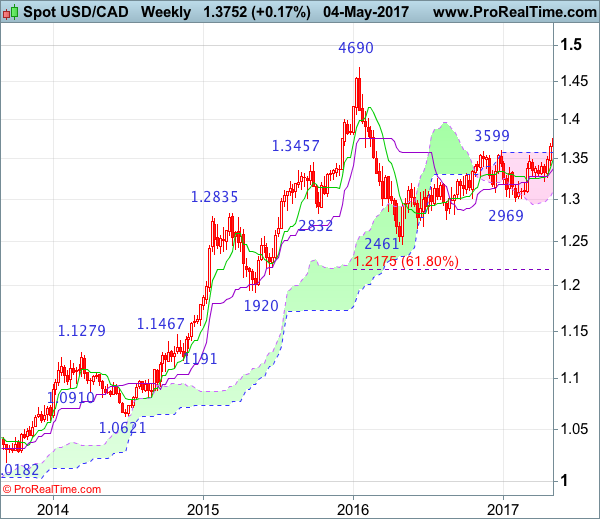
Weekly
• Last Candlesticks pattern: Bullish engulfing
• Time of formation: 02 May 2016
• Trend bias: Up
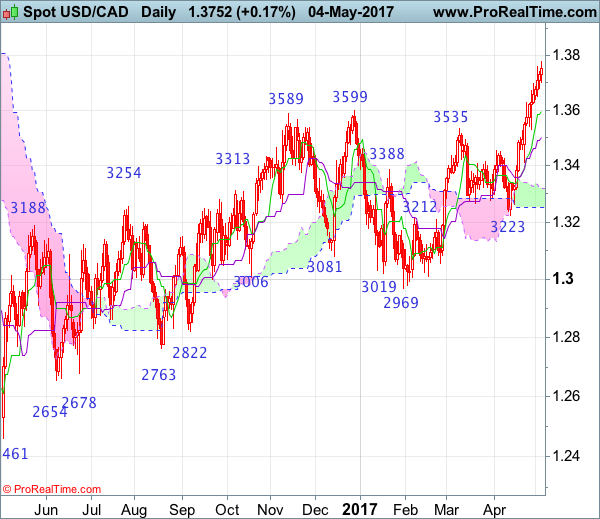
Daily
• Last Candlesticks pattern: Hammer
• Time of formation: 19 Oct 2016
• Trend bias: Up
USD/CAD – 1.3788
The greenback has surged again after breaking above indicated previous resistance at 1.3599, adding credence to our bullish view that early erratic upmove from 1.2461 low has resumed and upside bias remains for this move to extend further gain to 1.3835-40 (61.8% Fibonacci retracement of 1.4690-1.2461) and possibly towards 1.3900-10, however, near term overbought condition should prevent sharp move beyond 1.3950 and price should falter below psychological resistance at 1.4000, risk from there is seen for a retreat later.
On the downside, whilst initial pullback to 1.3700-10 cannot be ruled out, reckon the Tenkan-Sen (now at 1.3662) would limit downside and bring another rise later to aforesaid upside targets. Below support at 1.3530 would defer and suggest top is possibly but only a daily close below the Kijun-Sen (now at 1.3509) would add credence to this view, bring retracement of recent upmove to 1.3450-55 and then towards support at 1.3411 which is likely to hold from here and bring rebound.
Recommendation: Buy at 1.3650 for 1.3850 with stop below 1.3550.
On the weekly chart, as the greenback has rallied again after last week’s upmove above previous resistance at 1.3599, another white candlestick looks set to be formed this week, adding credence to our bullish view that the erratic upmove from 1.2461 (2016 low) is still in progress and bullishness remains for this move to extend headway to 1.3835-40 (61.8% Fibonacci retracement of 1.4690-1.2461) and then 1.3900 but overbought condition should prevent sharp move beyond psychological resistance at 1.4000, risk from there has increased for a retreat to take place.
On the downside, although initial pullback to 1.3700-10 cannot be ruled out, reckon downside would be limited to previous resistance at 1.3599 (now support) and bring another rise later. Only below the Tenkan-Sen (now at 1.3509) would defer and suggest top is possibly formed, risk weakness to 1.3450, then test of support at 1.3411 but reckon the Kijun-Sen (now at 1.3382) would limit downside and bring another rise later. In the event the pair drops below the Kijun-Sen, this would suggest top is formed instead, bring weakness to 1.3300, then 1.3260-65 but reckon support at 1.3223 would remain intact.
Euro Dollar Rally Might Be About To End
Key Points:
- Price action stalls near 1.10 handle.
- RSI Oscillator nears overbought levels.
- Watch for a breakdown towards the 1.07 handle in the coming week.
The Euro bulls have had a highly positive 24 hours as the currency has rallied strongly in response to falling political risk and a buoyant retail sales result. In particular, the latest French election poll seems to show Macron widening the gap against LePen and this has been seen as a positive development. Subsequently, the pair has rallied sharply to the top of the equidistant channel but some interesting technical analysis is suggesting that we might be on the way to a pull back.
In particular, price action's recent rally has seen it establish itself at a key junction where the bearish and bullish trend lines intersect. Therefore, this is a relatively critical juncture and one that is likely to bring about some stalled upward momentum. Additionally, the RSI Oscillator is largely telling the story with the indicator now edging into overbought territory suggesting that a pullback or period of moderation is ahead of us. The ADX is also singing a similar song as the signal line has now reached a key reversal level and is also signalling a pullback ahead.
Subsequently, there are plenty of reasons to suspect a technical correction in the coming session, not least of all the fact that price is now at an extreme and a mean reversion should be in play. However, there are also some fundamental risk events looming in the coming session which also lends further credence to the downside play. In particular, the U.S. Non-Farm Payroll figures are due out late on Friday and are likely to bring with them plenty of volatility for the Euro. In fact, given the recent upbeat initial jobless claims result, the chance of a strong NFP number, above the 185k estimate, is relatively high. Such a result would see the Euro depreciate against the greenback and send price action back towards the lower channel constraint.
Ultimately, the pair's rally is likely coming to an end with price action entering a key reversal zone and the RSI Oscillator indicating overbought levels. Subsequently, the most likely scenario is where price action breaks down, towards the lower channel line at the 1.07 handle, following a failure to break through the 1.10 level. Subsequently, keep a close watch on the pair as a decline through support at 1.0871 will likely signal the start of a new bearish leg.
Losses For The Cable Looking Likely As Technicals Deteriorate
Key Points:
- Downside risks are increasing as resistance refuses to yield.
- Technical bias is becoming bearish despite the recent rally.
- Losses could extend as far as the 1.2667 mark.
The Cable has been running into some stiff resistance over the past week and it looks as though it can’t quite muster the momentum to breakout to the upside. What’s more, the pair’s fundamentals have been rather mixed which makes establishing a firm bias somewhat difficult. Due to this, we may have to rely on the technicals to get a feel for what could be on the way in the days to come.
First and foremost, we can’t ignore the presence of the bullish channel that has been making itself felt over the past few months. Specifically, the current position of the Cable relative to the upside of the channel will be generating some notable selling pressure as it is fast becoming apparent that the bulls don’t have the juice to breakout into the 1.30 – 1.35 band.
However, this structure isn’t the only thing likely to be weighing on the GBP as a number of instruments are also signalling that support is evaporating. For instance, the stochastics are undoubtedly in overbought territory which will surely be gearing the bears up for a comeback. Furthermore, the MACD oscillator is mid-signal line crossover which typically denotes a shift in trend direction.
If we do see the Cable make an about face and move into decline once again, we currently expect to see it fall back to around the 1.2667 handle. Here, support should prove to be rather robust as the 38.2% Fibonacci level and the 100 day EMA should work in concert to limit losses substantially. Also worth mentioning, this price coincides with a reoccurring reversal point which can only add to overall support around this level.
Ultimately, whilst we have taken a fairly technical view, don’t ignore the fundamentals entirely as they could still generate some intra-day volatility or muddle the decent back to support. This being said, both US and UK figures have been rather mixed recently which could mean they largely offset one another, leaving the pair especially open to technical influence.
Oil Collapses In Asia As Commodity Rout Continues
Global commodities are routed overnight as China growth jitters and the spectre of higher U.S. rates saw long-term bullish positioning being pushed off the cliff. Oil, in particular, having fallen 5% overnight, has collapsed another 2% in Asian trading.
OIL
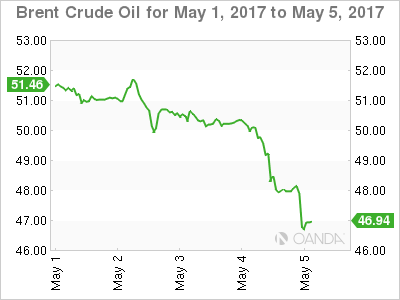
There was no light at the end of the tunnel for OPEC and Non-OPEC producers overnight, in fact, the light turned out to be the train coming the other way, as both Brent and WTI crashed just shy of 5 % in North American trade. As previously highlighted, OPEC has been looking down the barrel so to speak, of resurgent supply from Nigeria and Libya amongst OPEC and of course, American shale which combined have completely offset the 1.8 million barrel per day production cut agreement.
With commodities collapsing on China growth wobbles and the prospect of higher U.S. interest rates back on the table, it is evident that many long-term structural longs threw in the towel and headed for the door en masse overnight. OPEC will be faced with some stark choices going forward as the global supply glut clearly isn’t going to roll over and die anytime soon. The potential deflationary shock will be felt in the halls of power in Japan and Europe as well, where officials will be fretting about the collapse in oil and commodities undermining their inflation targeting.
Back to the here and now, we are in somewhat uncharted territory technically on both Brent and WTI, with both tanking in Asia by around 2% as I write. The move looks suspiciously stop loss driven as the overnight lows are taken out.
Brent spot opened at 48.10 this morning with resistance at 50.40 and 51.00. Support was at the overnight low at 47.80, but with this now well and truly gone there is nothing but clear air until 45.50 from a chart perspective.
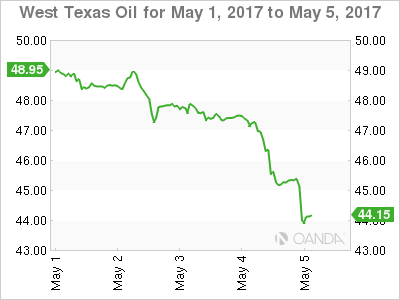
WTI spot opened at 45.30 but has collapsed 2% as I write. Resistance at 47.00 and 48.00 seem to be distant memories now as upport initially at the overnight low at 45.10 and then 44.40 breaks. opening up a possible move to 42.00.
From a technical perspective, the break of 44.40 now opens up the possibility of a move to the 42.00 region.
PRECIOUS METALS
GOLD
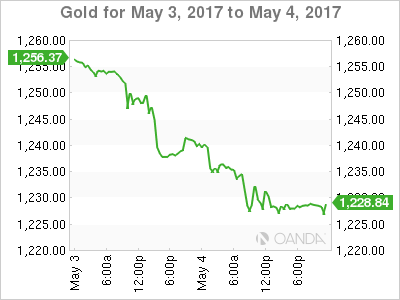
The reverse alchemy in the precious metals markets continued overnight, as they looked more leaden than golden with gold itself off another 1% in New York trade. To be fair, this wasn’t a bad result given the general carnage seen in the commodity space overall. Potential China growth wobbles and the uncomfortable reality of higher U.S. interest rates being put back on the table by this week’s FOMC sees the safe haven unwind in gold continue to gather momentum.
The recent day’s price action could be implying that there are a lot of structural longs in gold that had been put on in the last months, at what are not very unattractive levels. Suggesting that, like crude oil, overnight, there may be more pain ahead.
Gold trades at 1228.30 in early Asia having fallen to 1225.50 overnight and this represents initial intra-day support. Key support lies just below at 1221.00 the 100-day moving average, with a close under there suggesting a move to the 1195/1200 region.
Resistance is at 1240 initially, the breakdown level and now a major daily pivot point. Above here the 200-day moving average at 1251.75 and the 1260 form resistance.
RBA Upbeat On Long-Term Outlook, Warns That Low Wages A Risk To The Economy
For the 24 hours to 23:00 GMT, the AUD declined 0.24% against the USD and closed at 0.7408.
LME Copper prices declined 1.7% or $93.5/MT to $5543.0/MT. Aluminium prices declined 0.3% or $6.5/MT to $1909.5/MT.
In the Asian session, at GMT0300, the pair is trading at 0.739, with the AUD trading 0.24% lower against the USD from yesterday's close.
Earlier in the session, the Reserve Bank of Australia (RBA), in its quarterly statement on monetary policy, forecasted that Australian economy would grow between 2.75% to 3.75% in 2018, up from its previous prediction of 2.5% to 3.5%. The central bank further warned that slow wage growth looks set to continue for Australian workers and remains a potential drag on the economy and that it had no plan to shift the cash rate from a record low of 1.5% for the rest of 2017.
Overnight data indicated that Australia's AIG performance of construction index advanced to a level of 51.9 in April, after registering a reading of 51.2 in the previous month.
The pair is expected to find support at 0.7371, and a fall through could take it to the next support level of 0.7352. The pair is expected to find its first resistance at 0.7417, and a rise through could take it to the next resistance level of 0.7444.
Moving ahead, Australia's building approvals, NAB business confidence, retail sales and Westpac consumer confidence data, all slated to release next week, will be on investors radar.
The currency pair is trading below its 20 Hr and 50 Hr moving averages

Euro-Zone’s Services Sector Expanded To A 6-Year High Level In April
For the 24 hours to 23:00 GMT, the EUR rose 0.84% against the USD and closed at 1.0980, amid expectations that the centrist candidate, Emmanuel Macron, will win the second and final round of French presidential election, scheduled on Sunday.
Euro added to gains following the release of upbeat services sector data in the Euro-zone. The final Markit services PMI in the Euro-zone was revised higher to a level of 56.4 in April, from a flash estimate of 56.2, maintaining its six-year high level, thus indicating that the regional economy is off to a strong start in the second quarter. The PMI had recorded a level of 56.0 in the previous month. Additionally, the region's seasonally adjusted retail sales advanced more-than-expected by 0.3% MoM in March, compared to a revised rise of 0.5% in the previous month, while markets expected for a gain of 0.1%.
Separately, growth in Germany's services sector fell less than initially estimated to a level of 55.4 in April, compared to a drop to a level of 54.7 registered in the preliminary print. In the previous month, the PMI had recorded a reading of 55.6.
Macroeconomic data released in the US showed that the number of Americans filing for fresh jobless claims fell to a three-week low level of 238.0K in the week ended 29 April 2017 and higher than market consensus for a drop to a level of 248.0K. In the previous week, initial jobless claims had recorded a level of 257.0K. Additionally, the nation's trade deficit surprisingly narrowed to a level of $43.7 billion in March, compared to a revised deficit of $43.8 billion in the prior month, while market participants had envisaged the nation's deficit to widen to a level of $44.5 billion. Moreover, the nation's factory orders rose less-than-anticipated by 0.2% MoM in March, compared to a revised rise of 1.2% in the prior month. Markets were anticipating factory orders to rise 0.4%. Further, the nation's final durable goods orders climbed 0.9% in March, advancing for the third consecutive month, compared to a revised rise of 2.3% in the prior month. The preliminary figures had indicated a rise of 0.7%.
In the Asian session, at GMT0300, the pair is trading at 1.0976, with the EUR trading slightly lower against the USD from yesterday's close.
The pair is expected to find support at 1.0903, and a fall through could take it to the next support level of 1.0830. The pair is expected to find its first resistance at 1.1019, and a rise through could take it to the next resistance level of 1.1062.
Going ahead, market participants await the release of the European Commission's economic growth forecasts report along with Germany's construction PMI data for April, slated to release in a few hours. Additionally, in the US, crucial non-farm payrolls and unemployment report, both for April, slated to release later in the day, will garner significant amount of market attention.
The currency pair is trading/showing convergence with its 20 Hr and 50 Hr moving average.
UK’s Services Sector Unexpectedly Expanded To A 4-Month High Level In April
For the 24 hours to 23:00 GMT, the GBP rose 0.41% against the USD and closed at 1.2921, after data showed a robust performance in UK's services sector.
UK's Markit services PMI unexpectedly advanced to a four-month high level of 55.8 in April, suggesting that the economy is regaining momentum after a lacklustre performance in first quarter. The PMI had registered a level of 55.0 in the prior month, whereas markets expected for a fall to a level of 54.5.
Moreover, the nation's net consumer credit advanced £1.6 billion in March, surpassing market consensus for a rise of £1.2 billion. In the prior month, net consumer credit had climbed by a revised £1.5 billion.
On the other hand, the nation's number of mortgage approvals for house purchases declined more-than-anticipated to a level of 66.8K in March, hitting its lowest level in six months. In the prior month, mortgage approvals had recorded a revised level of 67.9K.
In the Asian session, at GMT0300, the pair is trading at 1.2913, with the GBP trading 0.06% lower against the USD from yesterday's close.
The pair is expected to find support at 1.2851, and a fall through could take it to the next support level of 1.2790. The pair is expected to find its first resistance at 1.2952, and a rise through could take it to the next resistance level of 1.2992.
With no economic releases in UK today, market participants will anxiously await BoE's interest rate decision, scheduled next week. Also, investors will look forward to Britain's industrial and manufacturing production along with the nation's construction output, NIESR GDP estimate and trade balance data, all set to release next week.
The currency pair is showing convergence with its 20 Hr moving average and trading above its 50 Hr moving average.

Japanese Yen Trading A Tad Lower In The Morning Session
For the 24 hours to 23:00 GMT, the USD declined 0.16% against the JPY and closed at 112.50.
In the Asian session, at GMT0300, the pair is trading at 112.56, with the USD trading marginally higher against the JPY from yesterday’s close.
The pair is expected to find support at 112.22, and a fall through could take it to the next support level of 111.88. The pair is expected to find its first resistance at 112.97, and a rise through could take it to the next resistance level of 113.38.
Amid a public holiday in Japan today, trading trend in the JPY is expected to be determined by global macroeconomic events.
The currency pair is trading between its 20 Hr and 50 Hr moving averages.

Swiss SECO Consumer Sentiment Surprisingly Fell In April
For the 24 hours to 23:00 GMT, the USD declined 0.83% against the CHF and closed at 0.9859.
In economic news, Switzerland’s SECO consumer confidence index unexpectedly fell to a level of -8.0 in April, compared to a reading of -3.0 in January. Markets expected the index to climb to a level of 3.0.
In the Asian session, at GMT0300, the pair is trading at 0.9864, with the USD trading a tad higher against the CHF from yesterday’s close.
The pair is expected to find support at 0.9828, and a fall through could take it to the next support level of 0.9792. The pair is expected to find its first resistance at 0.9928, and a rise through could take it to the next resistance level of 0.9992.
Next week, market participants will closely monitor Switzerland’s unemployment rate and consumer price inflation data.
The currency pair is trading below its 20 Hr and 50 Hr moving averages.

Canada’s Trade Deficit Sharply Narrowed In March
For the 24 hours to 23:00 GMT, the USD rose 0.16% against the CAD and closed at 1.3751.
On the macro front, Canada's international merchandise trade deficit narrowed more-than-anticipated to a level C$0.14 billion in March, amid a rise in exports. Markets expected the nation's international merchandise trade deficit to narrow to a level of C$1.0 billion, following a revised deficit of C$1.1 billion in the previous month.
In the Asian session, at GMT0300, the pair is trading at 1.3770, with the USD trading 0.14% higher against the CAD from yesterday's close.
The pair is expected to find support at 1.3720, and a fall through could take it to the next support level of 1.3670. The pair is expected to find its first resistance at 1.3797, and a rise through could take it to the next resistance level of 1.3824.
Ahead in the day, traders will focus on Canada's unemployment rate data for April, to gauge strength in the nation's labour market.
The currency pair is trading above its 20 Hr and 50 Hr moving averages.
