
Sample Category Title
EUR/GBP Daily Outlook
Daily Pivots: (S1) 0.8469; (P) 0.8485; (R1) 0.8514; More...
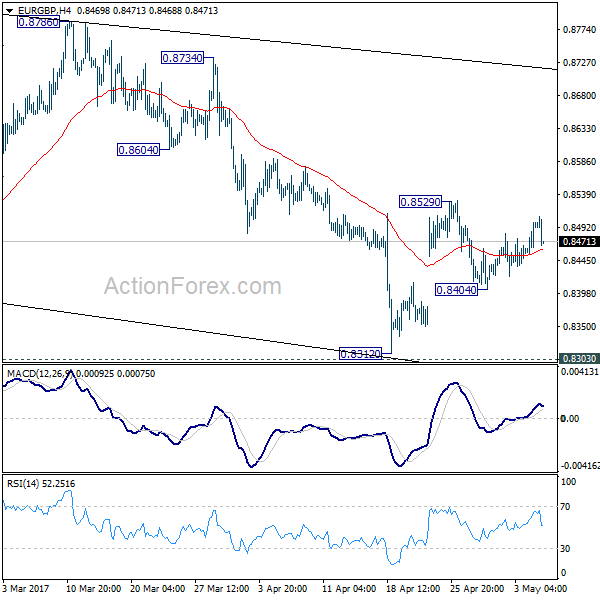
EUR/GBP is staying in range of 0.8404/0.8529 and intraday bias remains neutral. On the downside, below 0.8404 will turn focus back to 0.8303 low. Break there will extend the whole corrective pattern from 0.9304. On the upside, above 0.8529 will resume the rebound from 0.8312 towards 0.8786 resistance. Overall, price actions form 0.9304 are seen as a corrective pattern and is extending.
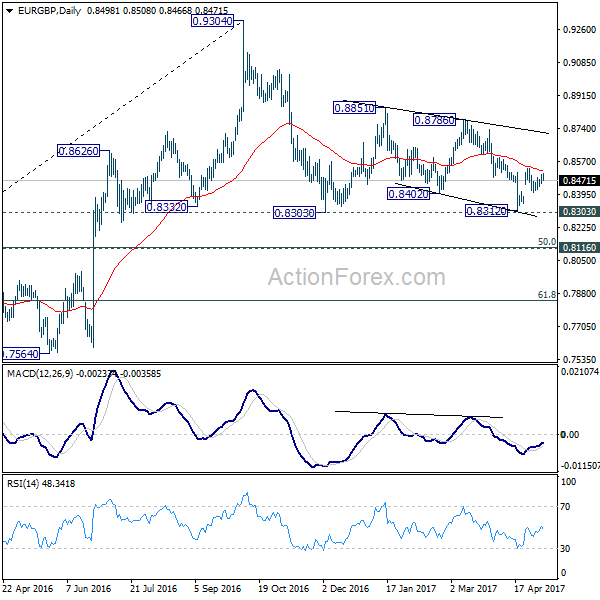
In the bigger picture, price actions from 0.9304 are viewed as a medium term corrective pattern. In case of deeper fall, we'd expect strong support from 0.8116 cluster support (50% retracement of 0.6935 to 0.9304 at 0.8120) to contain downside. Rise from 0.6935 (2015 low) will resume at a later stage to 0.9799 (2008 high). However, sustained break of 0.8116 could bring deeper decline to next key support level at 0.7564 before the correction completes.
GBP/USD Analysis: Opens Lacking Direction
'The rapid deterioration in the UK's economic momentum has largely gone unnoticed by an FX market preoccupied with political distractions.' – GJanes Rossiter (Based on Pound Sterling Live)
Pair's Outlook
GBP/USD opened red on the daily chart Thursday morning, setting a downside target at 1.2829 in sight. The area is represented by the daily S1 and is most likely to be up for solid tests today. Because of the proximity to the area, the cross might lack general volatility today in order to respect the area. In case of severe downside volatility around 15:30 GMT when the US unemployment claims data comes out, 1.2762 might be the level more likely to cut the movement with more demand at 1.2729. Upside risks are currently limited to 1.2898.
Traders' Sentiment
There are 49% of traders holding short positions today (previously 50%), whereas 57% of all pending orders are to acquire the Pound.
USD/JPY Analysis: Kicks Off To The Downside
'The dollar fell 0.3 percent against the yen to 112.19, pulling away from a seven-week high of 113.045 yen set on Thursday. ' – Masayuki Kitano (Based on Reuters)
Pair's Outlook
A confirmation of the previously established bounce off the senior channel down pattern on the daily chart came on Friday morning as the pair continued its way towards areas below further away from any upside risks. The pair is now likely to eye the support at 111.82 as a decent target, as it has already penetrated the 112.35 area which was the immediate support amid opening. Upside risks are currently limited to 112.84 where the upper trend-line of the channel is strengthened by the monthly R1.
Traders' Sentiment
Market sentiment has entered bearish territory as 58% of all open positions are short and the remaining 42% are long. At the same time, the number of orders to buy the Buck slipped from 48% to 42%.
Gold Analysis: Reaches 1,230 Mark
'There is no doubt that gold is going through a soft patch right now, but it is approaching good support between $1,190 and $1,200.' – Edward Meir, INTL FCStone (based on Reuters)
Pair's Outlook
On Friday morning the yellow metal was in a period of consolidation, which was expected after the losses, which were suffered during the two previous trading sessions. On Thursday the bullion almost touched the 1,225 mark before it suddenly rebounded. The previous forecast of the metal reaching for the combined support of the 100-day SMA at 1,223.79, 38.20% Fibonacci retracement level at 1,219.20 and the monthly S2 at 1,218.01 remains in force. The main fundamental reason for that would be the fact that during the weekend the French election final results will come in, and with it uncertainty will be gone.
Traders' Sentiment
Traders are neutral bearish, as 52% of open positions are short. However, 64% of trader set up orders are to buy.
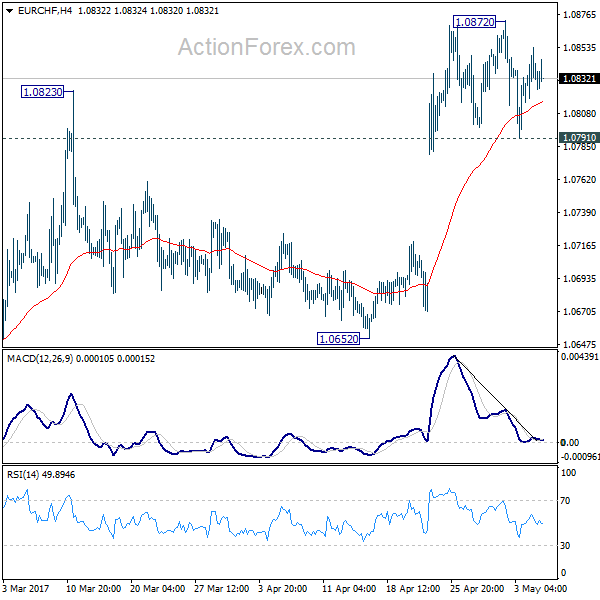
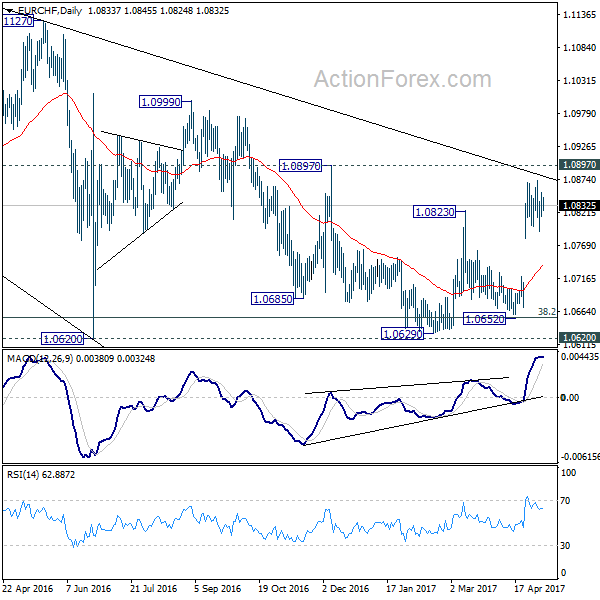
EUR/CHF Daily Outlook
Daily Pivots: (S1) 1.0815; (P) 1.0834; (R1) 1.0852; More...
Intraday bias in EUR/CHF remains neutral for the moment. Further rise is expected with 1.0791 support intact. Above 1.0872 will target 1.0897 resistance. Decisive break there should confirm our bullish view of reversal and will target 1.0999 resistance next Nonetheless, break of 1.0798 support will indicate short term topping and turn focus back to 55 day EMA (now at 1.0738).
In the bigger picture, the price actions from 1.1198 are seen as a corrective move. Current strong rebound is raising the chance that it's completed after defending 38.2% retracement of 0.9771 to 1.1198 at 1.0653. Decisive break of 1.0999 resistance will target a test on 1.1198 high. For now, this will be the preferred case as long as 1.0652 support holds.
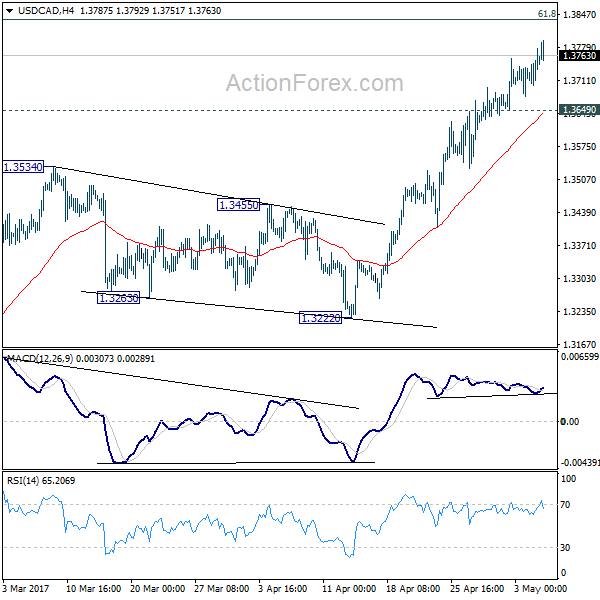
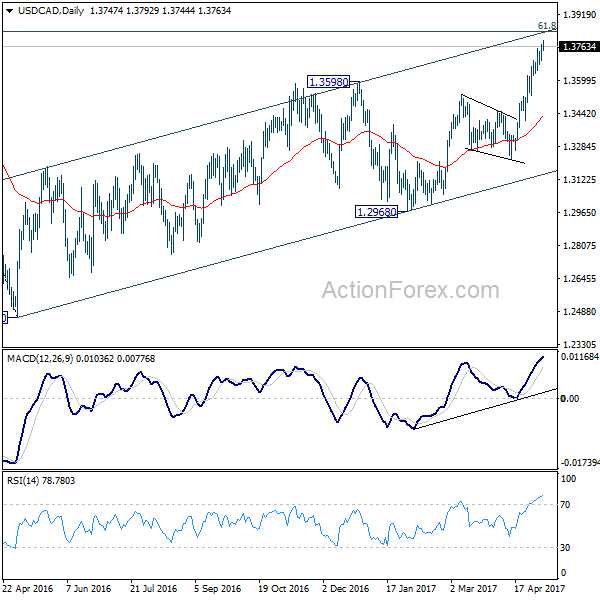
USD/CAD Daily Outlook
Daily Pivots: (S1) 1.3693; (P) 1.3716; (R1) 1.3754; More....
Intraday bias in USD/CAD remains on the upside for medium term fibonacci level at 1.3838 ahead. Whole rise from 1.2460 is seen as a corrective move. Hence, we'll be cautious on topping around 1.3838 to bring reversal. On the downside, break of 1.3649 support will now be the first signal of topping and will turn bias the downside for 1.3534 resistance turned support.
In the bigger picture, price actions from 1.4689 medium term top are seen as a correction pattern. The first leg has completed at 1.2460. The second leg from 1.2460 is likely still in progress and could target 61.8% retracement of 1.4689 to 1.2460 at 1.3838. We'd look for reversal signal there to start the third leg. However, break of 1.3222 support will argue that the third leg has already started and should at least bring a retest of 1.2460 low. Meanwhile, sustained trading above 1.3838 would pave the way to retest 1.4689 high.
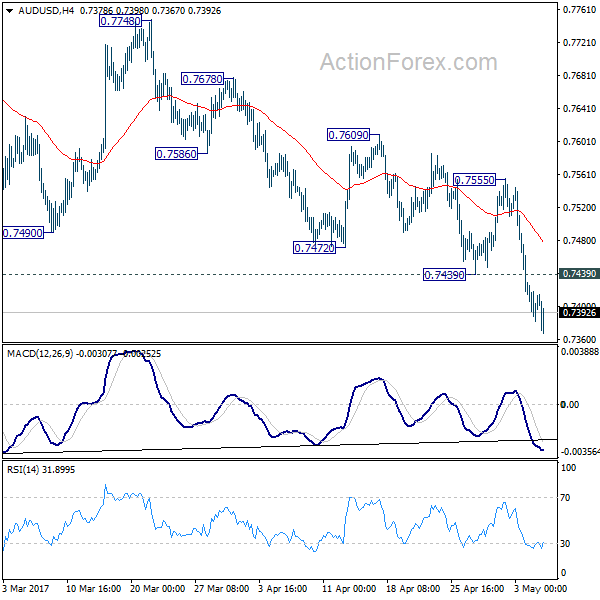
AUD/USD Daily Outlook
Daily Pivots: (S1) 0.7384; (P) 0.7407; (R1) 0.7432; More...
AUD/USD's fall is still in progress and intraday bias remains on the downside. Current fall from 0.7748 should target 0.7144/7158 support zone. At this point, there is no clear sign of larger down trend resumption yet. Hence, we'll be cautious on strong support from 0.7144/58 to contain downside and bring rebound. On the upside, above 0.7439 support turned resistance will turn bias neutral and bring consolidation first. But upside of recovery should be limited below 0.7555 and bring another fall.
In the bigger picture, we're still treating price actions from 0.6826 low as a correction pattern. And, as long as 38.2% retracement of 0.9504 to 0.6826 at 0.7849 holds, long term down trend from 1.1079 is expected to resume sooner or later. Break of 0.6826 low will target 0.6008 key support level. However, firm break of 0.7849 will indicate that rise from 0.6826 is developing into a medium term rebound, rather than a sideway pattern. In such case, stronger rise should be seen to 55 month EMA (now at 0.8118) and above.
Euro At 6-Month High As Markets Eye Macron Victory
The euro has inched lower on Friday, after gaining close to 1 percent in the Thursday session. Currently, EUR/USD is trading at 1.0970. On the release front, there was just one event out of the eurozone. Retail PMI improved to 52.7, its highest level since July 2015. In the US, the focus is on employment numbers, with the release of three key indicators – nonfarm payrolls, wage growth and the unemployment rate. Nonfarm payrolls dropped to just 98 thousand in March, but is expected to rebound to 194 thousand in the April report. The markets will be looking for some clues about monetary policy, as Fed Chair Yellen and FOMC members Fischer and Yellen will deliver speeches during the day.
With just two days remaining before the French presidential election, opinion polls continue to point to a decisive victory for centrist Emmanuel Macron over far-right candidate Marine Le Pen. The two squared off in a testy television debate on Wednesday, with Macron widely considered to have won the debate. Throughout the week, polls have shown Macron holding comfortable lead of 20 points over Le Pen, and the euro climbed to 6-month highs on Thursday, as the markets are clearly confident that the polls are on track and that Macron will win. Still, many voters don’t like either candidate and remain undecided, which means that the polls may not be as accurate as they were in the first round. If Le Pen loses but does much better than predicted, we could see the euro lose ground.
The polling average line looks at the five most recent national polls and takes the median value, ie, the value between the two figures that are higher and two figures that are lower.
Source – BBC
French Election Timeline
May 3 – TV debate between the two remaining candidates
May 5 – [from midnight] Poll blackout
May 7 – Second round of French presidential elections. Last polls close at 19:00 BST / 14:00 EDT, with an exit poll result announced immediately.
May 11 – Official proclamation of the new President.
May 14 – [from midnight] End of Francois Hollande’s mandate
June 11 – First round of legislative elections
June 18 – Second round of legislative elections.
President Donald Trump won a crucial victory on Thursday, as the House of Representatives narrowly passed a bill to repeal and replace the Affordable Health Care Act, known as Obamacare. Earlier this year, the House failed to even vote on a new bill, which was seen as a blow to Trump. However, Trump’s declaration of victory may be premature, as the bill will face a tough battle in the Senate, which is likely to make significant changes to the legislation. What is significant is that Trump finally won a major legislative win, which could give him some much-needed momentum as he tackles other major issues such as fiscal spending and tax reform.
Republican Healthcare Bill Passes the House Headed for Senate
As expected, the Federal Reserve stayed on the sidelines on Wednesday, holding the benchmark rate at 0.75 percent. The Fed rate statement was hawkish, as policymakers emphasized the positives and downplayed a soft first quarter. The statement noted that consumer spending remains strong and that inflation was “running close” to the Fed’s 2 percent target. The Fed’s message is clearly one of optimism, as the central bank remains on track to raise interest rates twice more in 2017. The Fed’s bullish statement immediately raised the likelihood of a rate hike at June meeting, which jumped to 74 percent after the statement, up from 63% before meeting. The Fed has two key goals which have been achieved, namely full employment and an inflation rate of 2%. One area of concern is the balance sheet, which stands at $4.5 trillion. The minutes of the March meeting stated that policymakers want to start reducing this figure before the end of 2017, and we could see another reference to the balance sheet in the April minutes.
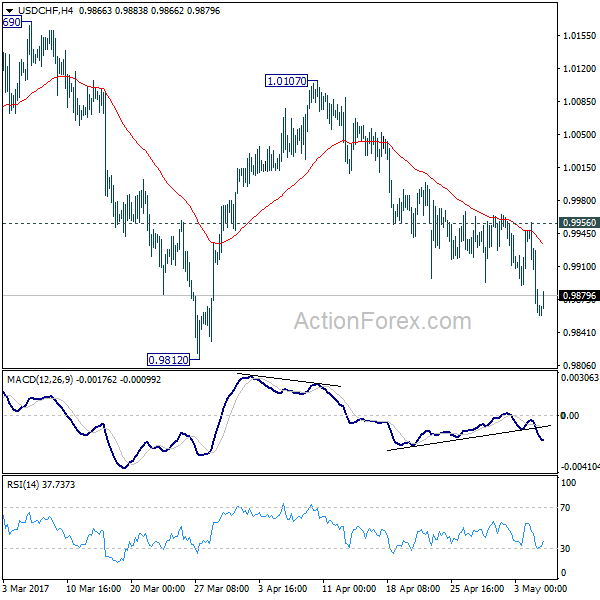
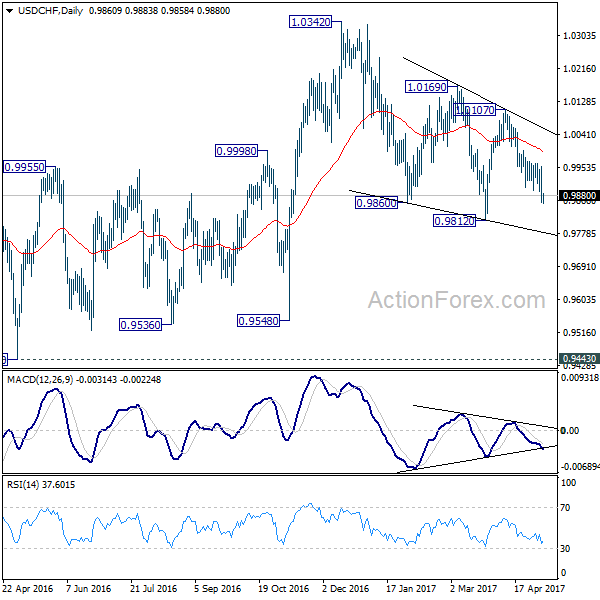
USD/CHF Daily Outlook
Daily Pivots: (S1) 0.9830; (P) 0.9894; (R1) 0.9925; More.....
USD/CHF's resumed by takin gout 0.9890 and reaches as low as 0.9858 so far. Intraday bias is back on the downside for 0.9812 and below. Note again that price actions from 1.0342 are seen as a correction. Break of 0.9812 should be brief and we will look for bottoming signal below there. On the upside, break of 0.9956 resistance will suggest that fall from 1.0107 is completed and turn bias back to the upside for this resistance.
In the bigger picture, we're still maintaining that firm break of 1.0342 key resistance is needed to confirm underlying bullish momentum in the pair. However, the corrective nature of the fall from 1.0342 is starting to give the medium term outlook a bullish favor. Hence, in stead of looking for topping signal around 1.0342, we'd now pay closer attention to upside acceleration as USD/CHF approaches this level again.
Markets Await French Election Result
The second-round of the French presidential election will be held this Sunday May 7.
Per the latest IFOP (French Institute of Public Opinion) projections; Macron has 60.93% share of votes whereas Le Pen has 39.07%. Macron inherited 43% of Fillion's, 70% of Hamon's and 50% of Melenchon's voters. Le Pen inherited 31% of Fillion's, 3% of Hamon's and 12% of Melenchon's voters.
EUR has strengthened as markets expect Macron to win the final vote. This is based on Macron's large lead of at least 20 points in the major polls after the first round of the election.
During the early European session today EUR/USD hit a high of 1.0989, last seen November 9 of 2016 and EUR/JPY hit a high of 123.66, last seen on January 9. On Thursday, the France's CAC 40 index hit a 2-week high of 5384.96. The DAX index also hit a record high of 12657.16
During a TV debate on May 3, Le Pen condemned Macron's policies with a lack of national security enhancement. He is regarded as being soft toward Islamic terrorism and beholden to large business interests. She claims that she will expel foreigners on a terrorist watch list.
If Macron wins, it will likely push EUR and European stocks further up. Conversely, if Le Pen wins, it will trigger risk-off sentiment and market concerns over the collapse of the EU, which will result in a slump in EUR and European stocks, causing a rebound in gold and silver prices.
Be aware that, the result will likely cause big volatility in the market. Market prices will likely open with slippages, which will result in stop losses being triggered with market prices instead of pre-set prices during early Asian session on Monday May 8.
The crucial US labour market data for April will be released this afternoon, at 13:30 BST. It includes non-farm payrolls, unemployment rate and average hourly earnings. Please note that the release of US labour market data will likely cause volatility for USD, USD crosses and commodities.