
Sample Category Title
AUD In The Doldrums As Commodities Slide
- Long EM Asia - Peter Rosenstreich
- AUD In The Doldrums As Commodities Slide - Arnaud Masset
- Markets Are Very Confident About A Fed Rate Hike In June - Yann Quelenn
- Weed
Economics - Long EM Asia
Asia emerging markets asset have been benefiting from continual improvement of risk appetite and solid external and domestic fundamental data. Last week marginal correct was due to uncertainty around the French elections, weaknesses in commodity prices as China further tightening financial conditions. In addition the specter of seasonal selling in May weigh on investors mind. However, we suspect these issues are transitional and should fade in investors' minds as conditions stabilize favorably. EM Asia should return to positive performance especially against the JPY which is challenged to hold investors' attention as US interest rate rise.
KRW has borne the brunt of much external noise selling. Rising tension with North Korea, political scandal, fear of restrict trade policy, worries that relative growth rates would decline sent KRW lower. On 9th May South Korea is scheduled to holds its Presidential elections. Since there is no transition between governments, this will lower the current period of political uncertainty. The polls indicate that Moon Jae-in would bring the liberal party back into power after 10 years. A smooth political process will help regain confidence and support KRW moving forward.
Indonesia GDP growth improved marginally in 1Q 2017 rising to 5.01% y/y from 4.9% in 4Q, yet the read was slightly weaker than expected (5.1%). Despite solid export performance and government consumption growth remains sluggish. However, Bank of Indonesia provided some hawkish commentary, the outlook for tighter monetary policy seem unlikely. We anticipate the BI will continue to focus on supporting growth, capping inflations and managing IDR volatility.
While we don't expected any proactive hikes, as growth remains suboptimal (yet sudden pickup could easily trigger a reexamination of this view), the threat of higher interest rate should provide IDR with additional fundamentals support.
Finally, in the Philippines headline inflations rise 3.4% in April (in-line with Bangko Sentrals current 2017 forecasts). Food inflations remained elevated at 4-2% from 4.0% in March. We remain focused on the potential upside in inflations especially form government promoted tax reforms. With growth and inflation trending positively we could see the BSP starting increase rates before EM Asia hiking cycle really kicks off. A strong reason to position yourself long PHP.
Economics - AUD In The Doldrums As Commodities Slide
The Australian dollar has been, by far, the worst performer last week among the G10 complex. The Aussie collapsed to 0.7368 against the greenback, the lowest level since January 11th. The free-fall of the Aussie is due to the combination of several factors ranging from disappointing economic data, central bank announcement to falling commodity prices.
Last Tuesday, the Reserve Bank of Australia held unchanged the official cash rate target at record low 1.50%. The decision was broadly anticipated by market participants. Therefore they focused on the tone of the statement as they tried to get some hint about the institution's next move. The tone was slightly more positive than a month ago as Governor Lowe highlighted the positive trend in employment growth. However, the central bank reiterated its cautious stance as core inflation is still running low and has shown little sign of improvement recently: core gauge printed at 1.5% y/y versus 1.3% in the previous quarter, while headline inflation reached 2.1% y/y compared to 1.5% in the previous quarter. All in all, the RBA wants to avoid as much as possible to appear hawkish - mostly to prevent a sharp appreciation of the Aussie - even though it cannot turn a blind eye to the recent improvements, even minor ones
Secondly, the broad debasement of commodity prices - mostly crude oil and iron ore prices - weighted on exporters such as Australia. This move has to be seen within the context of tightening financial conditions in China amid a tougher bond market regulation. In China, the price of iron ore fell 14% over the last five days, amid concerns over weak demand. Iron ore futures for delivery in September on the Dalian Commodity Exchange ended the week at CNY 461.5 a metric ton.
Finally, the market is heavily positioned on the bullish side as net noncommercial positioning, reported by the CFTC, stands at around 39% of total open interest (as of April 25th). An unwinding of those long positions - which already started - may accelerated the Aussie's debasement. AUD/USD has already broke all of its short-term supports as the market is trying to determine a bottom in the currency pair. The next key support can be found at 0.7145 (low from May 24th last year).
Title - Markets Are Confident About A Fed Rate Hike In June
The FOMC meeting was clearly the key FX event last Wednesday. The market got it right and priced in a no-rate hike. Markets already feel more confident for a rate increase at the next meeting in June. Markets' estimates are around 100% at the moment. When looking carefully at the Fed meeting statement, we can notice that the US central bank is worried about the slowing in growth but believe it is going to be transitory.
If we assess more closely the data of the US economy, the jobs report were, in average, much better. Last Friday's NFP printed above the consensus (211k vs 190k). It is nonetheless important to notice that March figure has been revised down to 79k from 98k. Other recent data were lacklustre (GDP and personal consumption in particular). The inflation target of 2% was beaten in February before falling again below this level. In March, industrial production also saw its biggest decline for the last two years.
We remain suspicious on Fed rate path tightening for this year as we believe that the state the US economy is overestimated. A few elements allow us to say so. For example, the number of bankruptcies in the US in 2017 is already higher than all bankruptcies in 2016. On top of that, the second-hand car market is collapsing as the losses on auto credit subprime have reached their highest level. Last but not least, 60% of Americans - according to a CNN poll - do not have a $500 emergency fund.
Out of this is why we maintain our bullish position on the EURUSD, despite political uncertainties in Europe. This should continue in our view as the Trump's spending plans, tax reforms are going to cost a lot and the Federal government current interest payments have never been so high. Above 508 billion dollars for the first quarter of the year.
Themes Trading - Weed
Marijuana
Yes, we all know the jokes, but marijuana is big business in North America. US comedian Jimmy Kimmel stated that Colorado's new state slogan is "Come for the legal marijuana, stay because you forgot to leave."
The North American market for weed is estimated to have grown to $53 billion in 2016. This includes legal recreational use, medical markets and the illegal trade. The legal North American marijuana market generated 2016 revenues of $6.9 billion, 34% higher than the 2015 total, largely as a result of explosive growth in adult consumer sales. There are currently 26 states plus the District of Columbia with laws broadly legalizing marijuana in some form (8 with legalization for recreational use), together with other states preparing to introduce legislation permitting marijuana use.
As of now, under federal law cannabis remains a controlled substance and illegal. For the time being, companies whose business is marijuana must obtain individual state licenses to operate and sell. This makes the evolution from small to medium-sized company and then national brand, which is critical for public listing, a challenge. However, there is a growing group of small cap stocks that have led the charge in this booming industry. To build a comprehensive, diversified portfolio, we have added cannabis producers and growers as well as biotechnology companies that have high profit potential (no pun intended) thanks to the legalization of marijuana. Please note that many of these stocks are high-risk and should be traded with caution due to illiquidity, low stock prices and a history of sharp reactions to news.
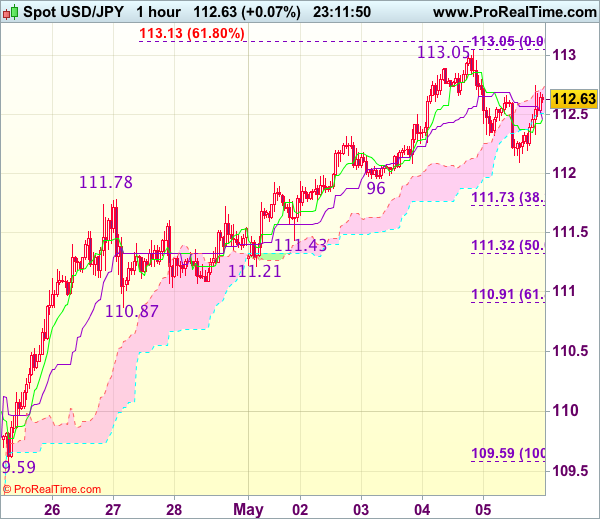
Trade Idea Wrap-up: USD/JPY – Stand aside
USD/JPY - 112.68
Most recent candlesticks pattern : N/A
Trend : Near term up
Tenkan-Sen level : 112.46
Kijun-Sen level : 112.46
Ichimoku cloud top : 112.71
Ichimoku cloud bottom : 112.51
New strategy :
Stand aside
Position : -
Target : -
Stop : -
Although the greenback has rebounded after finding support at 112.09 and gain towards 112.90-00 cannot be ruled out, break of yesterday’s high at 113.05 is needed to confirm recent upmove has resumed and extend gain to 113.10-15 (61.8% projection of 108.13-111.78 measuring from 110.87) but reckon upside would be limited to previous resistance at 113.54 and price should falter well below 113.90-00.
In view of this, would not chase this rise here and would be prudent to stand aside for now. Below 112.09 support would bring test of 111.96 but break of this level is needed to signal a temporary top has been formed at 113.05, bring correction to 111.73-78 (38.2% Fibonacci retracement of 109.59-113.05 and previous resistance), however, reckon 111.21-32 (previous support and 50% Fibonacci retracement) would contain weakness.
Second Round of French Elections, BoE & RBNZ Meetings, Key Data in Focus
Next week's market movers
- In France, voters will head to the polls once again. Macron is widely anticipated to win and as such, we think that the risks surrounding the euro's reaction from this event are asymmetrical.
- The Bank of England is likely to stand pat. We see the case for officials to shift to a somewhat more concerned tone than previously following the latest slowdown in economic growth.
- In New Zealand, we expect the RBNZ to stay on hold as well, and could even keep the door for further easing open, despite the latest improvement in economic data.
- We also get key economic data from the US and China.
Important events begin early next week. On Sunday, French citizens will head to the polls for the second and final round of their Presidential election. The two candidates are Emmanuel Macron and Marine Le Pen. Given the massive market reaction after the first round, when both the euro and European stock indices surged, we think that much of the "Frexit" risk has been already priced out of European assets. This is evident by the narrowing spread between the yields of French and German 10-year bonds. As such, we view the risks surrounding the euro's reaction from the second round as asymmetrical, and tilted to the downside. A win by Macron is already largely expected and thus, any further upside in EUR in this case may be relatively modest. On the other hand, a potential Le Pen victory would come as a major surprise for markets, and is likely to lead to significant downside in EUR.
On Monday, during the Asian day, we get China's trade data for April. The forecast is for both exports and imports to have risen again, though at a slower pace than previously. The exports forecast is supported by the nation's official and Caixin manufacturing PMIs for the month, which showed that although new orders from abroad continued to rise, their growth rate slowed. As for imports, the aforementioned surveys support a slowdown here as well. In addition, recent media reports that the nation's iron ore imports slowed notably in April add further validity to this prospect.
On Tuesday, we have no major events or indicators on the economic agenda.
On Wednesday, during the Asian morning, China's PPI and CPI data for April are due out. Expectations are mixed, with the CPI rate anticipated to have risen somewhat, while the PPI rate is forecast to have declined, though such a drop would still leave it at a very elevated level. We see the risks surrounding the CPI forecast as tilted somewhat to the downside, considering that the Caixin manufacturing PMI showed that both input inflation and final product inflation eased to multi-month lows in April.
On Thursday, the RBNZ will announce its rate decision in early Asian time. In the absence of a forecast, we see the case for the officials to take no action again. The Bank kept the door for further easing wide open when it last met, indicating that numerous uncertainties persist, particularly in the global outlook, and that policy may need to adjust accordingly. As for inflation, the RBNZ noted that it expects it to reach the midpoint of the target over the "medium-term". Nevertheless, inflation data for Q1 released shortly after that meeting were particularly strong, showing that CPI inflation is already above the midpoint of that range, and much higher than what the RBNZ expected in its own forecasts. Perhaps more importantly, 2-year inflation expectations rose further, and also lie safely above the midpoint of the range. Meanwhile, the labor market continued to tighten in Q1.
Even though all of these encouraging domestic developments should normally see the RBNZ shift to a somewhat more upbeat tune, we think that any optimistic message will be moderate, trying not to tip the scale too much. The Bank could keep the prospect of further easing on the table, and continue to quote global uncertainties as the reason. Concerns over global trade remain elevated, as we were reminded of recently by the US imposing tariffs on Canada. In addition, we believe that the Bank will not want to risk a speculative surge in NZD by appearing too optimistic, as that could offset some of the economic progress achieved so far.
Later, during the European day, the Bank of England policy decision will be in the spotlight. This will be a "Super Thursday" meeting, meaning that besides the rate announcement and meeting minutes, we will also get the quarterly Inflation Report with updated economic forecasts for the UK economy. Governor Carney will present the report at a press conference after the gathering. The BoE added a hawkish touch the last time it met. Kristin Forbes dissented the decision to remain on hold, favoring an immediate rate hike instead. On top of that, the meeting minutes showed that "some members" would consider a reduction in monetary stimulus, should there be any further upside news on the prospects for growth or inflation. Since that gathering, data on these two fronts have been mixed. The core CPI rate rose further, but GDP growth slowed notably in the first quarter of the year.
Therefore, the Bank now has a choice to make. Maintain the hawkish touch it added last time and attribute it to rising inflation, or shift to a more cautious stance and place more emphasis on supporting economic activity. We believe that the Bank is likely to choose the second path, which is in line with its view that above-target inflation entirely reflects the drop in sterling and is thus transitory. As such, even though Forbes could be the lone dissenter again, we think that the overall tone of the Committee may be somewhat more concerned than previously.
On Friday, we get US retail sales and CPI data, both for April. Kicking off with retail sales, both the headline and core rates are expected to have risen notably in monthly terms. Following two consecutive months of soft prints, we think that a rebound would be encouraging news for FOMC policymakers, who at their latest policy gathering noted they expect GDP growth to pick up speed in Q2. Strong retail sales could be a sign the US economy entered Q2 on a solid footing, and may thereby amplify speculation regarding a June rate hike even more.
As for the CPI data, no forecast is available. Our own view is that both the headline and the core rates may have remained unchanged, with risks skewed to the downside. We base that view on the nation's Markit services PMIs for the month. Even though the manufacturing index showed that manufacturers raised the prices of final products at the fastest pace for almost two-and-a-half years, the report of the service sector, which accounts for a far larger percentage of the economy, indicated that providers raised their own charges at the slowest rate for five months.
What to Expect From Sunday’s French Election
As the French once again head to the voting booths this Sunday to cast their vote in the second and final round of the French elections, investors appear to be in a cautiously optimistic mood despite there being the potential for chaos when the market reopens next week.
The first round of voting on 23 April saw two very different candidates progress to the second round to stake their claim for the Presidency, Emmanuel Macron and Marine Le Pen. The former - a centre ground pro-European who last year established his own party En Marche! (On the Move) - represents a more business friendly version of the status quo while the latter - a right wing eurosceptic who wants to pull France out of the eurozone - is generally viewed with fear by markets in a similar way that Brexit was. The reason for this is quite clear, Brexit was a very undesirable event for the European Union, Frexit could be the end of it, or so many people believe.
Markets appear quite relaxed about the election, why is this?
I wouldn't say they are relaxed but under the circumstances, they don't appear particularly concerned about the vote and I think there is a number of reasons for this.
1. The polls
The polls haven't been overly reliable in recent years - UK 2015 election, EU referendum, US Presidential election - which has led people to doubt the accuracy of them. Still, even with this larger than normal margin for error, Macron has had a 24 point lead over Le Pen for some time and should this be overturned, it would undoubtedly be the greatest shock of them all.
Source - BBC
The polling average line looks at the five most recent national polls and takes the median value, ie, the value between the two figures that are higher and two figures that are lower.
2. First round
For a long time, Le Pen was leading in the polls and even then, Macron was seen as the runaway favourite in the second round. As election day neared, her lead slipped and Macron crept into the lead before taking 24.01% of the vote to Le Pen's 21.3%. If the majority of those who voted for the fallen candidates were already expected to vote Macron or abstain, this result doesn't bode well for Le Pen.
Source - BBC
3. TV Debate
This was seen as Marine Le Pen's time to shine, an opportunity to capitalise on her political experience, expose Macron's weaknesses and appeal to the roughly 17% of still undecided voters. Success here may have closed the gap and given Le Pen some momentum in the final days leading up to the vote. Instead, polls conducted after the event suggested it was the inexperienced Macron that stole the show and by a relatively large margin, not too dissimilar to that which the polls suggest we'll see on Sunday.
4. Referendum
Unlike the EU referendum in the UK, a Le Pen victory would take France closer to the exit door but not yet through it. Le Pen has vowed to hold a referendum on its membership of the eurozone and it's far from clear that the country would vote to leave.
What can we expect on Sunday?
Scenario 1: Macron Victory
As I stated earlier, investors appear cautiously optimistic about this outcome and as a result, I don't believe there is much risk premium being priced into the markets. That in itself shouldn't be taken as a sign of voting intentions though, as we learned on 23 June last year (Brexit). The euro is trading at a six month high against the dollar, the CAC (French index) at its highest in more than nine years and the spread between French and German 10-year yields (a barometer of French risk) is back within the range it traded in prior to the spike in November.
Source - OANDA fxTrade Advanced Charting Platform
Source - Thomson Reuters Eikon
What this does mean is that there appears little room for a significant and sustainable bounce. That may not stop markets engaging in a relief rally at the start of the week - it doesn't guarantee it either - but I don't believe we'll see anything like the kind of moves that would come in the alternative scenario.
Scenario 2: Le Pen Victory
The run up to the French election remains me of the days before the UK voted on its membership of the EU with one difference, this time there is good reason to be a little confident (albeit never complacent), the gap in the polls is huge. While people were confident (and wrong) that the UK would vote to remain, the polls were only showing a slim margin, that is not the case here. Most polls give Macron a 24 point lead which will be extraordinarily difficult to overcome.
Should it happen though, the reaction in the market could be very reminiscent to that which followed the UK vote, albeit possibly a little less extreme due to point 4 above (a referendum). Still, with little risk premium being priced in, I would expect some major moves on the open next week and some extreme risk aversion with the flight to safety likely benefiting the traditional safe havens such as Gold and the yen. The euro could suffer quite badly while French yields would likely spike - given how they traded when Le Pen was leading in the polls - and the CAC may take a considerable hit.
It would also be interesting to see how this outcome would also affect sterling, the FTSE and Gilts. Would Le Pen be beneficial for the UK in Brexit negotiations? Would this prove to be a distraction for the EU and a far greater priority meaning negotiations with the UK take a back seat?
French Election Timeline
- May 5 - [from midnight] Poll blackout
- May 7 - Second round of French presidential elections. Last polls close at 19:00 BST / 14:00 EDT, with an exit poll result announced immediately.
- May 11 - Official proclamation of the new President.
- May 14 - [from midnight] End of Francois Hollande's mandate
- June 11 - First round of legislative elections
- June 18 - Second round of legislative elections.
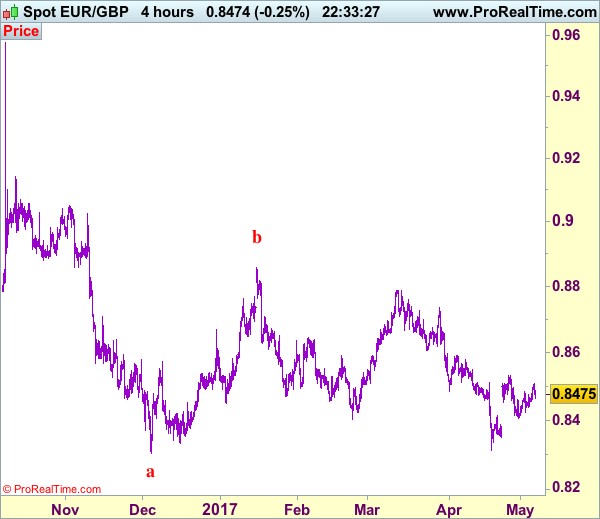
Trade Idea: EUR/GBP – Stand aside
EUR/GBP - 0.8480
Recent wave: Major double three (A)-(B)-(C)-(X)-(A)-(B)-(C) is unfolding and 2nd (A) has possibly ended at 0.6936.
Trend: Near term down
New strategy :
Stand aside
Position : -
Target : -
Stop : -
As the single currency edged higher again today, retaining our view that further consolidation would be seen and although marginal gain from here cannot be ruled out, reckon upside would be limited to resistance at 0.8531 and bring retreat later. Only a break of this level would add credence to our view that a temporary low has been formed at 0.8312 and extend the rebound from there for retracement of recent decline to 0.8550, however, reckon resistance at 0.8580 would limit upside and 0.8600-10 would hold from here.
On the downside, whilst pullback to 0.8440-45 cannot be ruled out, reckon 0.8420-25 would limit downside and said support at 0.8405 would remain intact. Only a drop below this level would signal the rebound from 0.8312 has ended, bring further fall to 0.8370-75 but support at 0.8351 should remain intact, bring another rebound later. As near term outlook is mixed, would be prudent to stand aside in the meantime.
Our preferred count is that, after forming a major top at 0.9805 (wave V), (A)-(B)-(C) correction is unfolding with (A) leg ended at 0.8400 (A: 0.8637, B: 0.9491 and 5-waver C ended at 0.8400. Wave (B) has ended at 0.9413 and impulsive wave (C) has either ended at 0.8067 or may extend one more fall to 0.8000 before prospect of another rally. Current breach of indicated resistance at 0.9043 confirms our view that the (C) leg has ended and bring stronger rebound towards 0.9150/54, then towards 0.9240/50.
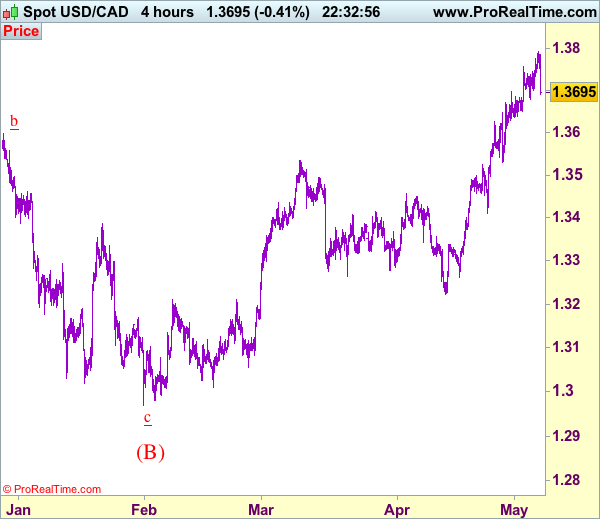
Trade Idea: USD/CAD – Buy at 1.3540
USD/CAD - 1.3698
Recent wave: Only wave v of c has ended at 0.9407 and wave C of major A-B-C correction is underway for headway to 1.4700
Trend: Near term up
Original strategy :
Buy at 1.3600, Target: 1.3750, Stop: 1.3540
Position: -
Target: -
Stop: -
New strategy :
Buy at 1.3540, Target: 1.3750, Stop: 1.3480
Position: -
Target: -
Stop:-
As the greenback has finally retreated after rising to 1.3794, suggesting consolidation below this level would be seen and correction to 1.3645-50 is likely, however, reckon downside would be limited to 1.3600 and support at 1.3530 should hold, bring another rise later, above said resistance at 1.3794 would extend gain to 1.3840-50 but near term overbought condition should prevent sharp move beyond there and price should falter below 1.3890-00, risk from there is seen for a retreat to take place later.
In view of this, would not chase this rise here and would be prudent to buy again on further subsequent pullback as 1.3530 support should limit downside. A firm break below this level would abort and signal a temporary top is formed instead, risk correction to 1.3500 and later towards 1.3450-60 but support at 1.3411 should remain intact, bring another upmove later.
To recap, wave B from 1.3066 is unfolding as an a-b-c and is sub-divided as a: 1.2192, b: 1.2716 and wave c is a 5-waver with i: 1.1983, ii: 1.2506, extended wave iii with minor iii at 1.0206, wave iv ended at 1.0781 and wave v as well as wave iii has ended at 0.9931, hence the subsequent choppy trading is the wave iv which is unfolding as (a)-(b)-(c) with (a) leg of iv ended at 1.0854, followed by (b) leg at 1.0108 and (c) leg as well as the wave iv ended at 1.0674. The wave v is sub-divided by minor wave (i): 0.9980, (ii): 1.0374, (iii): 0.9446, (iv): 0.9913 and (v) as well as v has possibly ended at 0.9407, therefore, consolidation with upside bias is seen for major correction, indicated target at 1.3700 and 1.4000 had been met and further gain to 1.4700 would be seen later.
Nonfarm Employment Springs Forward in April
Nonfarm employment bounced back from its weather-induced March slowdown. Payrolls added 211,000 jobs in April and the unemployment rate fell to 4.4 percent. Hours worked and hourly earnings also rose solidly.
A Solid Report
Nonfarm employment rose by 211,000 in April and the unemployment rate fell to 4.4 percent. Net revisions to prior months' data only deducted about 6,000 jobs, and the average gain for the past three months remains a solid 174,000 jobs. Job gains were fairly broad-based, with just over 60 percent of the industry groups surveyed by the BLS adding jobs in April. The overall quality of jobs being created improved, with a substantial acceleration in hiring for full-time positions and deceleration in part-time jobs.
The employment data through the first four months of this year have been significantly impacted by a number of seasonal influences. Unseasonably mild winter weather in the Northeast and Midwest allowed for construction activity to ramp up a little earlier than usual this year, leading to strong gains in construction jobs in January and February. With hiring rising earlier in the year, there was less of subsequent pick up this spring, leading to smaller-than-usual seasonally-adjusted gains in March and April.
The late Easter also wreaked havoc on employment data at retailers and in hospitality. Easter came at the end of the April survey week, which weighed on retail and hospitality employment in March and set the table for a strong bounce back in April, particularly in the hospitality sector, which added 55,000 jobs. About half the increase in hospitality jobs was in food services & drinking places. By contrast, retailers added just 6,000 jobs, reflecting store closings announced after this past year's disappointing holiday shopping season and the loss of market share to online retailers.
Average hourly earnings rose 0.3 percent in April and are now up 2.5 percent year-to-year. Hiring in higher-paying industries grew more modestly. Construction added just 5,000 jobs and manufacturers added 6,000 jobs. Hiring in mining & logging rose by 10,000 positions, reflecting increased oil production. Healthcare & social services, professional & business services and financial services all posted solid gains in April. While average hourly earnings rose only modestly, total hours worked rose by a stronger 0.5 percent in April. Taken together, the two gains should produce solid income growth in April and help drive a rebound in consumer spending during the second quarter.
The unemployment rate fell to 4.4 percent in April, as household employment outpaced labor force growth. The labor force participation rate fell slightly during the month but the participation rate for prime-working age workers actually increased. The broader U-6 measure of unemployment fell to 8.6 percent, which in part reflects the recent shift toward more fulltime jobs being created relative to part-time positions. The improved mix of jobs being created should pull more job seekers into the labor force. The acceleration in full-time positions is also consistent with the recent acceleration in household formations and homeownership.
Currencies: Solid Payrolls Don’t Help USD. EUR/USD Holds Near 1.10
Headlines
European equity markets eke out gains with the French CAC40 outperforming (+0.7%), anticipating a Macron victory. US stock markets open narrowly mixed after a decent, but close to consensus, payrolls report.
Net US job growth increased by 211k in April, slightly beating 190k consensus. The previous two payrolls numbers were downwardly revised by a combined 6k. The unemployment rate unexpectedly declined from 4.5% to 4.4%, matching the cycle low from 2006-2007. Wage growth disappointed though, slowing from 2.6% Y/Y to 2.5% Y/Y.
Centrist French presidential candidate Macron extended his lead in the polls over his far-right rival Le Pen to 62% on the final day of a tumultuous election campaign that has turned the country's politics upside down.
The Czech PM Sobotka has made a U-turn on his decision earlier this week to resign along with his government, saying he now aims only to dismiss his billionaire FM and political rival, Babis. Friday's change of heart came after Sobotka met Czech president Zeman, who declined to accept the resignation of the entire government but only that of the PM.
Brent crude recovered today from a sudden 3% fall in Asian trade and following a week of steep losses globally as investors continue to worry about brimming crude inventories.
Rates
Commodity panic premature; payrolls non-event
What promised to be an exciting trading day, turned out to be a dull session on bond markets. Asian commodity-related panic proved premature and US payrolls printed too close to consensus. At the time of writing, the US yield curve flattens with yield changes ranging between +1.6 bps (2-yr) and -1.3 bps (30-yr). The German yield curve shifts 0.3 bps (2-yr) to 1.1 bp (10-yr) higher. On intra-EMU bond markets, 10-yr yield spread changes versus Germany are unchanged apart from Spain (-5 bps), Italy (-8 bps) and Greece (-11 bps). Greek PM Tsipras told lawmakers to approve the deal reached earlier this week with international creditors. Greek parliament votes on the additional reform package on May 17.
The overnight panic on Asian markets because of significant weakness in oil and other commodity prices didn't persist in European/US trading. Brent crude recovered, rising from a $46.6/barrel low to $48/5 barrel, but remains below key $50/barrel support. The US Note future erased Asian gains around the European opening and the Bund opened neutral. What followed was one stretched yawn into the payrolls with European assets slightly favoured above US ones as centrist French presidential candidate Macron extended his lead over Le Pen on the final campaign day. US payrolls were strong, although the wage component disappointed. The US Note future spiked lower on the release, dipping below 125-04+/03+ support (previous cycle high/38% retracement), but soon rebounded higher as the wage component primed. Markets soon found a new equilibrium even if the Bund marginally underperformed the Note future.
Currencies
Solid payrolls don't help USD. EUR/USD holds near 1.10
The dollar was in the defensive in Asia this morning, but found a bottom in Europe as European markets were only modestly affected by the decline in commodities and the equity correction in Asia. The US payrolls report was solid, but it was not strong enough to inspire a genuine dollar rebound. USD/JPY trades in the 112.50 area. EUR/USD holds within reach of the 1.10 level, but a real test didn't occur yet.
The ongoing decline in commodities weighed on Asian equities overnight. The risk-off correction supported the yen even as Japanese markets were closed. USD/JPY dropped to the low 112 area. The decline in commodities also kept the Aussie dollar (AUD/USD <0.74) and the Canadian dollar (USD/CAD >1.3775) under pressure. With the dollar and commodity currencies in the defensive, the euro was 'by default' outperformer. EUR/USD traded in the high 1.09 area.
European equities were also modestly affected by the risk-off/commodity correction in Asia, but the damage could have been much worse (loss of about 0.5%). The decline in commodities clearly didn't trigger a broad based risk-off correction. Core bond yields also hardly declined. The easing of tensions put a floor for USD/JPY and for the dollar in general. USD/JPY found an intraday bottom in the 112.10 area early in Europe and rebounded slightly going into the payrolls. The dollar also regained some ground against the euro. EUR/USD settled in the 1.0955/80 area.
The US payrolls were OK. Job growth printed at 211K. (190K consensus). Other indictors of the report were a bit mixed. The unemployment rate unexpectedly declined from 4.5% to 4.4%. At the same time, wage growth was slightly disappointing at 0.3% M/M and 2.5% Y/Y. Over the previous days, USD sentiment was a bit fragile. So, the odds were that the dollar needed very strong data or other good news to gain ground. The initial reaction to the payrolls confirms this pattern. After an initial hesitation, USD/JPY settled in the mid 112 area. EUR/USD returned to the high 1.09 area, but a real test of 1.10 didn't occur yet. The pair trades currently in the 1.0975/80 area. So, the feeling of a fragile USD sentiment persists. At the same time, the euro remains in good shape going into the second round of the French presidential elections.
Sterling resilient against a strong euro
There was no high profile UK news with impact on sterling today. The conservative party made good progress in local elections, indicating that PM May's call for early elections will probably give her a comfortable majority at the start of the Brexit negotiations. As was often the case of late, sterling's reaction was very modest, at best. Cable holds near the recent highs which maybe suggests a slightly positive impact on sterling. The soft reaction of the dollar after the payrolls also supports cable. The pair trades currently near 1.2950. EUR/GBP trades slightly off this morning's top. The pair is trading in the 0.8485 area. So sterling holds up well against a strong euro.
Weekly Focus: Global Business Cycle Back in Focus
Market movers ahead
- We expect a rebound in US CPI inflation after the sharp fall in the March inflation print.
- German GDP growth for Q1 is likely to mirror the relatively strong euro area growth.
- We expect the Bank of England to keep rates unchanged but believe focus will be on its policy stance on Thursday.
- We expect Chinese inflation pressure to continue to be muted.
- In Scandinavia, focus is set to be on inflation prints and, for Sweden, the minutes of the last Riksbank meeting.
Global macro and market themes
- Political risks are fading in Europe with Emmanuel Macron likely to become the next president of France.
- Economic momentum looks strong in the euro area.
- However, PMI indicators are pointing to a softening of the economic cycles in the US and China.
- Chinese financial markets are seeing increasing stress and commodity prices have also come under pressure.
- The impact on equity prices of a softer global business cycle is likely to be offset by strong earnings growth.
U.S. April Payroll Employment Jumps by 211K
Highlights:
- April payroll employment rose a stronger-than-expected 211K returning to a pace of increase evident in the first two months of the year and indicative that the March moderation to 79K was an anomaly.
- The recovery in employment was most evident in private sector, service-producing jobs where hiring jumped to 173K from 54K in March. Goods-producing jobs rose 21K in April which was down slightly from the 23K increase recorded the previous month while government employment rose to 17K from 2K over the same period.
- The separate household survey indicated a further unexpected drop in the unemployment rate to 4.4% from the 4.5% recorded in March and 4.7% in February. Market expectations had been for the April rate to retrace one-half of the March drop.
- Average hourly earnings, the main wage measure in the report, rose an expected 0.3% though this did not prevent the year-over-year rate moderating slightly to 2.5% from 2.6% in March and a Q1 average of 2.7%. Despite the moderation, the data is indicative workers continuing to enjoy real wage gains.
Our Take:
The rise in April payroll employment provides some evidence that the weakness in March where the employment gain dropped to 79K was an anomaly and that businesses confidence remains robust to take on more workers. The wage increase did moderate slightly in April but is still indicative of real wage gains. This continued support to household incomes should contribute to Q2 consumer spending growth, and overall Q2 GDP growth, rebounding to an above-average rate after a disappointing first quarter increase. The FOMC statement this week characterized "the slowing in growth during the first quarter as likely to be transitory" and would likely view today's employment report as offering support to this claim. Our forecast assumes that the Fed will continue to tighten policy with the fed funds range rising by a cumulative 50 basis points before the end of the year. However, this is contingent upon the upcoming expenditure data confirming a rebound in growth. Our forecast assumes that annualized GDP growth picks up to 2.9% from the 0.7% rise recorded in Q1 with above-average growth being maintained through the end of next year