
Sample Category Title
Trade Idea Update: USD/CHF – Stand aside
USD/CHF - 0.9890
New strategy :
Stand aside
Position : -
Target : -
Stop : -
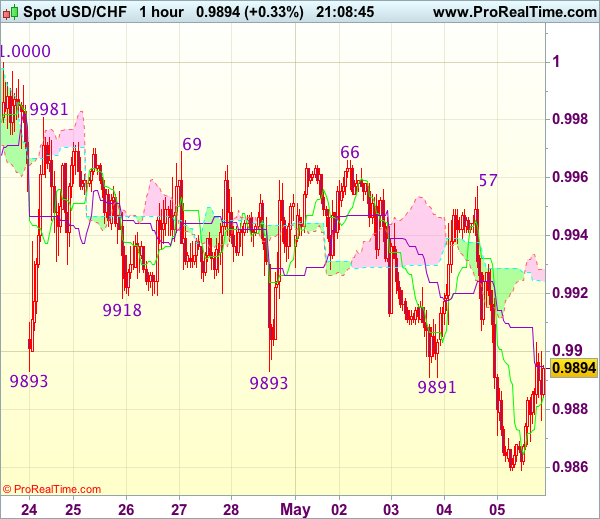
Yesterday’s selloff after meeting renewed selling interest at 0.9957 together with the breach of support at 0.9891-93 confirm recent decline from 1.0108 top has resumed and bearishness remains for further weakness to support at 0.9831 and possibly towards 0.9800, however, near term oversold condition should prevent sharp fall below 0.9770, risk from there is seen for a rebound later.
In view of this, would not chase this fall here and would be prudent to stand aside in the meantime. Above the Kijun-Sen (now at 0.9908) would bring recovery to 0.9925-30 but price should falter well below said resistance at 0.9957, bring another decline later. Only break of 0.9966-69 resistance would signal low is formed instead, bring subsequent bounce to 1.0000-08 later.
Trade Idea Update: GBP/USD – Buy at 1.2885
GBP/USD - 1.2944
Original strategy :
Buy at 1.2865, Target: 1.2965, Stop: 1.2830
Position : -
Target : -
Stop : -
New strategy :
Buy at 1.2885, Target: 1.2985, Stop: 1.2850
Position : -
Target : -
Stop : -
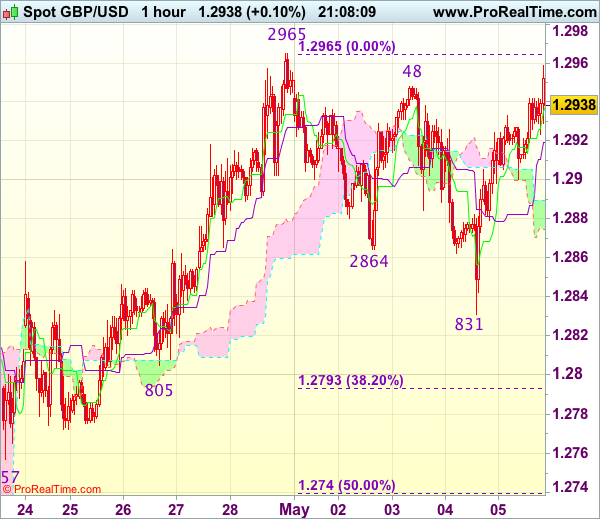
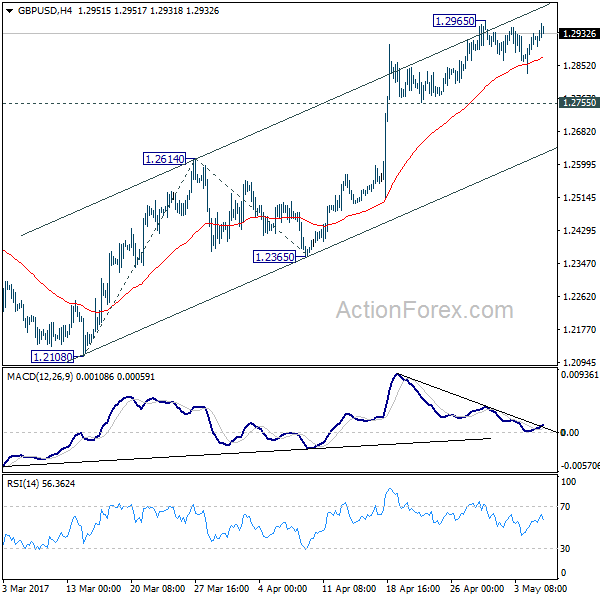
As cable has staged a strong rebound after finding support at 1.2831 yesterday, signaling the pullback from 1.2965 has ended at 1.2831, bring retest of 1.2965, once this level is penetrated, this would confirm recent upmove has resumed and extend further gain to 1.2990-00 (1.236 times projection of 1.2109-1.2616 measuring from 1.2365 and psychological resistance), then towards 1.3040-50 which is likely to hold from here.
In view of this, would not chase this rise here and would be prudent to buy cable on pullback as 1.2880-85 should limit downside and bring another rise later. Only break of said support at 1.0831 would abort and signal a temporary top has been formed, bring retracement of recent upmove to 1.2790-95 (38.2% Fibonacci retracement of 1.2515-1.2965) but support at 1.2740-50 (50% Fibonacci retracement) should hold.
Trade Idea Update: EUR/USD – Buy at 1.0920
EUR/USD - 1.0974
Original strategy :
Buy at 1.0920, Target: 1.1020, Stop: 1.0885
Position : -
Target : -
Stop : -
New strategy :
Buy at 1.0920, Target: 1.1020, Stop: 1.0885
Position : -
Target : -
Stop : -
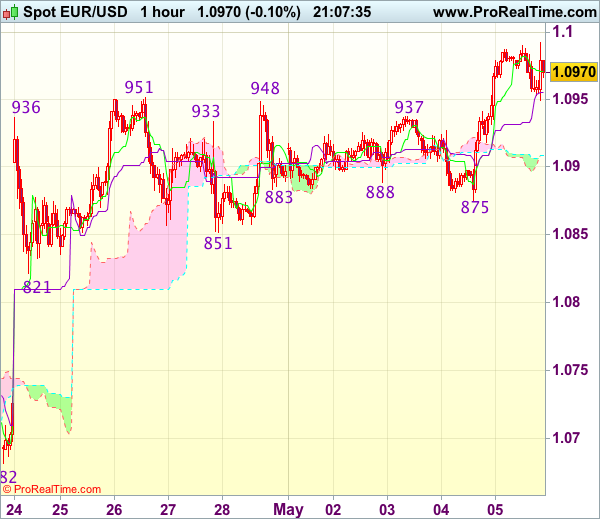
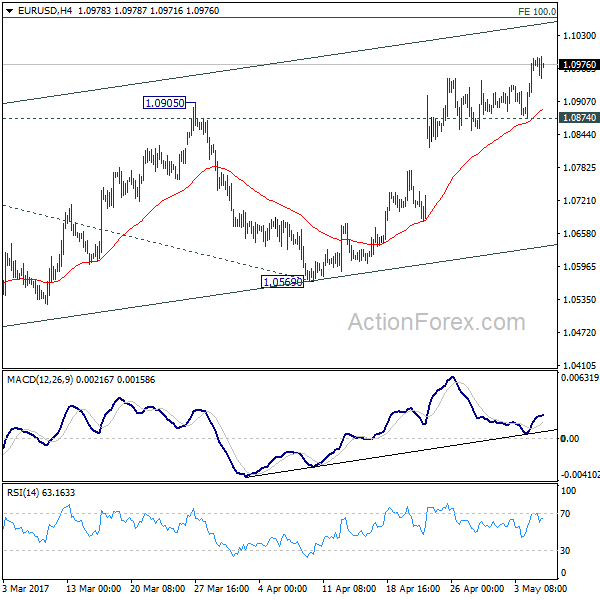
Euro finally broke above indicated resistance at 1.0951 (last week’s high), confirming our view that recent upmove from 1.0340 low has resumed and bullishness remains for this move to extend further gain to 1.1000, then towards 1.1025 (50% projection of 1.0602-1.0951 measuring from 1.0851) but reckon upside would be limited to 1.0050-60, risk from there is seen for a retreat later.
In view of this, would not chase this move here and would be prudent to buy euro on subsequent pullback as 1.0915-20 should limit downside. Only below support at 1.0875 (yesterday’s low) would abort and signal top is formed instead, bring correction to support at 1.0851 but price should stay above 1.0821 support, bring another rise later.
US: Job Growth Bounces Back in April
Non-farm payrolls rose by 211k in April, above the consensus estimate of 190k. Private-sector hiring expanded by 194k, while 17k were added to government payrolls.
The unemployment rate fell to 4.4%, the lowest level since May 2007, as the labor force participation edged down 0.1 percentage points to 62.9%.
Revisions were minor, subtracting 6k from payrolls on average in the previous two months.
Goods-producing employment rose a robust 21k, led by mining and logging, which added 10k - marking the sixth straight months of gains for the sector. Manufacturing added 6k, while construction added 5k. Services-producing employment rose 173k, led by gains in leisure and hospitality (+55k), education and health (+41k), and business services (+39k).
Average hourly earnings rose a healthy 0.3%, but the year-on-year metric edged down to 2.5% from 2.6% in March. Average weekly earnings were up a robust 0.6%, as hours of work edged up to 34.4 hours a week.
Key Implications
The American job machine returned to form in April. The re-acceleration in job should assuage fears that economic growth is slowing in any meaningful way. This confirms the Federal Reserve's message this week that the economy remains on track.
With unemployment pushing below its natural long-run rate, the participation rate remains an important indicator to watch. It's pullback in April, while slight, is not a great sign for those who believe the labor market still has a lot of cyclical slack remaining.
At 2.5%, wage growth is not yet flashing red signals, but is still sufficient to provide real gains in purchasing power. This should flow through to spending in the months ahead, providing the impetus for stronger economic growth.
Trade Idea Update: USD/JPY – Stand aside
USD/JPY - 112.59
Original strategy :
Exit long entered at 112.20,
Position : - Long at 112.20
Target : -
Stop : -
New strategy :
Stand aside
Position : -
Target : -
Stop : -
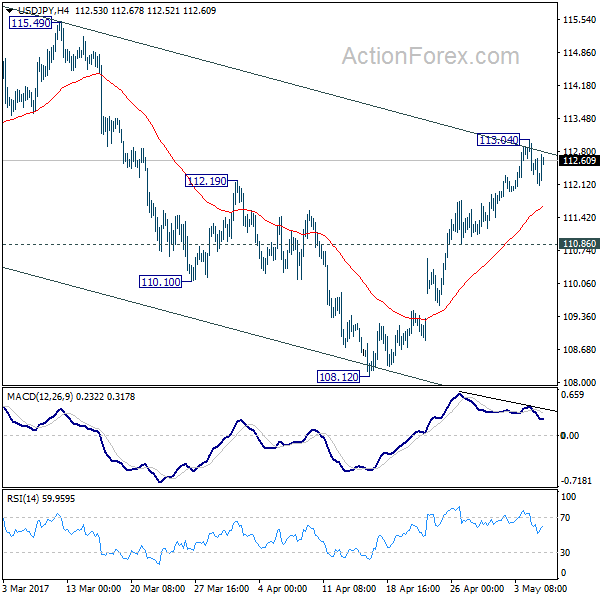
Although the greenback has rebounded after finding support at 112.09 and gain towards 112.90-00 cannot be ruled out, break of yesterday’s high at 113.05 is needed to confirm recent upmove has resumed and extend gain to 113.10-15 (61.8% projection of 108.13-111.78 measuring from 110.87) but reckon upside would be limited to previous resistance at 113.54 and price should falter well below 113.90-00.
In view of this, would not chase this rise here and would be prudent to stand aside for now. Below 112.09 support would bring test of 111.96 but break of this level is needed to signal a temporary top has been formed at 113.05, bring correction to 111.73-78 (38.2% Fibonacci retracement of 109.59-113.05 and previous resistance), however, reckon 111.21-32 (previous support and 50% Fibonacci retracement) would contain weakness.
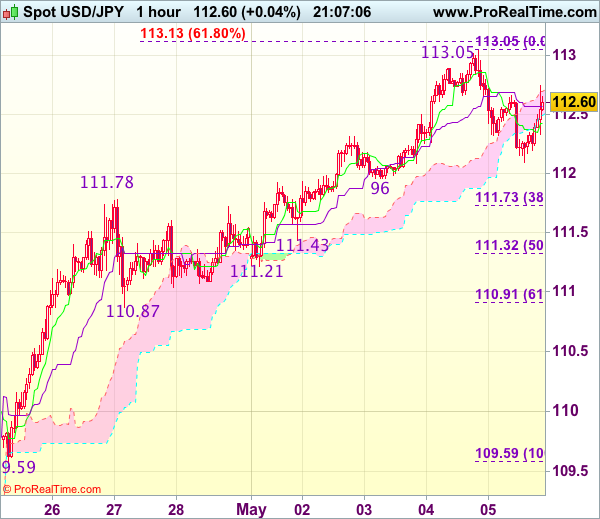
USD/JPY Mid-Day Outlook
Daily Pivots: (S1) 112.16; (P) 112.61; (R1) 112.90; More...
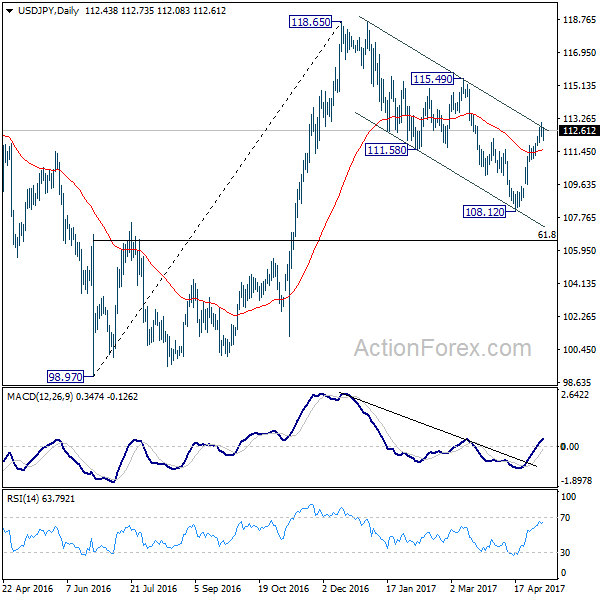
Intraday bias in USD/JPY remains neutral for consolidation below 113.04 temporary top. Further rise is still expected as long as 110.86 support holds. We'd holding on to the view that corrective fall from 118.65 has completed with three waves down to 108.12 already. Break of 113.04 will target 115.49 resistance. Firm break there will resume larger rally from 98.97 to 125.85 high. However, break of 110.86 support will keep USD/JPY inside near term falling channel and will turn bias back to the downside for 108.12 and below to extend the decline from 118.65.
In the bigger picture, price actions from 125.85 high are seen as a corrective pattern. It's uncertain whether it's completed yet. But in case of another fall, downside should be contained by 61.8% retracement of 75.56 to 125.85 at 94.77 to bring rebound. Meanwhile, break of 115.49 resistance will extend the rise from 98.97 to retest 125.85. Overall, rise from 75.56 is still expected to resume later after the correction from 125.85 completes.
USD/CHF Mid-Day Outlook
Daily Pivots: (S1) 0.9830; (P) 0.9894; (R1) 0.9925; More.....
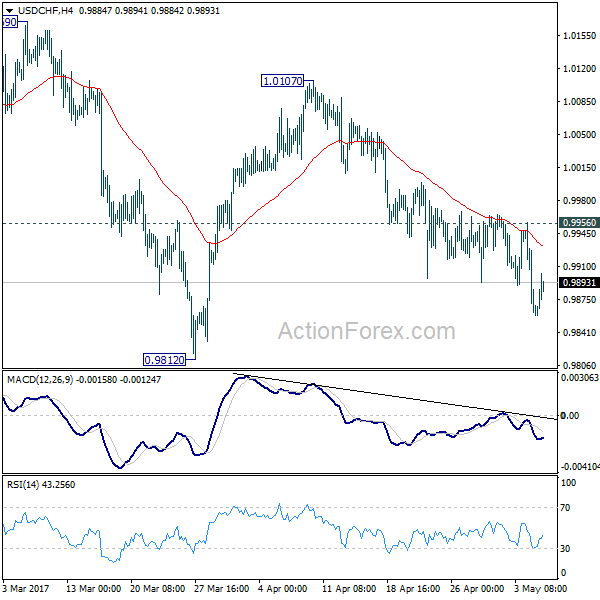
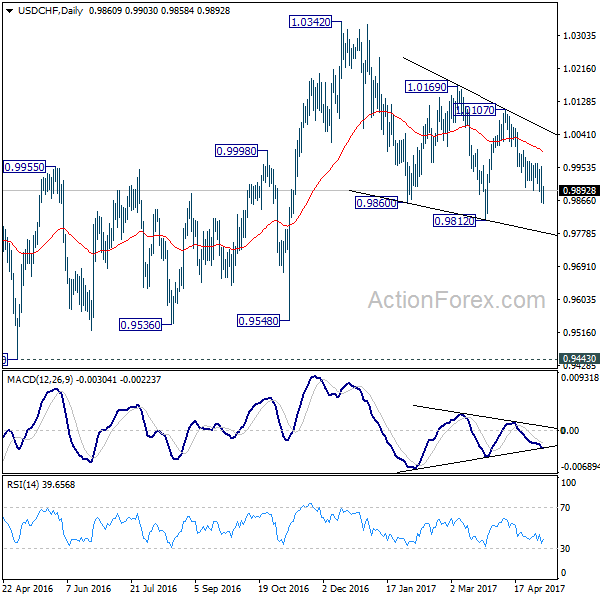
Intraday bias in USD/CHF remains on the downside for 0.9812 support and below. Note again that price actions from 1.0342 are seen as a correction. Break of 0.9812 should be brief and we will look for bottoming signal below there. On the upside, break of 0.9956 resistance will suggest that fall from 1.0107 is completed and turn bias back to the upside for this resistance.
In the bigger picture, we're still maintaining that firm break of 1.0342 key resistance is needed to confirm underlying bullish momentum in the pair. However, the corrective nature of the fall from 1.0342 is starting to give the medium term outlook a bullish favor. Hence, in stead of looking for topping signal around 1.0342, we'd now pay closer attention to upside acceleration as USD/CHF approaches this level again.
GBP/USD Mid-Day Outlook
Daily Pivots: (S1) 1.2855; (P) 1.2893; (R1) 1.2958; More...
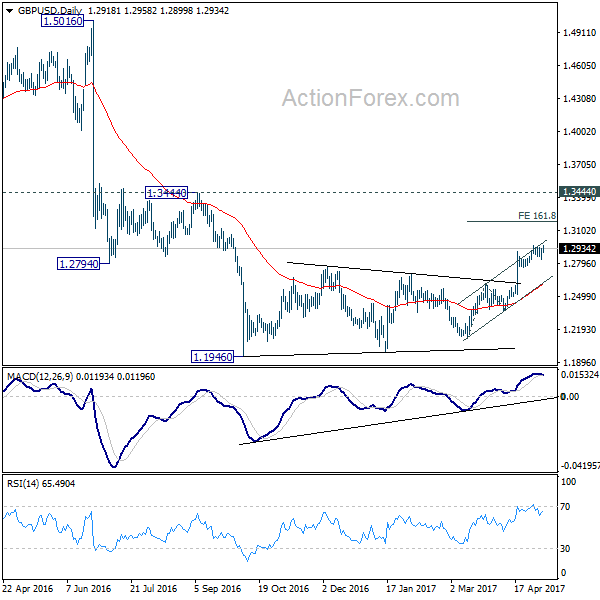
Intraday bias in GBP/USD remains neutral as it's still bounded in range below 1.2965 temporary top. Further rise remains in favor with 1.2755 support intact. Break of 1.2965 will target 161.8% projection of 1.2108 to 1.2614 from 1.2365 at 1.3184. At this point, price actions from 1.1946 are still seen as a correction pattern. Therefore, we'd expect strong resistance below 1.3444 to bring larger down trend resumption. On the downside, break of 1.2755 minor support will turn bias to the downside. Further break of 1.2614 resistance turned support will now indicate near term reversal.
In the bigger picture, fall from 1.7190 is seen as part of the down trend from 2.1161. There is no sign of medium term reversal yet. Sustained trading below 61.8% projection of 2.1161 to 1.3503 from 1.7190 at 1.2457 will target 100% projection at 0.9532. Overall, break of 1.3444 resistance is needed to confirm medium term bottoming. Otherwise, outlook will remain bearish.
EUR/USD Mid-Day Outlook
Daily Pivots: (S1) 1.0909; (P) 1.0948 (R1) 1.1022; More....
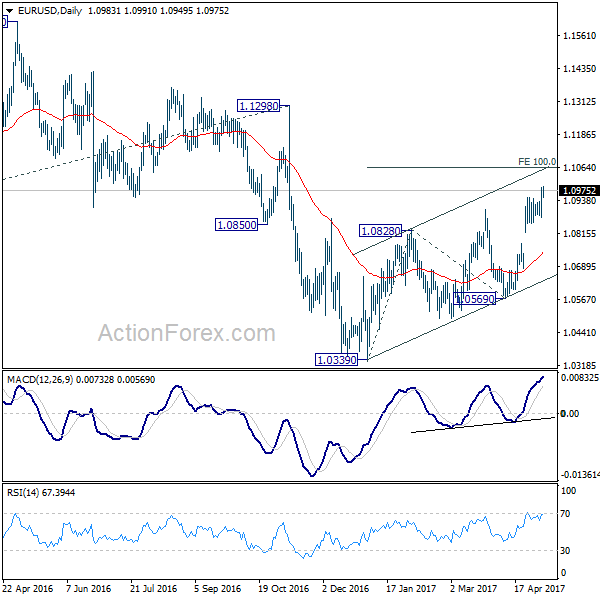
Intraday bias in EUR/USD remains on the upside for the moment and further rally should be seen. Next target is 100% projection of 1.0339 to 1.0828 from 1.0569 at 1.1058. At this point, rise from 1.0339 is still seen as a corrective move. Hence we'd expect strong resistance from 1.1058 projection to limit upside and bring near term reversal. On the downside, break of 1.0874 support will turn bias back to the downside for 1.0569 support first.
In the bigger picture, as long as 1.1298 key resistance holds, whole down trend from 1.6039 (2008 high) is still expected to continue. Break of 1.0339 low will send EUR/USD through parity to 61.8% projection of 1.3993 to 1.0461 from 1.1298 at 0.9115. However, considering bullish convergence condition in weekly MACD, break of 1.1298 will indicate term reversal. This would also be supported by sustained trading above 55 week EMA.
Dollar Stays Pressured Against Euro and Sterling as NFP Risk Cleared
Dollar stays weak against Euro and Sterling in early US session as non-farm payroll risk is cleared. NFP showed 211k growth in the US job market in April, above expectation of 180k. However, prior month's weak figure was revised further down to 79k from 98k. Unemployment rate, however, dropped to 4.4%, down from 4.5% and below expectation of 4.6%. That's the lowest figure in nearly a decade since May 2007. Average hourly earnings showed 0.3% mom growth, in line with consensus. But prior month's wage growth was revised down to 0.1% mom.
Overall, the set of data does little to change the expected policy path of Fed. FOMC is expected to hike again in June, and another time possibly in September. Then Fed will take a brief pause to start the program to shrink its balance sheet. Markets will now listen to comments from Fed speakers, including Fed Chair Janet Yellen, Fed Vice Chairman Stanley Fischer, Boston Fed President Eric Rosengren, San Francisco Fed President John Williams, Chicago Fed President Charles Evans, and St. Louis Fed President James Bullard.
Canadian job data mixed, Loonie weak on oil price
Released from Canada, employment market grew 3.2k in April, well below expectation of 20.0k. Unemployment rate, however, dropped to 6.5%. Canadian dollar is set to end the week as one of the weakest major currencies, just next to Aussie and yen. Free fall in oil price is seen as the main factor driving down the Loonie. WTI crude oil dived to as low as 43.76 earlier today but recovers after drawing support from 44.09 fibonacci level.
OPEC hinted that it is likely for the output cut deal to be extended with the same terms, i.e. reducing production by 1.8M bpd, for 6 months. The market was disappointed as they had hoped for bigger reduction in the "new" deal. The goal of the output cut deal, announced late last year and effective in January 2017, is to rescue the massive selloff of oil prices. However, price performance signal that the cartel has probably lost control. The market is more concerned over the persistent increase in US oil production with the number of US oil rigs hitting a 2-year high last week.
.
Euro strong on Macron set to win election
Euro is set to end the week as the strongest major currency. Markets are generally optimistic that pro-EU centrist Emmanuel Macron will win the French election on Sunday. And it's so overwhelmingly one-sided on such expectation that we have be to cautious on a sell of news reversal on Monday. Macron extended his lead over EU-sceptic far right Marine Le Pen. According to and Elabe poll for BFM TV and L'Express, Macron is set to get 62% of votes in the run-off. And Le Pen will only get 38%. That's a 24 pts lead, up 3 pts from the last Elabe poll. Macron was also voted as the most convincing one in the last pre-election debate earlier this week.
Elsewhere, Eurozone retail PMI rose to 52.7 in April. Swiss Foreign currency reserves rose to CHF 696b in April.
EUR/USD Mid-Day Outlook
Daily Pivots: (S1) 1.0909; (P) 1.0948 (R1) 1.1022; More....
Intraday bias in EUR/USD remains on the upside for the moment and further rally should be seen. Next target is 100% projection of 1.0339 to 1.0828 from 1.0569 at 1.1058. At this point, rise from 1.0339 is still seen as a corrective move. Hence we'd expect strong resistance from 1.1058 projection to limit upside and bring near term reversal. On the downside, break of 1.0874 support will turn bias back to the downside for 1.0569 support first.
In the bigger picture, as long as 1.1298 key resistance holds, whole down trend from 1.6039 (2008 high) is still expected to continue. Break of 1.0339 low will send EUR/USD through parity to 61.8% projection of 1.3993 to 1.0461 from 1.1298 at 0.9115. However, considering bullish convergence condition in weekly MACD, break of 1.1298 will indicate term reversal. This would also be supported by sustained trading above 55 week EMA.
Economic Indicators Update
| GMT | Ccy | Events | Actual | Forecast | Previous | Revised |
|---|---|---|---|---|---|---|
| 01:30 | AUD | RBA Statement on Monetary Policy | ||||
| 07:00 | CHF | Foreign Currency Reserves Apr | 696B | 683B | ||
| 08:10 | EUR | Eurozone Retail PMI Apr | 52.7 | 49.5 | ||
| 12:30 | CAD | Net Change in Employment Apr | 3.2K | 20.0K | 19.4K | |
| 12:30 | CAD | Unemployment Rate Apr | 6.50% | 6.70% | 6.70% | |
| 12:30 | USD | Change in Non-farm Payrolls Apr | 211K | 180K | 98K | 79K |
| 12:30 | USD | Unemployment Rate Apr | 4.40% | 4.60% | 4.50% | |
| 12:30 | USD | Average Hourly Earnings M/M Apr | 0.30% | 0.30% | 0.20% | 0.10% |
| 14:00 | CAD | Ivey PMI Apr | 62.3 | 61.1 |