Sample Category Title
French Election: Which Way for EUR/USD?
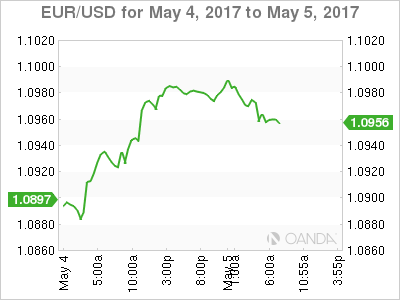
EUR/USD has been consolidating, following the first-round of the French election, flirting with a significant psychological level at 1.0900.
The second-round of the French presidential election will be held this Sunday May 7, and EUR has strengthened as markets expect Macron to win the final vote.
During the early European session today, EUR/USD reached a high of 1.0989, last seen on November 9 of 2016.
However, EUR/USD retraced as it was nearing a significant psychological resistance level at 1.1000 (where heavy selling pressure is expected). We can also speculate that many traders have reduced exposure ahead of the election to minimise risk.
If Macron wins we can expect EUR/USD to rise and likely break the resistance level at 1.1000.
Conversely, if Le Pen wins we can expect risk-off sentiment and market concerns over the collapse of the EU which will result in a selloff in EUR/USD.
Be aware that, the result will likely cause significant volatility in the market with the possibility of a gap in Friday's close and Monday's open during early Asian session.
The resistance level is at 1.1000 followed by 1.1050.
The support line is at 1.0950 followed by 1.0930 and 1.0900.
Please note that the release of US labour market data (Apr), at 13:30 BST today, will likely cause volatility for USD, USD crosses and commodities.
A Trading Idea for USDCAD While the Canadian Dollar is Under Pressure
The Fed didn't raise the key interest rate yesterday, as we expected. It was left at the previous level of 0.75-1.00%. The latest reports from the US appeared to be weak. But the Central Bank said that a slowdown of the GDP growth is temporary. They also announced that consumer spendings and the labor market are at a quite good level now. Everyone who work with the financial markets are optimistic about that comments. So, the probability of the interest rate growing has increased greatly. The FedWatch Tool is at the 73.8% level at the moment.
Source: cmegroup.com
We could notice strong purchases on the USD/CAD currency pair during the last 3 weeks. The Canadian dollar has lost more than 400 points against USD. It happened due to the negative dynamics on the oil market. Here is the chart where we can see that the WTI oil has decreased by more than 14% during the last month.
A current technical pattern on USD/CAD:
Support levels: 1.3700, 1.3535, 1.3415
Resistance levels: 1.3800
The Inside Bar is a classic PA pattern which has formed on the H4 chart. It indicates the continuation of the current trend. The price of the asset has fixed near the 1.3800 level and the main candle. Indicators show us the strength of buyers. The MACD histogram is in the positive zone, while the price of USD/CAD is above the 50 and 200 MA.
We'd advise to long this pair after it fixes above the 1.3800 round resistance level. Entry points should be searched for on the younger timeframes. It's recommended to accompany this position with a trailing stop to fix the profit. The goal of this deal is 1.3875. We think that this asset can reach the 1.3950 level in the medium term.
D-Day For Non-Farm Payroll
April's non-farm payrolls report is due out this morning at 08.30 am EST, and consensus is looking for +185k new jobs and the unemployment rate to stay atop of +4.5%.
Any print above the +150k benchmark will be considered good enough for the Fed to hike rates soon, but anything below and investors will be worrying that the U.S economy is officially losing 'steam.'
Aside from today's NFP print, there are a plethora of Fed speakers doing the rounds. Fed Chair Janet Yellen will speak in at 1:30 pm EST and top brass San Francisco Fed President Williams, St. Louis Fed President Bullard and Fed Vice-Chair Fisher are all due to speak this afternoon and expect them to provide a good deal of clarity on Wednesday's FOMC statement.
Elsewhere, a slump in commodity prices has triggered a rally in safe-haven bonds, the yen and gold.
1. Global equities see red
Equity markets are on the back foot in the overnight session, leading the cause are Chinese shares, which completed its longest losing streak this year as regulators try to curb leverage and speculation.
In China, the blue-chip CSI300 index fell -0.6%, while the Shanghai Composite Index dropped -0.8% overnight – fresh three-month lows and their fourth weekly loss in a row.
Down-under, the Aussie S&P/ASX 200 Index lost -0.7%, falling for a fourth straight day, pressured by weaker commodity prices.
In Europe, indices are trading off the session lows, but lower across the board with the exception of the FTSE100, which is taking its queue from a weaker session in Asia being led lower on commodity price concerns.
U.S stocks are expected to open little changed (+0.1%).
Indices: Stoxx50 -0.3% at 3616, FTSE +0.1% at 7255, DAX -0.3% at 12606, CAC-40 -0.2% at 5362, IBEX-35 -0.2% at 10995, FTSE MIB -0.2% at 21122, SMI -0.3% at 8953, S&P 500 Futures +0.1%.
2. Oil prices plummet, gold in demand
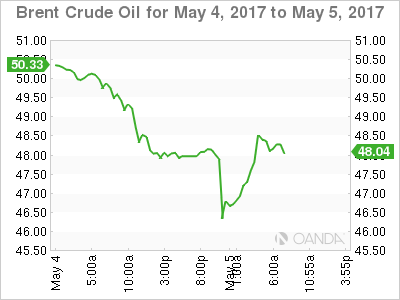
In the overnight session, oil prices have plunged to new five-month lows on the back of OPEC and other producers appearing to rule out deeper supply cuts to reduce the world's persistent glut of crude.
Brent crude futures are at +$47.88 per barrel, down -50c or -1% from Thursdays close. Prices fell to as low as +$46.64, the lowest since Nov. 30, while U.S West Texas Intermediate (WTI) crude oil futures are trading at +$44.92 per barrel, down -60c or -1.3%, after a more than -4% drop yesterday.
Note: WTI futures are below levels when OPEC and other producers agreed cuts late last November.
The market seems to agree that these steep price falls will likely force OPEC members to extend production cuts later this month, however, for the 'crude bulls' the prospect of deeper cuts continue to appear relatively slim.
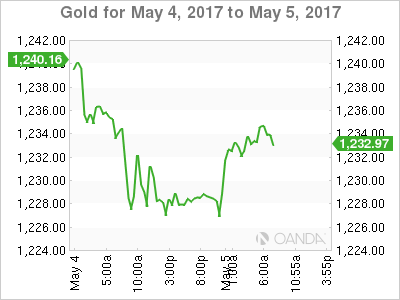
Gold (+0.5% to +$1,233.10 per ounce) is up on a safe-haven bid, but is on track for its worst week in six-months. On Thursday, the yellow metal printed its seven-week of +$1,225.20 an ounce.
Oil was not the only commodity that suffered. Chinese iron ore futures fell -7% after tumbling -8% yesterday on concerns that global commodity demand may fall sharply in the face of record supplies.
3. Global yields under pressure despite the overnight demand
Despite the overnight safe haven Asian demand, U.S Treasuries are under broad selling pressure, which has U.S 10's yields rallying to the highest in more than three-weeks (+2.36% vs. +2.31% on Wednesday).
Factors hurting the bond market include the follow-through of selling driven by the Fed's statement Wednesday leaving the door ajar for a rate hike next month, yesterday's report showing unit labor costs jumping by +3.0% in 1Q, a sign of inflation, and finally, the selloff in German bunds on a Emmanuel Macron win in this weekends second round French Presidential vote.
Currently, Fed fund futures are pricing in a +76% probability of a hike next month.
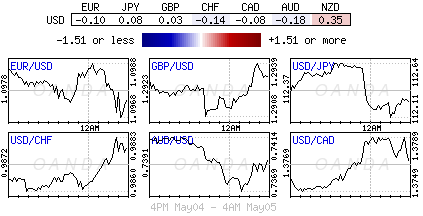
4. The 'big' dollar finds some support, but EUR has legs
Ahead of the U.S open, the EUR (€1.0952) has slipped lower outright, after earlier reaching a six-month high of €1.0992 when it stalled ahead of the psychological handle of €1.10.
However, a market favorable outcome in this weekend's French presidential election, in the form of victory for centrist Emmanuel Macron over far-right candidate Marine Le Pen, is likely to boost the 'single unit.' But, don't be surprised if the EUR gains are relatively limited since a Macron victory is widely expected.
Europe's single unit has garnered support this week on the back stronger regional data and on speculation that the ECB will begin reducing monetary stimulus sooner rather than later.
If this morning's NFP headline prints a below-forecast reading it's likely to see the €1.10 handle easily penetrated.
Elsewhere, sterling (£1.2937) is back above the psychological £1.29 level and recovering from losses from earlier in the week. The pound is benefiting from U.K local elections that suggest PM May's Conservative Party are on course for a sweeping victory at the upcoming Jun 8th Parliamentary election.
5. RBA's Quarterly Monetary Policy statement
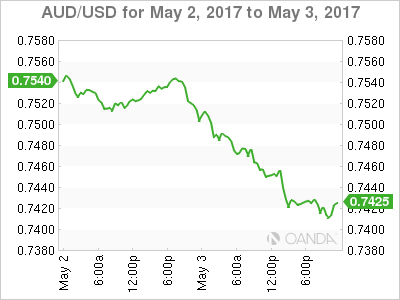
The Aussie central bank's latest policy statement overnight will be a challenge for the AUD 'bears' (A$0.7393).
The statement erred on the optimistic side with increased confidence in its base case for a return to +3% growth. It also anticipated edging down of unemployment and a view of modestly higher inflation. Fixed income dealers have not been pricing their yield curve as optimistically as the central bank's rhetoric.
However, it did reiterate their view that an appreciating AUD currency would complicate the economy's transition.
Oil Tanks, Greasing Sell-Offs Elsewhere
Although all attention is on the bonfire that is oil prices today, the oil price collapse is being felt across other asset classes.
The emotional week that had been the lot of commodity traders gave no respite today in Asia. The global sell-off in anything that seems to be dug or pumped out of the ground continued apace with Dalian iron ore futures in China limit down again for the 2nd day in a row. Shanghai steel futures were also smelted aggressively. But it was crude oil that took the centre of attention.
But it was crude oil that took centre stage. Both Brent and WTI followed last night's 5% sell-off with another quick fire 4 % tank to the downside as they broke their overnight New York lows. To their credit, both have since made all of those losses back to be almost unchanged from last nights close into Europe. The price action had a certain stop-loss smell about it with an algorithmic fill at the worst touch.
The reasons have been talked about extensively, but it is worth noting that oil by my reckoning is off around 9 % for the week leaving OPEC looking down the barrel (not an oil barrel), ahead of late Mays will they won't they meeting. Although today's bounce back has been impressive, it would be a brave man to pick the bottom of crude oil now. If this price action can't grease the wells for a production cut extension, I don't know what will.
The Europeans and the Japanese will probably not be happy either. Both are busily quantitatively easing, and their growth targets may come under severe pressure if China has in fact sneezed. A sustained commodity (read oil) sell-off may torpedo their inflation KPI's as well even if they can label it just “transitory.” This is a theme that few seem to have thought about yet.
Of course, it's not just oil that has felt the chill winds of potentially higher U.S. rate and a China slowdown. Copper has also been beaten out of shape, and the flow through from oil has made its presence felt in other markets. Maybe the saying that when the U.S. sneezes, the rest of the world catches a cold, should be swapped out with when China sneezes?
For some other markets with a high beaten beta to oil and hard commodities, the picture isn't so bright either.
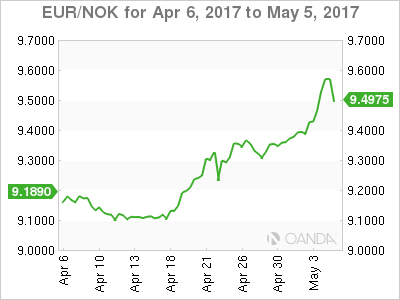
EUR/NOK
The NOK/Oil correlation trade has been back with a passion for the last couple of weeks. Being pretty much a one-way trade from 9.2000 two weeks ago, until the highs of 9.5800 today in Asia. Like both crudes, it has made a sprightly come back into Europe with NOK rallying to 9.4900 in early trading. With such a high correlation, it may have done enough for the week unless oil tanks again this evening.
Looking at the technicals, 9.5800 is, in fact, a double top and first resistance. Above this, we have a triple daily top from December from the 9.7400 region.
Support is hard to find with nothing until the 9.2500 breakout level and then 9.0700 which bisects the 100 and 200-day moving averages.
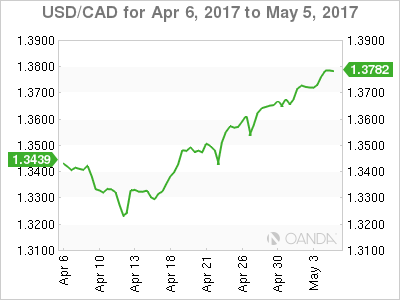
USD/CAD
Has rallied nearly 100 points in 24 hours from 1.3700 but has significantly, just failed ahead of 1.3800 today before rallying back to 1.3760. In the short term, its rally coincided with the bounce in oil after Asia's sell-off suggesting that at these levels, it may need crude to collapse again to make progress topside ahead of today's Non-Farm Payrolls.
Still, in the bigger picture, the chart does not make happy reading with asthmatic economic data, worries over mortgage lenders AND commodity prices combining to make the Loonie (CAD) look unloved still in the bigger picture.
USD/CAD has resistance at 1.3800 with a daily close implying a possible technical move to 1.4000. Support is found around 1.3600 and then 1.3525.
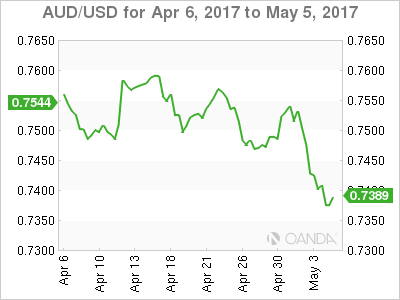
AUD/USD
The lucky country dollar finally succumbed to the iron ore, copper, gold, silver, oil sell-off today. Giving up support at 7400 to finish just below around 7390.
A daily close below the former implies AUD could move towards the 7300 level and then possibly 7150 after that. Resistance lies at the 7450 area and then 7550.
AUD's fate is tied to China's though, given that China buys everything that Australia digs out of the ground. China data, absent a lethargic RBA on the monetary policy front, should be followed closely. One could say that when/if China sneezes, Australia contracts TB.
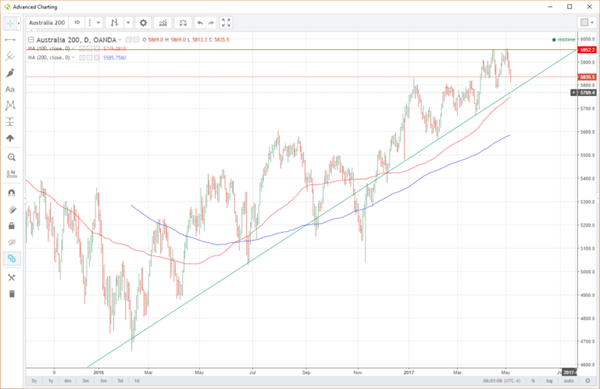
AUSTRALIA 200
Unsurprisingly the ASX 200 has been on the back foot all week. Even less surprisingly is that it has been led lower by mining and energy companies of which Australia has many. Today's move in oil and iron ore twisted the knife further in, but Australia has been grappling with other issues.
Most notably an over-valued property market in Sydney and Melbourne, with an increasing militant RBA willing to do something about it. Asthmatic unemployment and wage data leaving the RBA unable to raise rates to counter the above and reaching for the RBNZ's macro-prudential handbook.
The ASX is worthy of a full-colour high definition chart today. The technicals show the ascending triangle is looking in some danger now. The ASX has failed around 5950 four times now since March.
From its present 5835 level, we have initial support at 5785, the April lows. Below there the ascending line part of the triangle and solid support comes in at 5770 with the 100-day moving average just below that at 5749. This 5740/5775 area becomes must hold support in the bigger technical picture?
With multiple failures at 5950 and what looks like a looming test of longer term support, the question is, could this commodity sell-off induce the first long-term top in a developed stock market in well, a long time?
Commodity Sell-Off Weighs On Global Sentiment
The sharp depreciation in commodity prices overnight has weighed on risk sentiment, with global stocks poised to remain depressed on Friday as questions are raised over the health of the global economy. Asian shares have struggled to maintain gains and the lack of appetite for risk should expose European equities to further losses. Wall Street was mostly lower on Thursday after the sell-off in energy stocks, and may be positioned for steeper losses this afternoon as investors adopt a cautious approach ahead of the US Non-Farm Payroll data. With depressed oil prices, lingering geopolitical tensions, Brexit developments, and Trump uncertainties still weighing on sentiment, a pending stock market correction may be on the table.
Dollar static ahead of NFP
The Greenback was on standby during Friday’s trading session ahead of a crucial US Non-Farm Payroll data that may approve or dismiss the heated market speculations of a June interest rate increase. A solid US labour market data for April may compliment the Fed hawks and confirm expectations of a rate hike in June. However, if job growth fails to meet market forecasts and wage growth softens, the Dollar will find itself exposed to heavy losses as optimism over a June interest rate hike fades. From a technical standpoint, the Dollar Index remains on the back foot on the daily charts. Sellers have exploited the technical bounce to drag the Greenback lower. The pending NFP report will heavily impact where the Dollar Index concludes this week, with traders carefully observing the 98.80 support and 99.40 resistance.
Euro bulls make an early appearance
The increasing expectation that Emmanuel Macron will be the next French President has installed Euro bulls with enough confidence to send the EURUSD to a fresh six-month high at 1.099. With the current polls showing Macron holding a solid 20 point lead over Marine Le Pen, I may not be the only one saying that a Macron victory has already been 'baked in' to the markets. Since markets are widely expecting Macron to be declared victorious, we would see some additional support for the EU currency, but further gains could be limited after the rally seen in the Euro since the first round of voting. I still feel markets should remain diligent and investors cautious as the threat of a Trump-style victory for Marine Le Pen would create tremors across the financial markets. From a technical standpoint, the EURUSD is heavily bullish on the daily charts and a breakout above 1.1000 should open a path towards 1.1100.
WTI Crude under renewed selling pressure
WTI Crude received a pummelling this week with prices sinking deeper into the abyss during early trading on Friday due to heightened concerns over the oversupply of oil in global markets. The bearish price action on WTI clearly questions the market confidence over OPEC’s ability to stabilize the saturated markets, with discussions being raised of whether the supply extension may have any positive impact on oil prices. With the aggressive pumping of US Shale contributing to oversupply woes, WTI Crude remains fundamentally bearish moving forward. From a technical standpoint, WTI Crude remains under intense selling pressure, with the next level of interest at $43. In an alternative scenario, previous support at $47 could transform into a dynamic resistance that encourages a decline back towards $44 and $43 respectively.
Commodity spotlight – Gold
The prospect of higher US interest rates continues to pressure Gold with the zero-yielding metal hovering around $1232 as of writing. A touch of optimism over Emmanuel Macron winning the second round of the French Presidential election has complimented the downside, as the risk-on trading mood limited the attraction for safe-haven investments. Although geopolitical tensions and uncertainty over Brexit and Trump may support the metal in the medium to longer term, short term bears remain in firm control. With Gold potentially finding itself dictated by US rate hike expectations, further downside should be expected as the Federal Reserve maintains a hawkish stance. The yellow metal is at risk of depreciating further if a solid Non-Farm Payroll report this evening confirms expectations of a June interest rate hike.
Market Update – European Session: US Non-Farm Payrolls Expected To Rebound In April
Notes/Observations
Focus on US Apr Payroll report with jobs seen rebounding and wages rising
Macron increases poll lead as French presidential campaign enters into home-stretch
UK PM May's Conservatives make gains in local elections
Overnight:
Asia:
RBA Quarterly Statement on Monetary Policy (SOMP): Inflation and GDP forecast little changed from Feb statement. Reiterates view that appreciating AUD currency would complicate their economies transition
Japan, China and South Korea's Trilateral financial leaders: Will resist all forms of protectionism; agreed that trade is the most important engines of economic growth
US House passes bill that would expand sanctions against North Korea. Voted 419-1 to impose new sanctions that target North Korea shipping industry and use of slave labor.
Europe:
Parliamentary By-Election results: Tories making early gains. Conservatives have gained control of five councils while Labour have lost control of two. Liberal Democrats have lost several seats. UKIP has lost all the seats it has been defending so far
German Finance Ministry: There is no debt relief being prepared for Greece at this time
EMMI Industry Body Report on Euribor Administration: Will work in coming months to develop new hybrid methodology based on transactions. Discard Euribor rate reform following market test that showed impact on volatility and volumes
Americas:
House of Representatives passes ACHA Obamacare healthcare replacement bill (Yeas 217, nays 213 (20 GOP no votes, no Democrats voted in favor of it). Bill now sent to the Senate for consideration
Senate passed the $1.1T omnibus spending bill (vote was 79-18) to fund govt through end of Sept, as expected. bill now goes to President Trump for signature
Energy:
OPEC and Non-OPEC producers expected agree to a six month extension of output cut agreement, but not likely to increase the size of the cut from current 1.8M bpd
Economic Data
(CH) Swiss Apr Foreign Currency Reserves (CHF): 695.9B v 690.5Be
(SE) Sweden Mar Industrial Production M/M: 0.3% v 0.6%e; Y/Y: 3.8% v 3.4%e
(HK) Hong Kong Mar Retail Sales Value Y/Y: +3.1% v -0.9%e (first rise since Feb 2015); Retail Sales Volume Y/Y: +2.7% v -1.0%e
Fixed Income Issuance:
(IN) India sold total INR150B vs.INR150B indicated in 2022, 2029, 2033 and 2055 bonds
SPEAKERS/FIXED INCOME/FX/COMMODITIES/ERRATUM
Equities
Indices [Stoxx50 -0.3% at 3616, FTSE +0.1% at 7255, DAX -0.3% at 12606, CAC-40 -0.2% at 5362, IBEX-35 -0.2% at 10995, FTSE MIB -0.2% at 21122, SMI -0.3% at 8953, S&P 500 Futures +0.1%]
Market Focal Points/Key Themes European indices trade off the session lows but lower across the board with the exception of the FTSE100, taking queue from a weaker session in Asia overnight being led lower on commodity price concerns. Airline stocks are outperforming this morning with IAG and Air France trading at year highs, and Easyjet trading higher following strong April Metrics. April US Non Farm Payrolls will be the main focus looking ahead, as well as another bout of earnings, notably from Cigna and Cognizent Tech and
Equities
Consumer discretionary [ International Consolidated Airlines [IAG.UK] +5% (Earnings, April metrics), Marks and Spencer [MKS.UK] +5.4% (Names new Chairman), Pearson [PSON.UK] +11% (Q1 update, Affirms outlook, simplification plan), Easyjet [EZJ.UK] +3.5% (April metrics), Heidelberger Druck -5% (Earnings)]
Industrials: [Evonik [EVK.DE] -1% (Earnings), Skanska [SKAB.SE] flat (Earnings), Porr [ABS2.DE] -4%, Strabag[STR.AT] -4% (report that it has been raided on collusion suspicions)]
Telecom: [Telefonica Deutschland [O2D.DE] -6% (Earnings)] - Healthcare: [Smith & Nephew +3.0% (Q1 results)]
Utilities: [Engie [ENGI.FR] -1.4% (Earnings)]
Speakers
Italy Stats Agency (ISTAT) Monthly Economic Note: Leading indicator is positive but showing some deceleration. Economic growth was more constrained compared to previous months
German Bundesbank's Dombret (ECB SSM member): Most bankers expect a hard or very hard Brexit
Czech PM Sobotka: will NOT submit his resignation (withdraws offer); proposed to dismiss his finance minister Babis
Indonesia Economic Affairs Min Nasution: 2017 GDP Growth seen between 5.2%-5.3% range. Exports to be main driver of growth, along with household consumption and govt spending
Saudi Oil Min Al-Falih commented after speaking with Russia's Energy Min Novak of a growing consensus among OPEC and Non-Opec members on need to continue re balancing the oil market . Both Russia and Saudi ministers to meet in Beijing within 10 days to discuss oil markets
Currencies
USD on some soft footing against the European pairs heading into the April US payroll data. Yield divergence
EUR/USD edging towards the key psychological 1.10 level. Analyst cited commentary from ECB chief economist Praet on Thursday and appearing to be shifting guidance into a data dependent approach. Praet hinted at more upbeat economic assessment as growth firmed up
The GBP/USD was back above the 1.29 level and recovering from losses from earlier in the week. GBP benefiting from UK local elections which suggested PMMay's Conservative Party was on course for a sweeping victory at the upcoming Jun 8th Parliamentary election. If May does secure a laeger majority in Parliament then that could help give her a better hand while negotiating a Brexit deal with the European Union victory
Fixed Income
Bund futures trade at 161.15 up 18 ticks but still near the week's low. A break of 160.64 support level could see lows target 160.41 followed by 159.01. Resistance remains near the 161.88 level followed by 163.54.
Gilt futures trade at 128.11 higher following a range bound trading week. A continuation of the pullback from the 129.14 April 18th high has price eyeing the 127.50 support level. An acceleration lower could test the 126.62 region. Resistance stands at 128.49 then 128.81 followed by 129.14.
Friday's liquidity report showed Thursday's excess liquidity rose to €1.649T a gain of €4B from €1.645T prior. Use of the marginal lending facility dropped to €312M from €340M prior.
Corporate issuance saw over $10.6B come to market via 5 issues headlined by Apple's $7B 6-part senior unsecured note offering and Northern Trust $2.25B in a 3-part senior unsecured note offering. For the week ending May 3rd Lipper US fund flows reported IG funds net inflows $1.05B bringing YTD inflows to $49.1B, High yield funds reported outflows of $385.6M bringing YTD outflows to $4.37B.
Looking Ahead
(PT) Portugal Debt Agency (IGCP) possible announcement for upcoming auction
(RO) Romania Central Bank (NBR) Interest Rate Decision: Expected to leave Interest Rates unchanged at 1.75%
06:00 (IE) Ireland Apr Live Register Monthly Change: No est v -3.9K prior
06:00 (IE) Ireland Mar Industrial Production M/M: No est v -15.5% prior; Y/Y: No est v -9.9% prior
06:00 (UK) DMO to sell combined £2.5B in 1-month, 3-month and 6-month bills (£0.5B, £0.5B and £1.5B respectively)
06:45 (US) Daily Libor Fixing
07:30 (CL) Chile Mar Economic Activity Index (Monthly GDP) M/M: -0.2%e v -0.7% prior; Y/Y: -0.4%e v -1.3% prior
07:30 (IN) India Weekly Forex Reserves
08:00 (PL) Poland Apr Official Reserves: No est v $112.0B prior
08:00 (CL) Chile Mar Nominal Wage M/M: +0.4%e v -0.4% prior; Y/Y: 4.0%e v 4.2% prior
08:00 (RO) Romania Central Bank gov Isarescu post rate decision press conference
08:15 (UK) Baltic Dry Bulk Index
08:30 (US) Apr Change in Nonfarm Payrolls: +190Ke v +98K prior, Change in Private Payrolls: +190Ke v +89K prior, Change in Manufacturing Payrolls: +10Ke v +11K prior
08:30 (US) Apr Unemployment Rate: 4.6%e v 4.5% prior, Underemployment Rate: No est v 8.9% prior, Change in Household Employment (civilian labor force): No est v +160.2K prior, Civilian Labor Force Participation Rate: No est v 63.0 prior
08:30 (US) Apr Average Hourly Earnings M/M: 0.3%e v 0.2% prior; Y/Y: 2.7%e v 2.7% prior; Average Weekly Hours: 34.4e v 34.3 prior
08:30 (CA) Canada Apr Net Change in Employment: +10.0Ke v +19.4K prior; Unemployment Rate: 6.7%e v 6.7% prior
09:00 (EU) EU Foreign Min Mogherini in Italy
09:00 (DE) German Chancellor Merkel campaigns in Schleswig-Holstein (State election)
10:00 (CA) Canada Apr Ivey Purchasing Managers Index (Seasonally Adj): No est v 61.1 prior
10:20 (BR) Brazil Apr Vehicle Production: No est v 234.8K prior; Vehicle Sales: No est v 189.2K prior; Vehicle Exports: No est v 68.5K prior
12:30 (IT) Italy PM Gentiloni in Italy
-12:45 (US) Fed's Williams (non-voter) speaks in Keynote in New York
13:00 (US) Weekly Baker Hughes Rig Count data
13:30 (US) Fed's Rosengren (non-voter) with members Evans (Voter) and Bullard (non-voter) on panel
13:30 (US) Fed Chair Yellen at Brown University
15:00 (US) Mar Consumer Credit: $14.0Be v $15.2B prior
15:00 (MX) Mexico Citibanamex Survey of Economists
20:00 (CO) Colombia Apr CPI M/M: 0.4%e v 0.5% prior; Y/Y: 4.6%e v 4.7% prior
20:00 (CO) Colombia Apr CPI Core M/M: No est v 0.6% prior; Y/Y: No est v 5.1% prior
Weekend data
(CN) China Apr Trade Balance (CNY terms): 197.2Be v 164.3B prior; Exports Y/Y: 16.8%e v 22.3% prior; Imports Y/Y: 18.0%e v 20.3% prior:
(CN) China Apr Trade Balance (USD terms): No est v $23.9B prior
(CH) China Apr Foreign Reserves: $3.020Te v 3.009T prior
Weekend Events:
Sun (FR) France hold 2nd round of Presidential election
GOLD Strong Selling Pressures, SILVER Important Selling Pressures, CRUDE OIL Collasping.
GOLD Strong selling pressures.
Gold continues its decline after the yellow metal has faded near the hourly resistance at 1295 (18/04/2017 high). Hourly support located at 1260 (26/04/2017 low) has been broken. The road is wide-open for further decline.
In the long-term, the technical structure suggests that there is a growing upside momentum. A break of 1392 (17/03/2014) is necessary ton confirm it, A major support can be found at 1045 (05/02/2010 low).
SILVER Important selling pressures.
Silver continues its decline. Strong support given at 16.82 (15/03/2017 low) has been broken. Strong resistance is given at a distance at 19.00 (09/11/2017 high). Expected to see continued bearish pressures until at least $16.
In the long-term, the death cross indicates that further downsides are very likely. Resistance is located at 25.11 (28/08/2013 high). Strong support can be found at 11.75 (20/04/2009).
CRUDE OIL Collasping.
Crude oil has broken key support given at 47.01 (22/01/2017 low). The road is wide-open towards support given at 42.20 (14/11/2017 low).
In the long-term, crude oil has recovered after its sharp decline last year. However, we consider that further weakness are very likely. Strong support lies at 24.82 (13/11/2002) while resistance can now be found at 55.24 (03/01/2017 high).
EUR/JPY Breaking Resistance At 123.31, EUR/GBP Trading Sideways, EUR/CHF Selling Pressures Arise.
EUR/JPY Breaking resistance at 123.31.
EUR/JPY's buying pressures are there. Strong resistance standing at 123.31 (27/01/0217 high) has been broken. Major support is given at 114.90 (18/04/2017low). Expected to see further increase towards key resistance given at 124.10 (15/12/2017 high),
In the longer term, the technical structure validates a medium-term succession of lower highs and lower lows. As a result, the resistance at 149.78 (08/12/2014 high) has likely marked the end of the rise that started in July 2012. Strong support at 94.12 (24/07/2012 low) looks nonetheless far away.
EUR/GBP Trading sideways.
EUR/GBP is trading mixed. The technical structure remains negative as long as the resistance at 0.8530 (25/04/2017 low) holds. Expected to show continued weakness until support given at 0.8304 (05/12/2017 low).
In the long-term, the pair has largely recovered from recent lows in 2015. The technical structure suggests a growing upside momentum. The pair is trading above from its 200 DMA. Strong resistance can be found at 0.9500 psychological level.
EUR/CHF Selling pressures arise.
EUR/CHF's selling pressures are increasing. Despite the sharp increase and the recent bullish breakout which is very likely psychological, we believe that the medium-term pattern suggests us to see at some point renewed bearish pressures towards key support that can be found at 1.0623 (24/06/2016 low).
In the longer term, the technical structure is mixed. Resistance can be found at 1.1200 (04/02/2015 high). Yet,the ECB's QE programme is likely to cause persistent selling pressures on the euro, which should weigh on EUR/CHF. Supports can be found at 1.0184 (28/01/2015 low) and 1.0082 (27/01/2015 low).
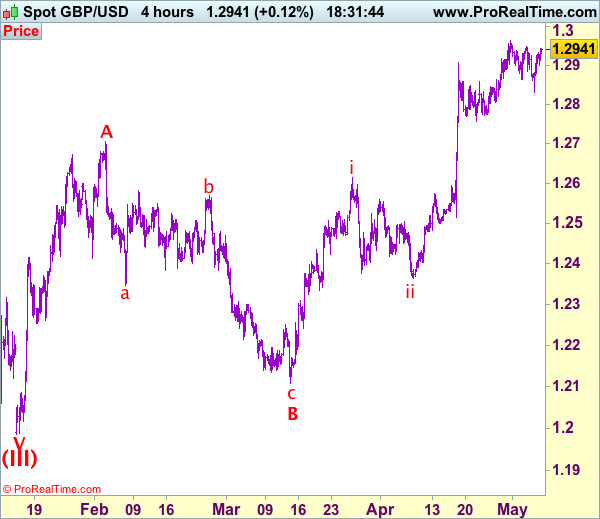
Trade Idea: GBP/USD – Buy at 1.2775
GBP/USD – 1.2935
Recent wave: Wave V of larger degree wave (III) has ended at 1.1986 and major correction has commenced from there for gain to 1.3000 and 1.3140-50
Trend: Near term up
Original strategy :
Buy at 1.2865, Target: 1.3025, Stop: 1.2805
Position: -
Target: -
Stop: -
New strategy :
Buy at 1.2775, Target: 1.2965, Stop: 1.2715
Position: -
Target: -
Stop:-
Although cable has rebounded after finding support at 1.2831, break of recent high at 1.2965 is needed to confirm recent upmove has resumed and extend further gain to psychological resistance at 1.3000 but overbought condition should limit upside to 1.3050 and price should falter below 1.3100. If said resistance at 1.2965 continues to hold, then further choppy trading would take place and another corrective fall to 1.2831 cannot be ruled out, however, reckon 1.2770-75 would limit downside and bring another rise later. We are keeping our view that the wave c as well as larger degree wave B has ended at 1.2109, hence impulsive wave C has commenced from there with wave i of C ended at 1.2616, follow by a correction to 1.2365 (end of wave ii) and wave iii rally is unfolding, hence further gain to indicated upside targets would be seen.
Our preferred count on the daily chart is that cable's rebound from 1.3500 (wave (A) trough) is unfolding as a wave (B) with A ended at 1.7043, followed by triangle wave B and wave C as well as wave (B) has ended at 1.7192, the subsequent selloff is the larger degree wave (C) which is still unfolding with minor wave (III) of larger degree wave 3 ended at 1.1986, hence wave (IV) correction is in progress which could either be a triangle wave (IV) of a complex formation but upside should be limited to 1.3500 and price should falter well below 1.4000, bring another decline in wave (V) of 3 for weakness to 1.1500, then 1.1200.
On the downside, below said support at 1.2831 would bring weakness to support at 1.2805 but reckon downside would be limited and support at 1.2757 should hold, bring another rise later. A drop below this support would defer and signal a temporary top is formed instead, risk correction of recent upmove to 1.2700-10 later.
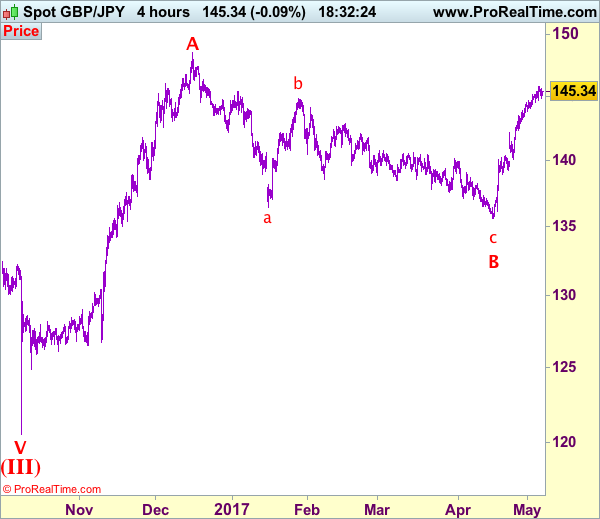
Trade Idea: GBP/JPY – Buy at 143.30
GBP/JPY - 145.30
Recent wave: Medium term low formed at 120.50 and (A)-(B)-(C) major correction has commenced with (A) leg ended at 148.45, hence wave (B) is unfolding for retreat to 131.00-10.
Trend: Near term up
Original strategy:
Buy at 144.50, Target: 146.50, Stop: 143.90
Position: -
Target: -
Stop: -
New strategy :
Buy at 142.55, Target: 145.00, Stop: 141.95
Position: -
Target: -
Stop:-
As sterling has continued trading with a firm undertone, adding credence to our bullish count that recent upmove from 135.60 is still in progress and may extend further gain to 146.00-10, then 146.50, however, near term overbought condition should limit upside to 147.00-10 and price should falter well below previous chart resistance at 148.45, bring retreat later.
In view of this, would not chase this rise here and would be prudent to buy sterling on pullback, below 144.50 would bring correction to 143.80 and possibly towards support at 143.15, however, reckon downside would be limited to 142.50-55 and price should stay well above previous resistance at 142.10-15, bring another upmove later.
Our preferred count is that larger degree wave V with circle is unfolding from 251.12 with wave (I) 219.34, (II): 241.38 and wave (III) is subdivided into 1: 192.60, 2: 215.89 (23 Jul 2008) and wave 3 ended at 118.87 earlier in 2009. The correction from there to 162.60 is wave 4 which itself is a double three and is labeled as first a-b-c ended at 151.53, followed by wave x at 139.03, 2nd a ended at 162.60, 2nd b at 146.75 and 2nd c leg of wave 4 ended at 163.00. Therefore, the decline from 163.00 to 116.85 is now treated as wave 5 which also marked the end of larger degree wave (III), hence wave (IV) major correction has commenced for retracement of the wave (III) from 241.38 and upside target at 183.95-00 (50% Fibonacci retracement of the wave (II) from 241.38) had been met, a drop below 160.00 would suggest wave (IV) has ended at 195.85, bring decline in wave (V) for initial weakness to 130 (already met) and 120.