Sample Category Title
Canadian Employment Up Again in April But Wages Continue to Underperform
Highlights:
- Employment rose 3k in April and the unemployment rate declined to 6.5%.
- The increase in hiring was led by a 34k jump in part-time employment offsetting a 31k drop in full-time employment. It remains the case that most jobs created over the last year have been full-time.
- The labour force participation rate ticked lower (65.6% versus 65.9% in March). The rate for prime-aged 25-54 year old workers also ticked lower but was still up 0.4 ppts from a year ago.
- Hours worked were up 1.1% from a year ago, up from 0.7% in March and the strongest increase since November 2016.
Our Take:
The headline employment gain was modest in April (a negligible 3k in a monthly survey with very wide confidence bands around spot monthly estimates); however, the tick higher is nonetheless notable in that it continues an unusual streak of positive monthly readings. Employment has now increased in 15 of the last 17 months with growth over the last year averaging a solid 23k per month. The details of the monthly report for April were mixed (with a sharp pull-back in full-time jobs offset by stronger part-time employment) but, on average, more than two-thirds of job gains over the last year have been of the full-time variety. A drop in the number of people participating in labour markets was largely responsible for a drop in the unemployment rate to a new cycle-low at 6.5% in April; however, participation of 'prime-aged' 25-54 year-old workers ticked only modestly lower from record levels in March and was still up 0.4 percentage points from a year ago.
The fly in the ointment continues to be weak wage growth with year-over-year growth in average hourly earnings for permanent employees slipping to its lowest level on record (again) in April at 0.5%. The weak wage growth is in sharp contrast to what would otherwise appear to be a labour market with little or no slack remaining. To be sure, other measures of wages have been stronger (wage growth in the alternative 'SEPH' employment survey was 2.4% year-over-year in February) but weaker numbers today from a wage perspective will likely continue to worry the Bank of Canada.
Canada’s Job Creation Streak Fades in April
Canada's hot streak of job creation faded in April, with only 3.2k jobs added on the month. Despite the modest uptick in employment, the unemployment rate fell by 0.2 percentage points to 6.5% - the lowest level since October 2008 - as 45.5k left the labour force.
Full-time employment declined 31.2k after four months of strong gains, with part-time gains more than offsetting, up 34.3k on net.
Public sector hiring surged, up 35.2k while private sector saw large declines of 50.5k, erasing nearly all of the gains seen this year and breaking the seven-month trend of private sector outperformance. The rise in self-employment continued, matching last months gain, up 18.5k positions on net.
Goods-producing sectors continued to rebound, albeit at a much slower pace, adding 4.3k on the month. Agriculture (+4.3k) and natural resources (+1.4k) were the outperformers, while construction hiring slowed to just 600 jobs. Both manufacturing (-600) and utilities (-1.5k) saw declines. Service sectoring hiring was little changed, dropping 1k, as declines in business support (-18.7k), accommodation & food (-12.3k), and trade (-8.8k) more than offset the gains in education (+19.3k), health care (+12.4k) and transport (+8.8k).
British Columbia took the top spot this month, adding 11.3k positions, with Newfoundland & Labrador (+1.9k) and P.E.I. (+800) rounding out the only provincial gainers. The remainder of the provinces lost jobs on the month, with Quebec (-3.8k), Saskatchewan (-2.2k) and New Brunswick (-2.0k) showing the largest net losses.
Hours worked continued to accelerate to 1.1% y/y in April from 0.7% y/y in the previous month. On the other hand, hourly wages continued to weaken, up just 0.5% y/y - or just half of its first-quarter pace.
Key Implications
This was not a great employment report. After several months of strong gains the Canadian job machine slowed in April, coming in well below expectations for a 10k increase. The details were even less encouraging, with all of the gains coming from part-time jobs. Moreover, the unemployment rate, while at its lowest level in nine years, declined for the 'wrong' reason as people left the labour force and participation rate declined to its lowest level since the summer of 2016.
While the goods-sector hiring was welcome, it came solely from small and volatile agriculture sector, while the remainder of goods producing industries seeing little change. Moreover, service-sector weakness continued for the second straight month with education & health coming to the rescue as many others cut jobs. Wage data was also discouraging, given the mix of job creation concentrated in part-time positions, with the pace of wage gains decelerating to its slowest pace on record.
Despite the decline in unemployment, this report is unlikely to encourage the BoC to change its dovish tone on the outlook for the economy and Canadian monetary policy. In particular, the soft wage data will underscore the likely cool-off in consumption over the medium-term. At the same time, the poor showing in manufacturing underscores the rising uncertainty about Canada's trade relationship with its largest trading partner, and may delay the rotation of growth towards exports.
Trade Idea Update: USD/CHF – Stand aside
USD/CHF - 0.9890
New strategy :
Stand aside
Position : -
Target : -
Stop : -
Yesterday’s selloff after meeting renewed selling interest at 0.9957 together with the breach of support at 0.9891-93 confirm recent decline from 1.0108 top has resumed and bearishness remains for further weakness to support at 0.9831 and possibly towards 0.9800, however, near term oversold condition should prevent sharp fall below 0.9770, risk from there is seen for a rebound later.
In view of this, would not chase this fall here and would be prudent to stand aside in the meantime. Above the Kijun-Sen (now at 0.9908) would bring recovery to 0.9925-30 but price should falter well below said resistance at 0.9957, bring another decline later. Only break of 0.9966-69 resistance would signal low is formed instead, bring subsequent bounce to 1.0000-08 later.
Trade Idea Update: GBP/USD – Buy at 1.2885
GBP/USD - 1.2944
Original strategy :
Buy at 1.2865, Target: 1.2965, Stop: 1.2830
Position : -
Target : -
Stop : -
New strategy :
Buy at 1.2885, Target: 1.2985, Stop: 1.2850
Position : -
Target : -
Stop : -
As cable has staged a strong rebound after finding support at 1.2831 yesterday, signaling the pullback from 1.2965 has ended at 1.2831, bring retest of 1.2965, once this level is penetrated, this would confirm recent upmove has resumed and extend further gain to 1.2990-00 (1.236 times projection of 1.2109-1.2616 measuring from 1.2365 and psychological resistance), then towards 1.3040-50 which is likely to hold from here.
In view of this, would not chase this rise here and would be prudent to buy cable on pullback as 1.2880-85 should limit downside and bring another rise later. Only break of said support at 1.0831 would abort and signal a temporary top has been formed, bring retracement of recent upmove to 1.2790-95 (38.2% Fibonacci retracement of 1.2515-1.2965) but support at 1.2740-50 (50% Fibonacci retracement) should hold.
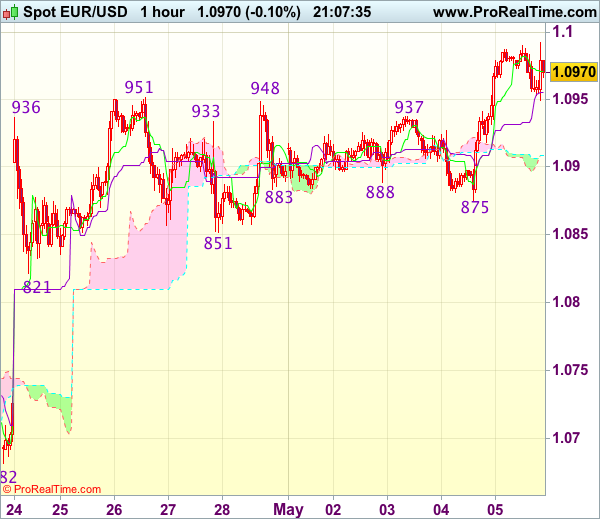
Trade Idea Update: EUR/USD – Buy at 1.0920
EUR/USD - 1.0974
Original strategy :
Buy at 1.0920, Target: 1.1020, Stop: 1.0885
Position : -
Target : -
Stop : -
New strategy :
Buy at 1.0920, Target: 1.1020, Stop: 1.0885
Position : -
Target : -
Stop : -
Euro finally broke above indicated resistance at 1.0951 (last week’s high), confirming our view that recent upmove from 1.0340 low has resumed and bullishness remains for this move to extend further gain to 1.1000, then towards 1.1025 (50% projection of 1.0602-1.0951 measuring from 1.0851) but reckon upside would be limited to 1.0050-60, risk from there is seen for a retreat later.
In view of this, would not chase this move here and would be prudent to buy euro on subsequent pullback as 1.0915-20 should limit downside. Only below support at 1.0875 (yesterday’s low) would abort and signal top is formed instead, bring correction to support at 1.0851 but price should stay above 1.0821 support, bring another rise later.
US: Job Growth Bounces Back in April
Non-farm payrolls rose by 211k in April, above the consensus estimate of 190k. Private-sector hiring expanded by 194k, while 17k were added to government payrolls.
The unemployment rate fell to 4.4%, the lowest level since May 2007, as the labor force participation edged down 0.1 percentage points to 62.9%.
Revisions were minor, subtracting 6k from payrolls on average in the previous two months.
Goods-producing employment rose a robust 21k, led by mining and logging, which added 10k - marking the sixth straight months of gains for the sector. Manufacturing added 6k, while construction added 5k. Services-producing employment rose 173k, led by gains in leisure and hospitality (+55k), education and health (+41k), and business services (+39k).
Average hourly earnings rose a healthy 0.3%, but the year-on-year metric edged down to 2.5% from 2.6% in March. Average weekly earnings were up a robust 0.6%, as hours of work edged up to 34.4 hours a week.
Key Implications
The American job machine returned to form in April. The re-acceleration in job should assuage fears that economic growth is slowing in any meaningful way. This confirms the Federal Reserve's message this week that the economy remains on track.
With unemployment pushing below its natural long-run rate, the participation rate remains an important indicator to watch. It's pullback in April, while slight, is not a great sign for those who believe the labor market still has a lot of cyclical slack remaining.
At 2.5%, wage growth is not yet flashing red signals, but is still sufficient to provide real gains in purchasing power. This should flow through to spending in the months ahead, providing the impetus for stronger economic growth.
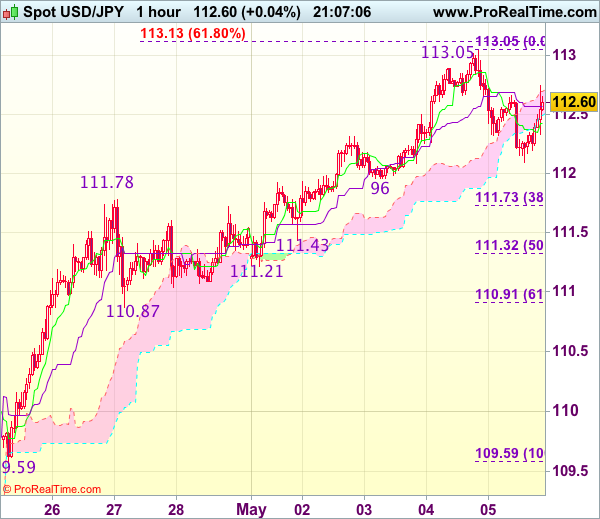
Trade Idea Update: USD/JPY – Stand aside
USD/JPY - 112.59
Original strategy :
Exit long entered at 112.20,
Position : - Long at 112.20
Target : -
Stop : -
New strategy :
Stand aside
Position : -
Target : -
Stop : -
Although the greenback has rebounded after finding support at 112.09 and gain towards 112.90-00 cannot be ruled out, break of yesterday’s high at 113.05 is needed to confirm recent upmove has resumed and extend gain to 113.10-15 (61.8% projection of 108.13-111.78 measuring from 110.87) but reckon upside would be limited to previous resistance at 113.54 and price should falter well below 113.90-00.
In view of this, would not chase this rise here and would be prudent to stand aside for now. Below 112.09 support would bring test of 111.96 but break of this level is needed to signal a temporary top has been formed at 113.05, bring correction to 111.73-78 (38.2% Fibonacci retracement of 109.59-113.05 and previous resistance), however, reckon 111.21-32 (previous support and 50% Fibonacci retracement) would contain weakness.
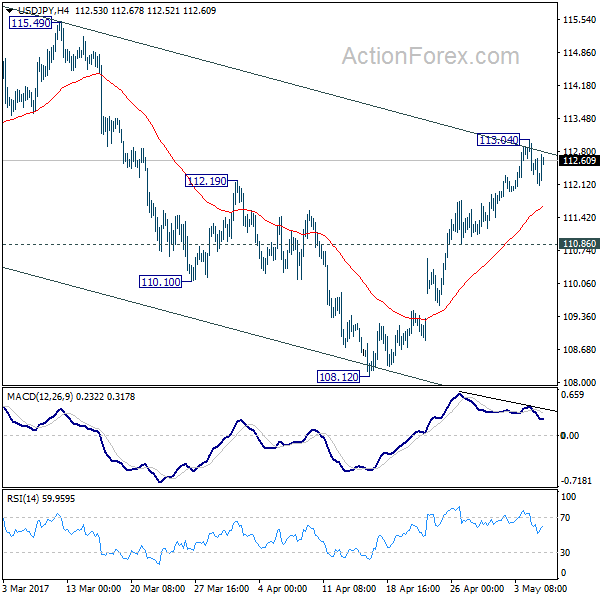
USD/JPY Mid-Day Outlook
Daily Pivots: (S1) 112.16; (P) 112.61; (R1) 112.90; More...
Intraday bias in USD/JPY remains neutral for consolidation below 113.04 temporary top. Further rise is still expected as long as 110.86 support holds. We'd holding on to the view that corrective fall from 118.65 has completed with three waves down to 108.12 already. Break of 113.04 will target 115.49 resistance. Firm break there will resume larger rally from 98.97 to 125.85 high. However, break of 110.86 support will keep USD/JPY inside near term falling channel and will turn bias back to the downside for 108.12 and below to extend the decline from 118.65.
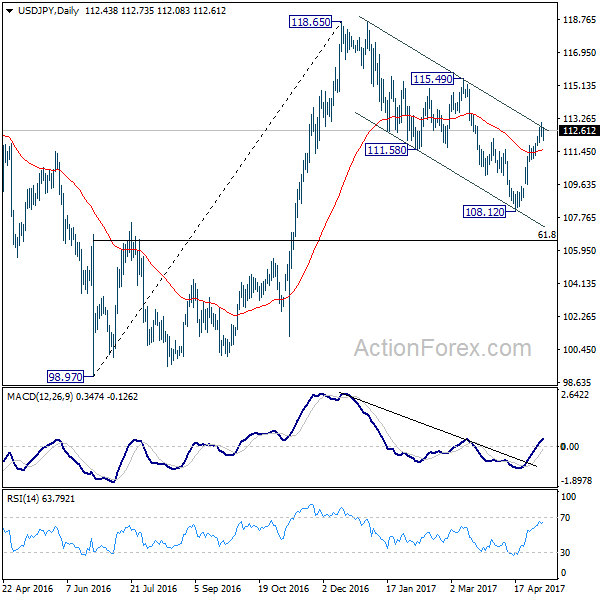
In the bigger picture, price actions from 125.85 high are seen as a corrective pattern. It's uncertain whether it's completed yet. But in case of another fall, downside should be contained by 61.8% retracement of 75.56 to 125.85 at 94.77 to bring rebound. Meanwhile, break of 115.49 resistance will extend the rise from 98.97 to retest 125.85. Overall, rise from 75.56 is still expected to resume later after the correction from 125.85 completes.
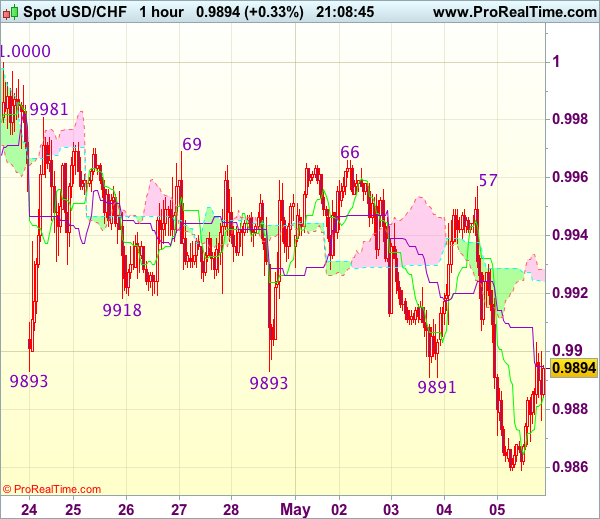
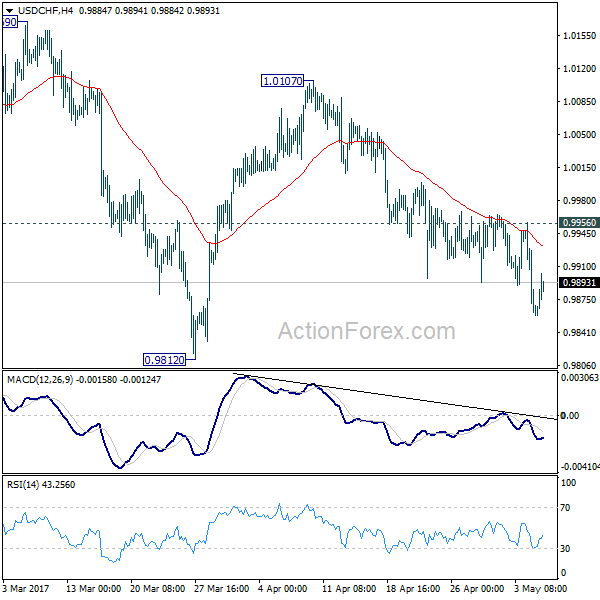
USD/CHF Mid-Day Outlook
Daily Pivots: (S1) 0.9830; (P) 0.9894; (R1) 0.9925; More.....
Intraday bias in USD/CHF remains on the downside for 0.9812 support and below. Note again that price actions from 1.0342 are seen as a correction. Break of 0.9812 should be brief and we will look for bottoming signal below there. On the upside, break of 0.9956 resistance will suggest that fall from 1.0107 is completed and turn bias back to the upside for this resistance.
In the bigger picture, we're still maintaining that firm break of 1.0342 key resistance is needed to confirm underlying bullish momentum in the pair. However, the corrective nature of the fall from 1.0342 is starting to give the medium term outlook a bullish favor. Hence, in stead of looking for topping signal around 1.0342, we'd now pay closer attention to upside acceleration as USD/CHF approaches this level again.
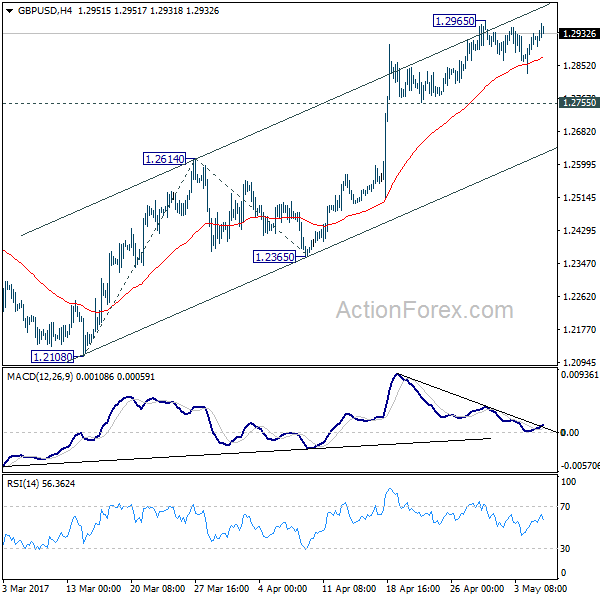
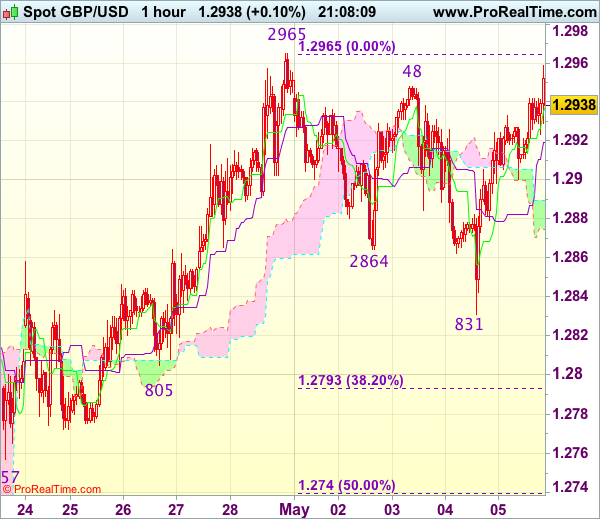
GBP/USD Mid-Day Outlook
Daily Pivots: (S1) 1.2855; (P) 1.2893; (R1) 1.2958; More...
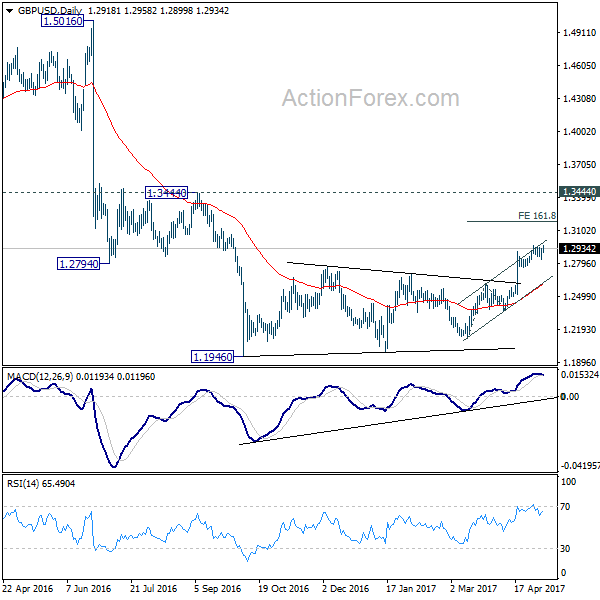
Intraday bias in GBP/USD remains neutral as it's still bounded in range below 1.2965 temporary top. Further rise remains in favor with 1.2755 support intact. Break of 1.2965 will target 161.8% projection of 1.2108 to 1.2614 from 1.2365 at 1.3184. At this point, price actions from 1.1946 are still seen as a correction pattern. Therefore, we'd expect strong resistance below 1.3444 to bring larger down trend resumption. On the downside, break of 1.2755 minor support will turn bias to the downside. Further break of 1.2614 resistance turned support will now indicate near term reversal.
In the bigger picture, fall from 1.7190 is seen as part of the down trend from 2.1161. There is no sign of medium term reversal yet. Sustained trading below 61.8% projection of 2.1161 to 1.3503 from 1.7190 at 1.2457 will target 100% projection at 0.9532. Overall, break of 1.3444 resistance is needed to confirm medium term bottoming. Otherwise, outlook will remain bearish.