
Sample Category Title
Currencies: EUR/USD Near 1.10 Barrier
Sunrise Market Commentary
- Rates: Commodity weakness takes a grip on global risk sentiment
Oil and other commodities took another hit and start affecting global sentiment. The US Note future profits. A very strong payrolls report will be needed to push the US Note future below 125-04+/03+ support, if commodity weakness remains today's trading theme. We expect a near-consensus outcome though and have a positive intraday bias for core bonds. - Currencies: EUR/USD near 1.10 barrier
The dollar hardly profited from rising market expectations on a June Fed rate hike yesterday. Weaker risk sentiment due to a sell-off in commodities weighs more on the dollar than on the euro. US payrolls are in focus today. If risk sentiment deteriorates further, the payrolls will probably have to be very strong to change fortunes in favour of the dollar
The Sunrise Headlines
- US stock markets ended a second straight session nearly unchanged, failing to profit from European optimism. Overnight, the commodity rot gets a grip on risk sentiment, sending Asian bourses lower.
- House Republicans repealed most of ex-President Obama's signature health-insurance law in a tight vote, handing President Trump his first legislative victory and vindicating GOP leaders who failed twice before to pass a bill.
- The House Financial Services Committee launched a Republican-supported rollback of Obama-era financial regulations, voting 34-26 along party lines for a plan to undo significant parts of the 2010 Dodd-Frank law.
- Oil prices fell by as much as a further 3% this morning, after prices had crashed to five-month lows in the previous session. Other commodities feel the pain as well with eg iron ore futures down 8%.
- Jeremy Corbyn, the UK Labour party leader, is braced for heavy losses in local elections across Britain on Friday, in an ominous foretaste of what could happen in next month's general election.
- The administrators of Euribor have decided against an overhaul in which they would calculate the benchmark based on actual transaction data rather than the old system of banks' best estimates.
- Today's eco calendar contains US payrolls. Fed Yellen, Fischer, Williams, Rosengren, Evans and Bullard are scheduled to speak.
Currencies: EUR/USD Near 1.10 Barrier
EUR/USD nears 1.10 barrier
European assets initially took the lead in a risk-on trade yesterday. This trade supported at the same time EUR/USD, USD/JPY and EUR/JPY. So, rising expectations for a June Fed rate hike weren't unequivocally positive for the dollar. Later in the session, risk sentiment turned less positive. Ongoing commodity selling slowed the rise of core yields and turned out to be dollar negative. The US House approving the repeal of Obamacare also didn't help the US currency. EUR/USD even cleared the recent highs and finished the session at 1.0985. USD/JPY reversed earlier gains and closed the session at 112.46.
The ongoing decline in commodities weighs on Asian equities overnight. Japan and Korea are closed for regional holidays. The risk-off correction supports the yen. USD/JPY dropped to the low 112 area. The decline in commodities also weighs on the Aussie dollar (AUD/USD 0.7375) and on the Canadian dollar (USD/CAD 1.3785). In its quarterly report, the RBA was quite positive on the growth outlook and grew more confident that domestic inflation is strengthening. The comments don't help the Aussie dollar currently. With the dollar and commodity currencies in the defensive, the euro is 'by default' outperformer. EUR/USD hovers near the recent highs just below 1.10.
US payrolls are today's key feature. Consensus expects US job growth to have picked up in April to 190K after a disappointing March report (only 98K). This week's ADP report at least suggest that the odds for a rebound are good, even as the employment component in the ISM's eased substantially. Wage growth is expected at 0.3% M/M and 2.7%Y/Y. We also keep an eye at speeches from Fed governors (especially Fed Williams), for comments on the reduction of the Fed's balance sheet. Last but not least, global risk sentiment will be important. The the decline of commodities might become a source of global uncertainty. Short-term, the dollar momentum remains fragile, to say the least. A series of potential USD positive factors (rising expectations for a June Fed rate hike, the healthcare deal in the House,) didn't help the dollar. The dollar has often an inverse correction with commodity prices, but this trick currently also doesn't work.
At the same time, the euro profits from the expected victory of Macron in the French Presidential elections and from market speculation that the ECB is coming closer to scaling down policy stimulation in a not that distant future.
In this context, the payrolls will probably have to be very strong to change fortunes in favour of the dollar. In addition, negative risk sentiment (commodities) is currently more negative for the dollar than for the euro. We don't expect the euro to continue to outperform in case of a more pronounced risk-off correction. However, short-term market momentum remains euro positive and dollar fragile. So for now there is no hurry to add to USD long positions. We wait for a sign that the dollar is bottoming out.
From a technical point of view, USD/JPY bottoming out in April. The pair regained 112.20 resistance earlier this week. This improved the technical picture. However, for now there are no follow-through gains. Next intermediate resistance comes in at 115.51. EUR/USD extensively tested the topside of the MT range (1.0874/1.0906 area) late March. The pair returned to the range top after the French election and set minor new highs. Yesterday's break beak north of the recent highs (if confirmed), would improve the ST picture. Next resistance stands at 1.1129 (62% retracement) and at 1.1366 (correction top). A decline below 1.0821 would suggest that the dollar is regaining traction against the euro.
USD breaks above the recent highs in the 1.0950 area. Will the payrolls be strong enough to 'save' the dollar?
EUR/GBP
EUR/GBP returns to 0.85 area on euro strength
Sterling trading mostly followed the major trends of euro strength and relative dollar softness yesterday. EUR/GBP drifted north to the high 0.84 area, supported by the rise of EUR/USD. Cable dropped temporary lower early this morning, but rebounded north of 1.29 as the dollar couldn't maintain its post-Fed gains. The UK services PMI was again better than expected (55.8 from 55.00), but didn't really help sterling. On the negative side negative side for sterling, the Brexit bickering between the UK and the EU continued as the EU prepares measures to gain control on euro clearing activity which is mainly centralised in London. EUR/GBP closed the session at 0.8500. Cable finished the day at 1.2923.
There are no important eco data in the UK today. Markets might keep an eye at the local election as a precursor for the general election next month. However, global trends in the dollar and/or the euro will probably dominate sterling trading. The Brexit bickering between the EU and the UK will probably continue, but for now it has no really big impact on sterling. Of late the downside in EUR/GBP has become better protected, mostly due to euro strength. This trend might continue short-term?
Two weeks ago, EUR/GBP dropped below EUR/GBP 0.84 support, (temporary) improving the sterling picture. The pair came within reach of the key 0.8305 support (Dec low), but no real test occurred. After last week's EUR/GBP rebound, the range bottom is better protected. Longer term, Brexit-complications remain potentially negative for sterling. On technical considerations we slightly prefer a EUR/GBP buy-on-dips approach
EUR/GBP: downside better protected after last week's rebound
Trade Idea : GBP/USD – Buy at 1.2865
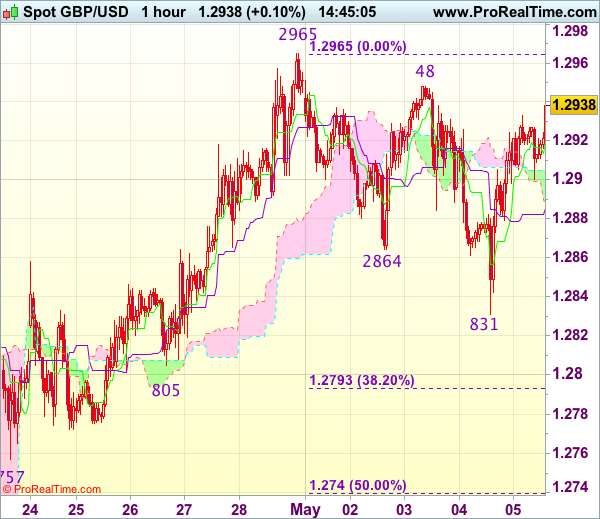
GBP/USD - 1.2939
Most recent candlesticks pattern : N/A
Trend : Near term up
Tenkan-Sen level : 1.2921
Kijun-Sen level : 1.2887
Ichimoku cloud top : 1.2905
Ichimoku cloud bottom : 1.2887
Original strategy :
Buy at 1.2790, Target: 1.2910, Stop: 1.2755
Position : -
Target : -
Stop : -
New strategy :
Buy at 1.2865, Target: 1.2965, Stop: 1.2830
Position : -
Target : -
Stop : -
Although cable has staged a strong rebound after finding support at 1.2831 yesterday, break of indicated resistance at 1.2948 is needed to signal the pullback from 1.2965 has ended at 1.2831, bring retest of 1.2965, once this level is penetrated, this would confirm recent upmove has resumed and extend further gain to 1.2990-00 (1.236 times projection of 1.2109-1.2616 measuring from 1.2365 and psychological resistance), then towards 1.3040-50.
In view of this, would not chase this rise here and would be prudent to buy cable on pullback as 1.2860-65 should limit downside and bring another rise later. Only break of said support at 1.0831 would abort and signal a temporary top has been formed, bring retracement of recent upmove to 1.2790-95 (38.2% Fibonacci retracement of 1.2515-1.2965) but support at 1.2740-50 (50% Fibonacci retracement) should hold.
Trade Idea : EUR/USD – Buy at 1.0920
EUR/USD - 1.0973
Most recent candlesticks pattern : N/A
Trend : Near term up
Tenkan-Sen level : 1.0982
Kijun-Sen level : 1.0933
Ichimoku cloud top : 1.0909
Ichimoku cloud bottom : 1.0899
Original strategy :
Buy at 1.0900, Target: 1.1000, Stop: 1.0870
Position : -
Target : -
Stop : -
New strategy :
Buy at 1.0920, Target: 1.1020, Stop: 1.0885
Position : -
Target : -
Stop : -
Euro finally broke above indicated resistance at 1.0951 (last week’s high), confirming our view that recent upmove from 1.0340 low has resumed and bullishness remains for this move to extend further gain to 1.1000, then towards 1.1025 (50% projection of 1.0602-1.0951 measuring from 1.0851) but reckon upside would be limited to 1.0050-60, risk from there is seen for a retreat later.
In view of this, would not chase this move here and would be prudent to buy euro on subsequent pullback as 1.0915-20 should limit downside. Only below support at 1.0875 (yesterday’s low) would abort and signal top is formed instead, bring correction to support at 1.0851 but price should stay above 1.0821 support, bring another rise later.

Trade Idea : USD/JPY – Exit long entered at 112.20
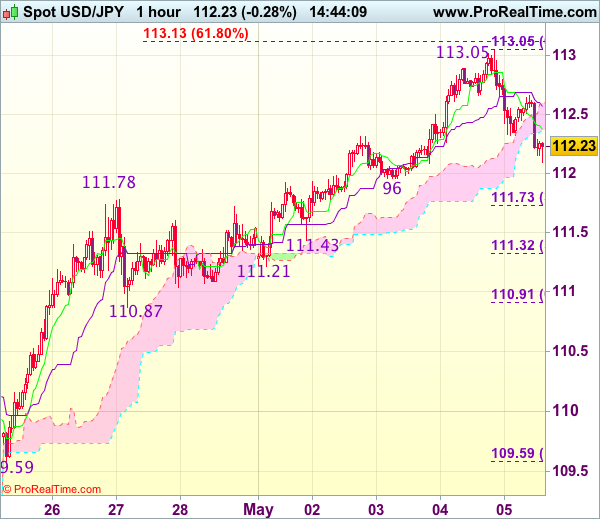
USD/JPY - 112.25
Most recent candlesticks pattern : N/A
Trend : Near term up
Tenkan-Sen level : 112.38
Kijun-Sen level : 112.57
Ichimoku cloud top : 112.59
Ichimoku cloud bottom : 112.37
Original strategy :
Bought at 112.20, Target: 113.20, Stop: 111.85
Position : - Long at 112.20
Target : - 113.20
Stop : - 111.85
New strategy :
Exit long entered at 112.20,
Position : - Long at 112.20
Target : -
Stop : -
As the greenback met renewed selling interest at 112.66 and has slipped again today, suggesting a temporary top has been formed at 113.05 and near term downside risk is seen for retracement of recent rise, hence weakness to 112.00 is likely, however, reckon downside would be limited to 111.73-78 (38.2% Fibonacci retracement of 109.59-113.05 and previous resistance) and reckon 111.21-32 (previous support and 50% Fibonacci retracement) would contain weakness, bring rebound later.
In view of this, would be prudent to exit long and stand aside in the meantime. Above 112.45-50 would bring test of said intra-day resistance at 112.66 but a firm break above there is needed to signal the pullback from 113.05 has ended, bring further gain towards this level, then 113.10-15 (61.8% projection of 108.13-111.78 measuring from 110.87) but upside should be limited to previous resistance at 113.54
Market Update – Asian Session: Oil Decline Accelerates In Asia Amid Ongoing Supply Worries
Asia Mid-Session Market Update: Oil decline accelerates in Asia amid ongoing supply worries; Hong Kong PMI rises to 3-year high
US Session Highlights
(US) APR CHALLENGER JOB CUTS: 36.6K V 45.9K PRIOR; Y/Y: -42.9% V -2.0% PRIOR
(US) INITIAL JOBLESS CLAIMS: 238K V 248KE; CONTINUING CLAIMS: 1.96M V 1.99ME
(US) MAR TRADE BALANCE: -$43.7B V -$44.5BE
(US) Q1 PRELIMINARY NONFARM PRODUCTIVITY: -0.6% V -0.1%E; LABOR COSTS: +3.0% V 2.7%E
(US) April same store sales for US retailers at +2.3% v +2.9% forecast - Retail Metrics
(US) MAR FACTORY ORDERS: 0.2% V 0.4%E
(US) MAR FINAL DURABLE GOODS ORDERS: 0.9% V 0.7%E; DURABLES EX TRANSPORTATION: 0.0% V -0.2% PRELIM
US markets on close: Dow flat, S&P500 +0.1%, Nasdaq +0.1%
Best Sector in S&P500: Financials
Worst Sector in S&P500: Real Estate
Biggest gainers: REGN +6.7%; WLTW +6.2%; GPN +6.2%
Biggest losers: FTR -11.2%; CHK -7.4%; VIAB -7.1%
At the close: VIX 10.5 (-0.2pts); Treasuries: 2-yr 1.31% (+1bps), 10-yr 2.36% (+5bps), 30-yr 3.00% (+4bps)
US movers afterhours
ELY Reports Q1 $0.27 v $0.22e, R$308.9M v $284Me; Guides Q2 $ v $0.16e, R$M v $266Me; +11.4% afterhours
ZNGA Reports Q1 -$0.01 v $0.01e, R$194.3M v $196Me; Guides Q1 (GAAP) $ v $0.02e, R$M v $195Me; EBITDA $M; +7.8% afterhours
HLF Reports Q1 $1.24 v $0.87e, R$1.10 v $1.04Be (1 est); +7.1% afterhours
LYV Reports Q1 -$0.22 v -$0.33e, R$1.41B v $1.27Be; +6.5% afterhours
SHAK Reports Q1 $0.10 v $0.08e, R$76.7M v $75.4Me; Guides FY17 R$351-355M v $358Me ($349-354M) - Cuts FY17 SSS 0% (prior 2-3%); -2.1% afterhours
FLR Reports Q1 $0.43 v $0.67e, R$4.84B v $4.79Be; -6.8% afterhours
Key economic data
(HK) HONG KONG APR COMPOSITE PMI: 51.1 V 49.9 PRIOR; 1st expansion in 4 months, 3-year high
(NZ) NEW ZEALAND Q2 INFLATION EXPECTATION SURVEY: 2-YEAR INFLATION EXPECTATION 2.17% (highest since Q3 of 2014) V 1.92% PRIOR
(TW) TAIWAN APR CPI Y/Y: 0.1% V 0.5%E; WPI Y/Y: 1.1% V 1.6%E
Asia Session Notable Observations, Speakers and Press
Risk aversion picked up in Asian hours as the selloff in the energy space accelerated. WTI crude oil abruptly fell over 3% below $44/brl without any specific catalyst, though analysts continue to attribute the recent dry spell for oil prices to worries about supply (OPEC not changing the size of its cuts) and demand (more pronounced slowdown in China). Japan and Korea remain closed for holiday, while Australia was down for the 4th straight session. Ahead of Friday's non-farm payrolls, risk-off flows weighed on USD/JPY, as it fell some 50pips below 112.20. AUD/USD was down about 40pips as well below 0.7370, while NZD/USD was briefly lifted by RBNZ inflation outlook.
In economic data, RBNZ's Q2 inflation expectation survey forecast 2-year CPI at 2.17% - the highest since Q3 of 2014 - and 1-yr expectation rising to 1.92% from 1.56%. Hong Kong composite PMI hit a 3-year high, emerging out of contraction for the first time in 4 months. Economicsts noted increased pre-production inventories and busier suppliers along with intensifying inflation pressure. RBA's quarterly monetary policy statement largely reiterated its forecasts for growth and inflation 2-years out, but also noted the recent run of constructive economic data provides assurance about domestic outlook.
China
(CN) China should be able to avoid a cash crunch due to stronger regulation - Chinese press
Japan
(JP) Japan Fin Min Aso: JPY is a stable currency; Free trade should be maintained
Australia
(AU) Australia budget said to show a -A$28B deficit in FY17/18 - press
Asian Equity Indices/Futures (01:30ET)
Nikkei closed, Hang Seng -1.1%, Shanghai Composite -0.7%, ASX200 -0.7%, Kospi closed
Equity Futures: S&P500 -0.2%; Nasdaq -0.2%, Dax -0.2%, FTSE100 -0.3%
FX ranges/Commodities/Fixed Income (01:30ET)
EUR 1.0970-1.0990; JPY 112.15-112.65; AUD 0.7365-0.7415; NZD 0.6860-0.6890
June Gold +0.6% at 1,235/oz; June Crude Oil -2.7% at $44.40/brl; July Copper +0.2% at $2.52/lb
(CN) PBOC SETS YUAN MID POINT AT 6.8884 V 6.8957 PRIOR; Strongest fix since Apr 26th
(CN) PBOC skips open market operations v CNY50B prior injected
(AU) Australia sells A$800M in 2.00% Dec 2021 bonds, bid to cover 4.03X, avg yield 2.1368%
Asia equities notable movers
Sands China (1928.HK) -2.3%; Q1 results
NAB (Nab.au) -1.6% Cut at CItiGroup
Qantas (Qan.au) +2.2%; Investor Day comments
Macquarie (MQG.AU) +3.4%; FY17 results
Daily Technical Outlook And Review: EUR/USD, GBP/USD, AUD/USD, USD/JPY, USD/CAD, USD/CHF, DOW 30, GOLD
A note on lower timeframe confirming price action...
Waiting for lower timeframe confirmation is our main tool to confirm strength within higher timeframe zones, and has really been the key to our trading success. It takes a little time to understand the subtle nuances, however, as each trade is never the same, but once you master the rhythm so to speak, you will be saved from countless unnecessary losing trades. The following is a list of what we look for:
- A break/retest of supply or demand dependent on which way you're trading.
- A trendline break/retest.
- Buying/selling tails ... essentially we look for a cluster of very obvious spikes off of lower timeframe support and resistance levels within the higher timeframe zone.
- Candlestick patterns. We tend to only stick with pin bars and engulfing bars as these have proven to be the most effective.
EUR/USD
Going into the early hours of yesterday's US segment, the single currency gathered momentum and broke above a multi-day H4 range fixed between 1.0861/1.0950. With the major now seen within striking distance of the large psychological number 1.10, where do we go from here? Well, technically speaking, 1.10 looks as if it could be an ideal neighborhood to consider shorting from. Apart from this level likely being watched by the majority of the market, we can also see that it converges beautifully with a 161.8% Fib ext. at 1.1007 drawn from the low 1.0851. In addition to this, we also have weekly action trading between two 127.2% Fib extensions (red zone) at 1.1016/1.0954 taken from the lows 1.0340/1.0493, and daily price is currently seen lurking just ahead of a trendline resistance extended from the high 1.1616.
Our suggestions: Shorting from 1.10, in our opinion, is a no brainer, since stops can comfortably be placed above the upper 127.2% Fib ext. level at 1.1016 on the weekly chart. However, traders are advised to pay attention to economic news today, as we have some heavy-hitters on the horizon!
Data points to consider: US Average hourly earnings, Non-farm employment change and Unemployment rate at 1.30pm. FOMC member Fischer speaks at 4.30pm. Fed Chair Yellen also takes the stage, as well as FOMC member Evans at 6.30pm GMT+1.
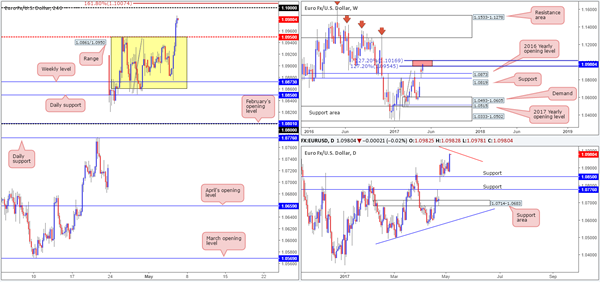
Levels to watch/live orders:
- Buys: Flat (stop loss: N/A).
- Sells: 1.10 region (stop loss: 1.1020).
GBP/USD
This is why we absolutely love areas of convergence! In Thursday's report our team highlighted the H4 mid-level support at 1.2850 as a potential buy zone. We liked this area because it fused with a H4 61.8% Fib support at 1.2835, a H4 support at 1.2843 and a 127.2% H4 AB=CD (black arrows) Fib ext. at 1.2838 (taken from the high 1.2965). Unfortunately, we missed this long opportunity as we were unable to pin down a lower-timeframe confirming signal. Well done to any of our readers who managed to jump aboard here!
Moving forward, we can see that the 1.29 handle has recently been taken out which could encourage further buying up to the H4 mid-level resistance at 1.2950. Buying, however, could be a challenge. Not only is weekly supply at 1.3120-1.2957 now seen within striking distance, we also have the 161.8% daily Fib ext. at 1.2956 taken from the low 1.2108 to contend with. Therefore, rather than looking to buy this market, one may want to consider selling 1.2950!
Our suggestions: The H4 mid-level resistance at 1.2950, coupled with the daily 161.8% Fib ext. at 1.2956 and the underside of weekly supply at 1.2957, gives traders a high-probability zone to short from. One could be aggressive and take this level without waiting for additional confirmation, or take the conservative route and wait and see if H4 price prints a reasonably sized bearish candle (preferably a full-bodied candle).
Data points to consider: US Average hourly earnings, Non-farm employment change and Unemployment rate at 1.30pm. FOMC member Fischer speaks at 4.30pm. Fed Chair Yellen also takes the stage, as well as FOMC member Evans at 6.30pm GMT+1.
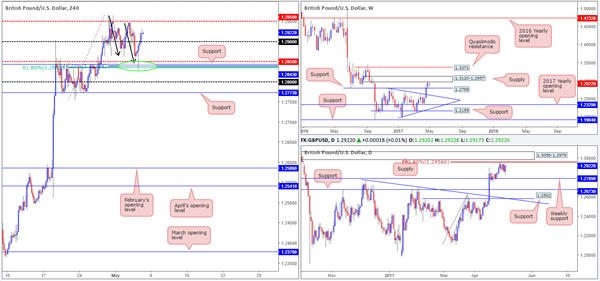
Levels to watch/live orders:
- Buys: Flat (stop loss: N/A).
- Sells: 1.2950 region ([waiting for a reasonably sized H4 bear candle to form before pulling the trigger is advised] stop loss: ideally beyond the candle's wick).
AUD/USD
Following the break of the daily support area at 0.7449-0.7506 on Wednesday, the sell-side of this market continued to weigh down on this pair yesterday. However, the bulls have begun to make some noise around the 0.74 neighborhood. Notice on the H4 chart that there's a near-perfect 127.2% Fib ext. convergence with this number, and over on the daily chart we have a long-term 61.8% Fib support in play at 0.7832 (drawn from the low 0.7159). Collectively, these levels could help lift the commodity currency up to at least the 0.7450 region today.
Our suggestions: Despite both the H4 and daily charts suggesting longs could be an option, weekly price continues to reflect a bearish stance as there's little support seen until we connect with trendline support extended from the low 0.6827. Personally, we feel the better opportunity lies up at the 0.7450 barrier given its connection to the daily resistance area at 0.7449-0.7506, and current weekly direction.
Data points to consider: RBA monetary policy statement at 2.30am. US Average hourly earnings, Non-farm employment change and Unemployment rate at 1.30pm. FOMC member Fischer speaks at 4.30pm. Fed Chair Yellen also takes the stage, as well as FOMC member Evans at 6.30pm GMT+1.
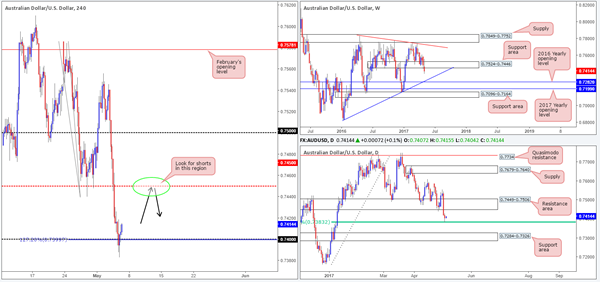
Levels to watch/live orders:
- Buys: Flat (stop loss: N/A).
- Sells: 0.7450 neighborhood ([waiting for a reasonably sized H4 bear candle to form before pulling the trigger is advised] stop loss: ideally beyond the candle's wick).
USD/JPY
Unable to sustain gains beyond the 113 handle, the USD/JPY reversed yesterday and went on to test the H4 mid-level support at 112.50. Apart from 113, this recent downside move could have had something to do with the daily 61.8% Fib resistance at 112.69 drawn from the high 115.50. Despite this, buyers remain in a strong position at the moment. Not only do we have a daily support area at 111.35-112.37 in play right now, we also see room on the weekly chart for price to advance up to supply coming in at 115.50-113.85.
Our suggestions: For our team to become buyers in this market, the 61.8% daily Fib resistance at 112.69 will need to be taken out. Even better would be a H4 close above 113. That way, the path should be free up to the H4 mid-level resistance at 113.50 and trendline resistance extended from the low 111.68, followed closely by the said weekly supply.
Data points to consider: US Average hourly earnings, Non-farm employment change and Unemployment rate at 1.30pm. FOMC member Fischer speaks at 4.30pm. Fed Chair Yellen also takes the stage, as well as FOMC member Evans at 6.30pm GMT+1.
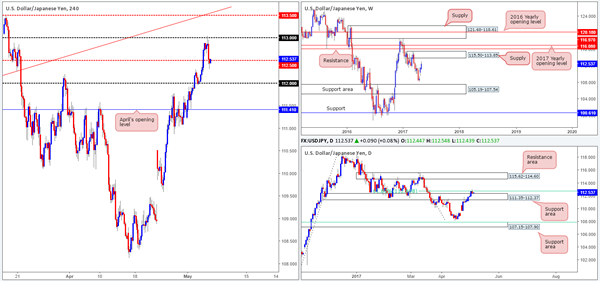
Levels to watch/live orders:
- Buys: Watch for H4 price to close above 113 and then look to trade any retest seen thereafter ([waiting for a reasonably sized H4 bullish candle to form following the retest is advised] stop loss: ideally beyond the candle's tail).
- Sells: Flat (stop loss: N/A).
USD/CAD
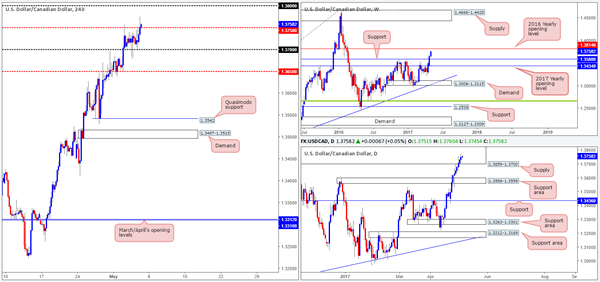
Starting from the top this morning, the weekly candles currently look poised to attack the 2016 yearly opening level at 1.3814. Down on the daily timeframe, however, price remains trading within the walls of a supply zone coming in at 1.3859-1.3700. Upside momentum, of course, could certainly diminish from within here, but we're hoping to see the 2016 yearly opening level come into the picture beforehand.
A closer look at price action on the H4 timeframe shows that the bulls are currently tackling the mid-level resistance at 1.3750. Buy stops have likely been consumed around this region, which could prompt further buying up to the 1.38 handle.
Our suggestions: To our way of seeing things, entering long (medium/long term) is not a viable option at present. Shorts on the other hand, are. However, given our conservative nature, we would not be looking to commit until price has connected with the above noted 2016 yearly opening level (essentially around the 1.38 region). The reason being is that this line firmly positioned within the said daily supply and thus allows the trader to conservatively place stops above this area.
Data points to consider: US Average hourly earnings, Non-farm employment change and Unemployment rate at 1.30pm. FOMC member Fischer speaks at 4.30pm. Fed Chair Yellen also takes the stage, as well as FOMC member Evans at 6.30pm. Canadian employment figures also scheduled for release at 1.30pm GMT+1.
Levels to watch/live orders:
- Buys: Flat (stop loss: N/A).
- Sells: 1.3814/1.38 region is an ideal place for shorts since this area requires no additional confirmation (stop loss: conservative at 1.3861).
USD/CHF
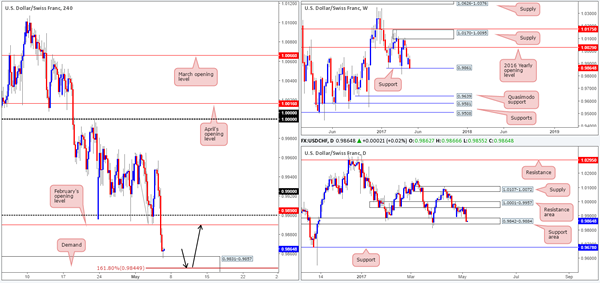
With the EUR/USD seen advancing to fresh highs, it was no surprise to see the USD/CHF had recently clocked fresh lows. Breaking through February's opening level at 0.9890, the H4 candles recently interacted with demand penciled in at 0.9831-0.9857.
Based on this recent movement, we see two possible scenarios taking place:
H4 bulls continue to push higher from the current demand base and retest February's opening level as resistance.
H4 price digs a little lower to test the 161.8% Fib ext. at 0.9844 (taken from the high 0.9965) seen within the said demand and rallies higher.
Why are we so bullish? Weekly action is in the process of testing a support level coming in at 0.9861 and daily flow recently checked in with a support area at 0.9842-0.9884.
Our suggestions: Personally, we favor the 0.9844 neighborhood for longs (see black arrows) solely on the basis that it has a better risk/reward ratio up to February's opening level. In addition to this, traders may also want to take into account that the market boasts correlation confluence seeing as the EUR is expected to tumble from around the 1.10 mark.
Data points to consider: US Average hourly earnings, Non-farm employment change and Unemployment rate at 1.30pm. FOMC member Fischer speaks at 4.30pm. Fed Chair Yellen also takes the stage, as well as FOMC member Evans at 6.30pm GMT+1.
Levels to watch/live orders:
- Buys: 0.9844 is a nice area to consider longs from without the need for additional confirmation, given its connection to the higher timeframes (stop loss: 0.9829).
- Sells: Flat (stop loss: N/A).
DOW 30
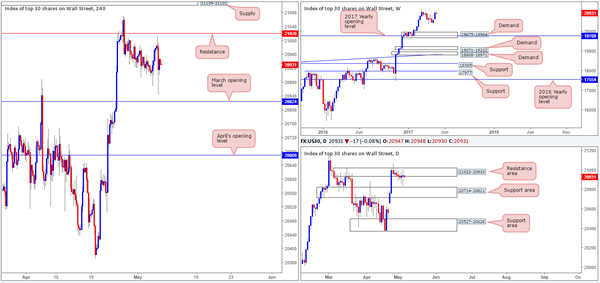
US equities are little changed this morning, despite the index ranging over 160 points. Daily price remains capped by the resistance area at 21022-20933, and H4 action came within a cat's whisker of clipping the resistance level pegged at 21020. On the other hand, weekly flow still looks poised to continue marching higher which could eventually see the market reach a new record high.
Our suggestions: Overall, we're not too impressed with the DOW's technical structure at the moment. However, given where price is positioned on the weekly chart, we do eventually expect the unit to punch higher and continue trending northbound.
Data points to consider: US Average hourly earnings, Non-farm employment change and Unemployment rate at 1.30pm. FOMC member Fischer speaks at 4.30pm. Fed Chair Yellen also takes the stage, as well as FOMC member Evans at 6.30pm GMT+1.
Levels to watch/live orders:
- Buys: Flat (stop loss: N/A).
- Sells: Flat (stop loss: N/A).
GOLD
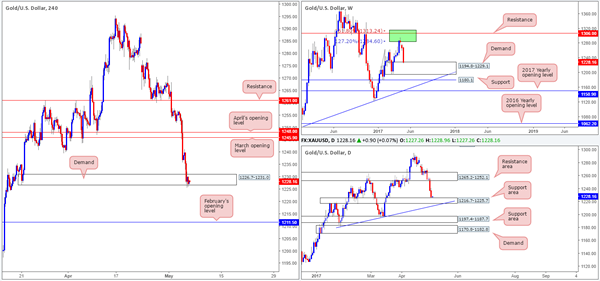
In recent trading, we've seen the yellow metal dragged down to weekly demand at 1194.8-1229.1, which happens to also boast additional support from a daily support zone coming in at 1216.7-1225.7.
Turning our attention over to the H4 candles, bullion is currently seen testing a demand base at 1226.7-1231.0. So far, however, the bulls have yet to register anything noteworthy. Beyond this area, we see little support until price reaches February's opening base line at 1211.5.
Our suggestions: Looking for longs around the current H4 demand base is an option given its relationship with both weekly demand and the daily support area. Still, there's always that chance that the market may drop lower to test February's opening line, which is located below the daily support zone but still within the walls of weekly demand.
Therefore, we see two options here:
Attempt to enter long around the current H4 demand and target March's opening level at 1245.9 as your initial take-profit target.
Wait and see if H4 price breaks through the current demand and attacks February's opening line, which would make the current demand (at that point it'd be a resistance area) your initial take-profit area.
Personally, we favor the former owing to the H4 demand being set nearby BOTH weekly and daily structures (see above). However, for us to get involved here, we are going to need to see some effort from the bulls first. A full-bodied bullish candle printed from this area would be ideal!
Levels to watch/live orders:
- Buys: 1226.7-1231.0 ([waiting for a reasonably sized H4 bull candle to form before pulling the trigger is advised] stop loss: ideally beyond the candle's tail).
- Sells: Flat (stop loss: N/A).
Daily Technical Analysis: EUR/USD Bullish Breakout Approaches 1.10 Resistance On NFP
Currency pair EUR/USD
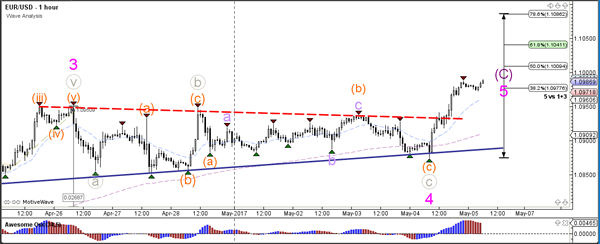
The EUR/USD broke above the resistance level (dotted red) of the consolidation pattern. There could be a potential uptrend continuation towards the 78.6% Fibonacci level of wave 2 (green) but the 1.10 even level could act as a resistance level.
Today the Non-Farm Payroll (NFP) and unemployment figures will be released in the United States, which will typically have a large impact on the volatility of price movement before, during and after the news event.
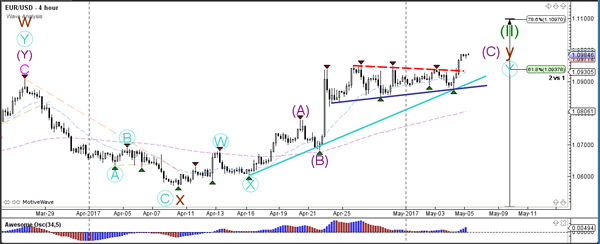
The EUR/USD bullish breakout above resistance (dotted red) started a larger bullish momentum which is taking price towards the Fibonacci targets of wave 5 vs 1+3.
Currency pair GBP/USD
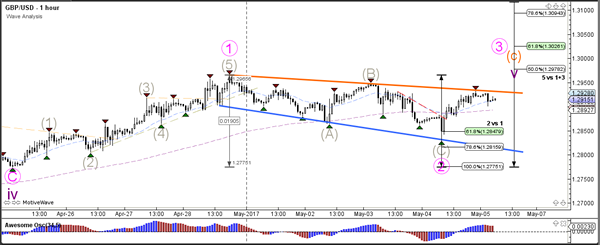
The GBP/USD continues to move sideways within a triangle chart pattern (orange/green lines). The Cable is still in an uptrend as long price stays above the support trend lines (blue/green). A bullish break above resistance (red) could see price challenge the 1.30 round level and Fibonacci targets whereas a bearish break could start a larger correction or reversal.
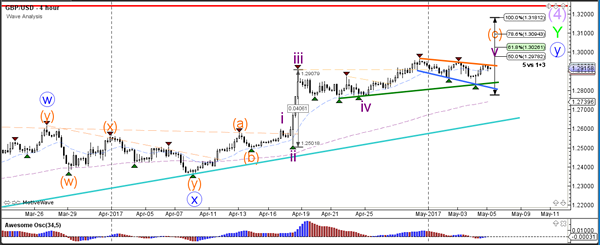
The GBP/USD wave 2 (pink) is invalidated if price breaks below the 100% Fibonacci level of wave 2 vs 1. A bullish break above resistance (orange) could see price push higher to the Fib targets of wave 5.
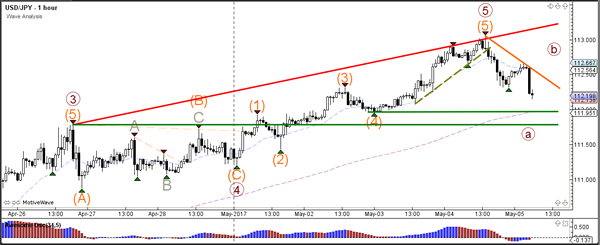
Currency pair USD/JPY
The USD/JPY broke the support trend line (dotted blue) and could be starting a larger bearish retracement. The Fibonacci levels (green) could be support levels and stopping points for the potential ABC correction (brown).
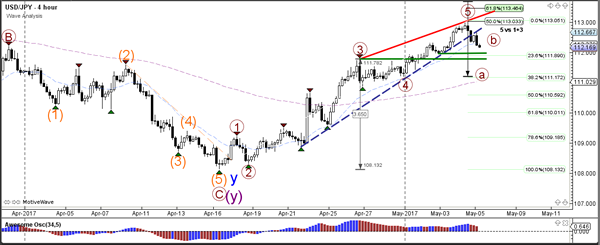
The USD/JPY seems to have completed the 5th wave (orange) of a 5th wave (brown) and price could be building an ABC (brown) correction. The wave A (brown) might stop at the green support levels.
EUR/JPY Candlesticks and Ichimoku Analysis
Weekly
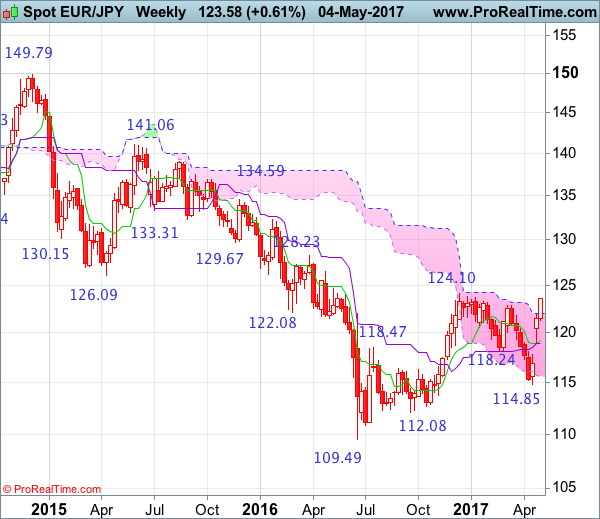
• Last Candlesticks pattern: Hammer
• Time of formation: 19 Sep 2016
• Trend bias: Down
Daily
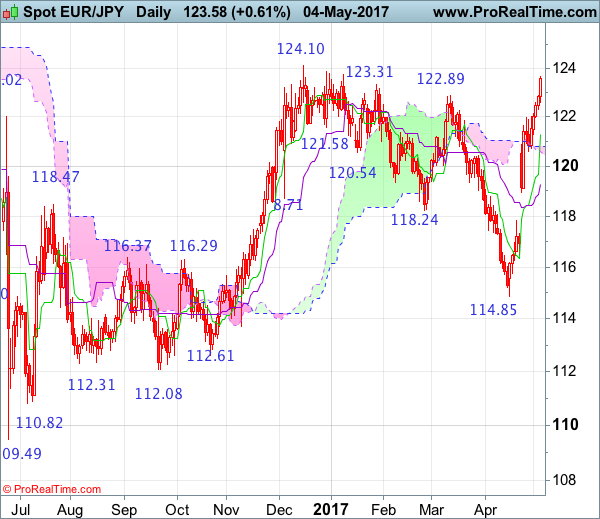
• Last Candlesticks pattern: Doji
• Time of formation: 28 Mar 2017
• Trend bias: Near term up
EUR/JPY – 123.12
As the single currency has surged again after last week’s gap-up opening and broke above indicated previous resistance at 123.31, adding credence to our view that correction from 124.10 has ended and retest of this level is likely, however, break there is needed to provide confirmation that early upmove from 109.49 low has resumed, then headway to 124.50-60 and later 125.00 would be seen but near term overbought condition should limit upside to 125.25-30 (50% Fibonacci retracement of 141.06-109.49) and reckon 125.90-00 would hold from here.
On the downside, whilst initial pullback to 122.00-10 cannot be ruled out, reckon downside would be limited to the Tenkan-Sen (now at 121.40) and 121.00 should hold, bring another upmove later to aforesaid upside targets. Only a drop below support at 120.60 would suggest a temporary top is formed instead, bring correction of recent upmove to 120.00 but downside should be limited to 119.40-50 and price should stay well above indicated support at 118.92 (last week’s low) and bring rebound later.
Recommendation: Buy at 121.00 for 124.00 with stop below 120.00.
On the weekly chart, the single currency has risen again after opening higher last week and the breach of indicated resistance at 123.31 adds credence to our view that correction from 124.10 has ended, suggesting the erratic rise from 109.49 has resumed, above 124.10 resistance would provide confirmation, bring retracement of medium term downtrend to 124.85-90 (38.2% Fibonacci retracement of 149.79-109.49), then 125.25-30 (50% Fibonacci retracement of 141.06-109.49) but reckon upside would be limited to 126.00 and 126.45-50 would hold, bring retreat later.
On the downside, although initial pullback to the upper Kumo (now at 122.04) cannot be ruled out, reckon downside would be limited to 121.00-10 and bring another rise. Below support at 120.60 would defer and risk weakness to 120.00 but reckon the Tenkan-Sen (now at 119.27) would limit downside and support at 118.92 should hold, bring another rebound later. A drop below 118.92 would shift risk to downside for further fall to 118.00, however, downside should be limited to previous resistance at 117.82 and bring rebound later. A weekly close below 117.82 would suggest first leg of rebound from 114.85 has ended, bring weakness to 117.00 but price should stay above 116.20-25, bring another rebound later.
The Main Event Today Is The US Jobs Report For April
Market movers today
The main event today is the US jobs report for April. We estimate nonfarm payrolls rose 170,000 in April, a bit below consensus of 190,000 but in line with the employment growth in the ADP jobs report for April. We estimate the unemployment rate ticked up to 4.6% after the big fall to 4.5% in March. While we expect wage growth to fall to 2.6% y/y, consensus calls for an unchanged print at 2.7% y/y.
After the quite dull FOMC meet ing on Wednesday, it will be interesting to listen to the different views on the stance of monetary policy, as some Fed speeches are scheduled today.
Sunday sees the final round of the French presidential election. As opinion polls accurately predicted the first round result and have pointed consistently to an Emmanuel Macron win, markets have largely priced out any French election risk premium over recent weeks. As with the first round, the main TV and radio channels will release exit polls once voting stations close at 20:00 CEST on Sunday and will be watched closely by markets.
Selected market news
In the US, in a major win for President Donald Trump and the Republican leaders, the Republicans' healthcare bill passed the House of Represent at ives with a very slim majority. That said, it is more difficult for the bill to pass the Senate despit e T rump's confidence, as the Republican majority is slimmer (52 versus 48) and many Republican Senators have expressed reservat ions against the bill. Majority Leader of the Senate, Mitch McConnell , has said the Senate will wait for a deeper economic analysis of the bill from the Congressional Budget Office (CBO) before vot ing on it . Although Trump at the following press conference said that the process has 'really brought the Republican P art y t ogether', we are in more doubt and st ill expect it to be difficult for Trump to deliver on his promises on taxes and infrast ructure. We still believe Trumponomics will come later and be smaller than previously pledged.
As widely expected, Norges Bank left rates unchanged at yesterday's monetary policy meeting. the statement was balanced relat ive to March's slightly dovish stance and concluded: 'the outlook and the balance of risks for the Norwegian economy do not appear to have changed substant ially since the March Report. The key policy rate has therefore been kept unchanged at this meeting'.
In China, financial stress is increasing again, as bond yields are moving higher again, which feeds into the housing market with a lag. We have also seen a decline in stock prices and a sharp fall in iron prices. Also, the oil price has slipped from above USD50/bl yesterday morning to USD47/bl now.
In the UK, local elect ions took place yesterday and, while votes are st illing being counted, Labour seems to have suffered a heavy loss, with the Conservatives picking up support. The result is likely to be the bestresult for the Conservatives for at least 10 years. If anything, this supports our basecase scenario that PM Theresa May will lifther majority in the House of Commons significantly.
European Open Briefing: The Focus Overnight Was On Commodity Prices
Global Markets:
- Asian stock markets: Shanghai Composite fell 0.70 %, Hang Seng lost 1.20 %, ASX 200 declined 0.75 %
- Commodities: Gold at $1231 (+0.20 %), Silver at $16.37 (+0.40 %), WTI Oil at $44.28 (-2.75 %), Brent Oil at $47.20 (-2.50 %)
- Rates: US 10-year yield at 2.35, UK 10-year yield at 1.12, German 10-year yield at 0.38
News & Data
- Hong Kong Nikkei PMI Apr: 51.1 (prev 49.9)
- PBoC Fixes USDCNY Reference Rate At 6.8884 (prev fix 6.8957 prev close 6.8956)
- RBA: Judged Holding Policy Steady Consistent with Sustainable Growth, Medium-Term Inflation Target
- RBA: An Appreciating A$ Would Complicate Economy's Transition
- RBA: Keeps Underlying Inflation Forecasts Unchanged
- RBA: Wage Growth Unlikely to Slow Any Further but Will Remain Low
- Asian stocks fall for third day as cracks in commodities widen – RTRS
Markets Update:
The focus overnight was on commodity prices, which came under pressure. WTI Oil broke below $47 support yesterday, and traded as low as $43.70 in Asia. Traders are concerned about renewed oversupply as the US output increases, and the effects of the OPEC reductions are fading. The charts suggest WTI will continue to extend losses to at least $42 in the near-term.
The weakness in the commodities market weighed on equities as well. Asian stock markets declined again, with the Hang Seng losing more than 1 % on the day.
In FX, the Euro rallied ahead of the jobs data, while USD/JPY reversed. Resistance ahead of 113 proved as though, and the risk-off sentiment put the pair under pressure. Key support is now noted at 111.50 and then 110.80.
Meanwhile, traders are confident that the outcome of the French election on Sunday is certain – with centrist candidate Macron winning. EUR/USD reached 1.0987 in Asia. Resistance ahead of 1.10 is heavy, but should US data disappoint today, the pair will likely break above it.
Upcoming Events:
- 13:30 BST – US NFP
- 13:30 BST – US Unemployment Rate
- 13:30 BST – US Average Hourly Earnings
- 13:30 BST – Canadian Unemployment Rate
- 13:30 BST – Canadian Employment Change
- 16:30 BST – FOMC Member Fischer speaks
- 17:45 BST – FOMC Member Williams speaks
- 18:30 BST – Fed Chair Yellen speaks
- 20:30 BST – CFTC Positioning Data