Sample Category Title
Pound Gains Ground as Services PMI Beats Expectations
GBP/USD has posted modest gains in the Thursday session. In North American trade, the pair is trading at the 1.29 level. On the release front, UK Services PMI improved to 55.8, above the estimate of 54.6 points. Net Lending to Individuals came in at GBP 4.7 billion, above the forecast of GBP 4.5 billion. In the US, unemployment claims dropped to 238 thousand, shy of the estimate of 246 thousand. On Friday, the US releases wage growth and nonfarm payrolls reports, so traders should be prepared for some movement from GBP/USD.
It was a clean sweep for PMI reports this week, as the Manufacturing, Construction and Services PMIs all beat their estimates. These releases underscore a solid British economy, despite continuing jitters over Britain's departure from the European Union. Market concerns have increased ahead of the first phase of negotiations between Britain and the European Union. The war of words between London and Brussels continues to heat up, after reports of a disastrous meeting between Prime Minister Theresa May and European Commission President Jean-Claude Juckner. May attacked the EU on Thursday, saying that politicians in Brussels were deliberately meddling in the British election, which will be held in June. May reiterated that she wants a "deep and special partnership" with the EU, while warning that no deal was preferable to a bad deal. May's combative tone may serve her well in the election campaign, but if negotiations reach an impasse and Britain leaves the EU without a comprehensive deal in place, the toll on the British economy would be significant and the pound could drop sharply.
As expected, the Federal Reserve stayed on the sidelines on Wednesday, holding the benchmark rate at 0.75 percent. The Fed rate statement was hawkish, as policymakers emphasized the positives and downplayed a soft first quarter. The statement noted that consumer spending remains strong and that inflation was "running close" to the Fed's 2 percent target. The Fed's message is clearly one of optimism, as the central bank remains on track to raise interest rates twice more in 2017. The Fed's bullish statement immediately raised the likelihood of a rate hike at June meeting, which jumped to 74 percent after the statement, up from 63% before meeting. The Fed has two key goals which have been achieved, namely full employment and an inflation rate of 2%. One area of concern is the balance sheet, which stands at $4.5 trillion. The minutes of the March meeting stated that policymakers want to start reducing this figure before the end of 2017, and we could see another reference to the balance sheet in the April minutes.
Just a few days ahead of the French election, Emmanuel Macron and Marie Le Pen faced off in a highly-anticipated television debate on Wednesday. Polls taken after the feisty debate showed that 64% of viewers felt Macron won the debate. With a 20-point lead in the polls, Macron had the most to lose from the debate, but he kept his cool and acted presidential, in contrast to Le Pen. Barring a dramatic event in the next few days, such as a terror attack, all signs are pointing to Macron becoming France's next president. Parliamentary elections are scheduled for June, so the French political landscape will remain uncertain until then. Macron's En Marche! party is expected to win the most seats, and has an outside short at forming a majority in parliament.
Trade Idea Wrap-up: USD/JPY – Buy at 112.20
USD/JPY - 112.76
Most recent candlesticks pattern : N/A
Trend : Near term up
Tenkan-Sen level : 112.86
Kijun-Sen level : 112.65
Ichimoku cloud top : 112.20
Ichimoku cloud bottom : 111.92
Original strategy :
Buy at 112.50, Target: 113.50, Stop: 112.15
Position : -
Target : -
Stop : -
New strategy :
Buy at 112.20, Target: 113.20, Stop: 111.85
Position : -
Target : -
Stop : -
As the greenback has surged again after finding renewed buying interest at 111.96 yesterday, adding credence to our view that recent upmove is still in progress and bullishness remains for further subsequent gain to 113.10-15 (61.8% projection of 108.13-111.78 measuring from 110.87) but near term overbought condition should limit upside to previous resistance at 113.54 and reckon 113.75-80 (76.4% retracement of 115.51-108.13) would hold, risk from there has increased for a retreat to take place later.
In view of this, would not chase this rise here and would be prudent to buy dollar on subsequent pullback as 112.20-25 should limit downside. Only below indicated support at 111.96 would defer and suggest top is formed, bring correction of recent rise to previous resistance at 111.78.

Yen Yawns in Thin Holiday Trade
USD/JPY is unchanged in the Thursday session. In North American trade, the pair is trading at 112.70. Japanese banks and stock exchanges are closed for a third straight day for a holiday. On the release front, US unemployment claims dropped to 238 thousand, shy of the estimate of 246 thousand. On Friday, the US releases wage growth and nonfarm payrolls reports, so traders should be prepared for some movement from USD/JPY.
Japanese inflation remains weak, underscored by BoJ Core CPI, which posted a rare decline. A year ago, the indicator posted a solid gain of 1.1%, but since then consumer inflation has steadily weakened. The BoJ released its minutes from the March meeting last week, and policymakers focused on consumer inflation, which remains well below the central bank's target of two percent. The minutes indicated that the BoJ is closely tracking consumer prices, but in the meantime will continue with its quantitative easing scheme, in which the central bank purchases JPY 80 trillion per year. The BoJ's prescription for curing weak inflation is to continue its ultra-accommodative monetary policy, so we're unlikely to see policymakers contemplate tightening policy unless inflation moves reverses direction and moves upwards.
As expected, the Federal Reserve stayed on the sidelines on Wednesday, holding the benchmark rate at 0.75 percent. The Fed rate statement was hawkish, as policymakers emphasized the positives and downplayed a soft first quarter. The statement noted that consumer spending remains strong and that inflation was "running close" to the Fed's 2 percent target. The Fed's message is clearly one of optimism, as the central bank remains on track to raise interest rates twice more in 2017. The Fed's bullish statement immediately raised the likelihood of a rate hike at June meeting, which jumped to 74 percent after the statement, up from 63% before meeting. The Fed has two key goals which have been achieved, namely full employment and an inflation rate of 2%. One area of concern is the balance sheet, which stands at $4.5 trillion. The minutes of the March meeting stated that policymakers want to start reducing this figure before the end of 2017, and we could see another reference to the balance sheet in the April minutes.
Elliott Wave Analysis: Nasdaq100 Trading In A Temporary Correction; Higher Level May Follow
Nasdaq100 is trading slowly and choppy, probably in a correction of a higher degree wave 4). That said price may see limited downside around the previous swing low of minor wave 4 at 5572 level from where a new bounce higher may follow.
Nasdaq100, 1H
Currencies: Dollar Trades Mixed Post-Fed. Euro Outperforms
Headlines
European equity markets gain up to 1% with the French CAC40 outperforming as centrist presidential candidate cleared the final (TV debate) hurdle ahead this weekend's run off against Le Pen. US stock markets open much less enthusiastic with gains of around 0.1%.
Euro zone growth appears increasingly solid and parts of the European Central Bank's policy guidance may change over time, ECB chief economist Praet said, reinforcing expectations for a more upbeat assessment next month.
Norway's central bank kept its interest rates on hold (0.5%) at its latest policy meeting and plans to keep them there for the foreseeable future, adding that it will increase the frequency of its meetings and publish more information on its discussions in an effort to improve transparency around its policies.
Growth in Britain's services sector unexpectedly strengthened in April, giving the economy a solid start to Q2 after a weaker-than-forecast performance at the start of the year. The UK services PMI increased from 55 to 55.8 while consensus expected a decline to 54.5. The final EMU services PMI was upwardly revised from 56.2 to 56.4.
Brent crude temporary dipped below the $50/barrel mark to the lowest level since November last year, virtually erasing all the gains since OPEC agreed a deal to curb supplies. The oil cartel's attempts to reinforce the market have been hit by a quick rebound in US shale production and by signs OPEC exports have not fallen as fast as expected.
The Czech central bank kept its policy rate unchanged at 0.05% at its first policy meeting after leaving its EUR/CZK 27.00 peg. The central bank cut its CPI forecasts, but still sees "slightly inflationary" risks to them.
The US trade gap narrowed slightly in March to $43.7B, confounding expectations of a rise to $44.5B. Meanwhile, first-time jobless claims fell more than anticipated, from 257k to 238k and remain near multi-decade lows.
The European Commission proposed a draft law to continue shielding pension funds - a sector it sees as critical for investment in infrastructure - from having to clear their derivatives trades for a further three years, a move to save them billions of euros in collateral payments.
Rates
Core bonds sell off
Global core bonds lost significant ground today with German Bunds underperforming US Treasuries. At the time of writing, the German yield curve bear steepens with yields 1.4 bps (2-yr) to 7.6 bps (30-yr) higher. Changes on the US yield curve vary between +2.8 bps (2-yr) and +4.2 bps (5-yr). On intra-EMU bond markets, 10-yr yield spreads versus Germany narrowed 2 bps for core countries, up to 5 bps (France) for the semi-core and up to 10 bps for the periphery (Portugal).
The German Bund opened weaker and slid throughout the European session. Several factors played a role. First, some catching up with US Treasury losses in the wake of last night's Fed meeting which set the stage for a June rate hike. Second, improved risk sentiment with French assets outperforming (stocks and bonds) after centrist presidential candidate Macron cleared the final (TV Debate) hurdle ahead of Sunday's run-off against Le Pen. Third, markets anticipated (and received) more comments about the ECB's June policy meeting. While heavyweight ECB chief economist Praet wasn't as clear as ECB Nowotny earlier this week, he still suggested that the ECB could do something about its language at the June 8 policy meeting (changing forward guidance or risk assessment for growth). Later today, ECB President Draghi is still scheduled to speak. Fourth, similar anticipation about the balance sheet run-off by the Fed could be at play with Fed Yellen, Fischer, Williams, Rosengren, Evans and Bullard all scheduled to speak tomorrow. Fifth, eco data printed strong on both sides of the Atlantic, even if they were second tier. The balance of this week's US eco data also suggests that tomorrow's payrolls report will again be decent. Continued weakness of the oil price (Brent crude below $50/barrel) and commodities in general failed to stop the rod on core bond markets.
The French debt agency tapped the on the run 10-yr OAT (€3.88B 1% May2027), off the run OAT (€2.19B 2.5% May2030) and on the run 20-yr OAT (€1.93B 1.25% May2036) for a combined €8B, the upper end of the €7-8B on offer. The auction bid cover was a strong 2.11 and confirms improved demand for French OAT's since the market-friendly outcome of the French presidential election. The Spanish treasury tapped the on the run 5-yr Bono (€1.16B 0.4% Apr2022), on the run 15-yr Obligacion (€1B 2.35% Jul2033) and two off the run bonds (€1.06B 0.75% Jul2021 & €1.48B 1.3% Oct2026). The total amount sold was near the higher bound of the eyed €4-5B with a decent auction bid cover of 1.81.
Currencies
Dollar trades mixed post-Fed. Euro outperforms
European assets maintained the lead in the risk-on trade today. This trade supported both EUR/USD, USD/JPY and EUR/JPY. So, yesterday's Fed statement wasn't unequivocally positive of for the dollar. EUR/USD trades in the 1.0930 area. The 1.0950 resistance remains within reach. USD/JPY extends its risk-on rebound and is challenging the 113 big figure.
Overnight, Asian stocks mostly traded in positive territory. Chinese equities again underperformed as after the Caixin manufacturing PMI, also the services PMI declined, from 52.1 to 51.2. The dollar maintained most of its post-Fed gains. EUR/USD traded around 1.0895. USD/JPY changed hands in the 112.80 area.
European equities opened strong and momentum improved further during the day. Good corporate earnings were supportive. The eco data (final PMI's) confirmed that the European economy remains in excellent shape. EUR/USD tried a downside test early in Europe. However, the Fed keeping the door wide open for a June hike, wasn't enough to inspire further USD gains, especially not against the euro. Interest rate differentials between the US and Germany/EMU were hardly any wider compared with pre-Fed levels. As was often the case of late, the European risk-on trade caused simultaneous gains of both USD/JPY, EUR/USD and EUR/JPY. EUR/USD rebounded to the 1.0920/40 area. EUR/JPY filled offers in the 123.60 area. Investors maybe also didn't want to be euro short ahead of speeches from ECB's Praet and Draghi. ECB's Praet sounded quite upbeat on the economy, but repeated more confirmation is needed that inflation is a sustained path. The euro rally ran into resistance after the Praet comments, but the single currency maintained most of its intraday gains.
The US March trade balance was slightly smaller than expected at $43.7B. The Jobless claims declined from 257 000 to 238 000, also slightly better than expected. The impact on the dollar was limited. USD/JPY is holding near the intraday highs (113 area). EUR/USD stabilizes in the 1.0930 area. So, for now, the dollar still shows a mixed picture. In other markets, Brent oil struggles not to fall below $50/barrel. Other commodities remain also under pressure. Usually, this context is USD supportive. However, for now this trick doesn't work, especially not for USD/EUR. Euro strength prevails.
EUR/GBP trends higher on euro strength
Sterling traded relatively calm even as there was quite some UK news with potential to move the currency. In line with the manufacturing PMI and the construction PMI, confidence in the UK services sector was also stronger than expected at 55.8 from 55.00. However, sterling didn't profit. On the negative side for sterling, the Brexit-related bickering between the UK and the EU continued. This time discussion focused on the euro clearing in London as the EU prepares measures to gain control on this activity. However, also this sterling negative story had little impact on trading. Sterling trading mostly followed the major trends of euro strength and relative dollar softness. EUR/GBP drifted north to the high 0.84 area, supported by the rise of EUR/USD. However, a real test of the 0.85 big figure didn't occur. The pair trades currently around 0.8475. Cable dropped temporary lower early this morning, but rebounded north of 1.29 as the dollar couldn't maintain its post-Fed gains.
U.S. Trade Deficit Steadies In March
The U.S. trade deficit stayed almost unchanged from the upwardly revised $43.8 billion deficit recorded in February. A slightly larger goods deficit was matched by a similar increase in the services surplus.
Trade Deficit Lower Than Expected in March
The U.S. trade deficit was $43.7 billion in March, lower than what markets were expecting and just $0.1 billion lower than the slightly upwardly revised $43.8 billion deficit recorded in February. Exports of goods and services declined 0.9 percent on the month, to $191.0 billion, or $1.7 billion lower than February, while imports of goods and services declined 0.7 percent, also by $1.7 billion, to $234.7 billion.
On the export goods side, there was a strong decline in industrial supplies exports, down $1.78 billion compared to an increase of $0.29 billion in February, while automotive exports declined $0.82 billion after inching higher $0.19 billion in February. Meanwhile, consumer goods exports were down $0.65 billion in March, almost erasing the $0.69 billion increase recorded in February. Exports of food and beverages increased slightly, up $0.18 billion after falling $0.81 billion in February.
From the goods import side, imports dropped $1.81 billion with imports excluding petroleum dropping $1.11 billion after a decline of $5.07 billion in February. Meanwhile, food and beverage imports declined $0.26 billion while industrial supplies dropped $0.92 billion after increasing $0.72 billion the previous month. Capital goods imports were down $1.06 billion, the first decline since November 2016. However, automotive imports, which had declined $2.61 billion in February, increased $1.13 billion in March. On the other hand, consumer goods imports were down $0.52 billion after declining $3.11 billion in February. The March trade deficit in goods and services was the consequence of an increase of $0.4 billion in the deficit for goods and an increase of $0.4 billion in the surplus of services.
On a year-to-date comparison, the goods and services deficit increased 7.5 percent, or $9.4 billion, compared to 2016. Meanwhile, both exports of goods and services and imports of goods and services increased by 7.1 percent during the first quarter of the year.
Trade Contributes Positively to Q1 GDP Growth
Today's release of the March trade deficit in goods and services has confirmed our estimate that the trade sector contributed slightly to GDP growth in Q1. That is, if there is a downward revision to first quarter GDP growth, the odds are that other sectors would cause that revision rather than the external sector. However, we believe that the positive contribution from the external sector to economic growth is temporary. Despite our forecast that has the trade sector subtracting from economic growth to the tune of about 0.3 percent to 0.4 percent per quarter, we still expect the U.S. economy to gain strength during the rest of the year.
US Trade Balance Was Little Changed in March But Deficit Increased in Q1
Highlights:
- The US trade deficit in goods and services narrowed slightly to $43.7 billion in March from $43.8 billion in February as declines in both exports and imports roughly offset one another.
- Expectations were for a slightly larger deficit given deterioration in the goods balance in the advance report; however, a larger services surplus (not included in the advance reading) provided offset.
- Goods imports recorded a broadly-based decline while lower exports were concentrated in autos and consumer goods.
Our Take:
The US trade balance was little changed in March although the trend in recent months has been modest widening in the deficit. In fact, today's data confirms the US goods deficit in Q1 was the widest since 2008, a fact that is sure to draw the attention (and ire) of the Trump Administration. That is not to say that trade was a significant drag on growth in the quarter; today's report is consistent with the BEA's advance estimate that net trade (including services) had little impact on headline GDP growth in Q1. However, we think the focus will be on the level of the deficit rather than the rate of change. Trump's protectionist rhetoric has stepped up recently; just last week we saw threats to unilaterally withdraw from NAFTA and an executive order to review existing trade agreements. The risk of protectionism is real, though we haven't incorporated any trade policy changes in our outlook as we await more specific proposals should they emerge. Our trade forecast remains largely driven by fundamentals-a still-strong US dollar (despite some retracement year-to-date) and relative strength in domestic spending are expected to result in a modest drag on GDP growth from net trade going forward, though we don't see that inhibiting above-trend growth in the overall economy.
Canadian March Merchandise Trade Deficit Unexpectedly Shrinks to $0.1B
Highlights:
- The March merchandise trade balance improved with the deficit shrinking to $0.1B from $1.1B in February.
- The improvement reflected a very strong, and broad-based, 3.8% jump in nominal exports to a record high $47.0B, with volumes up 2.5%. Some offset to the improvement in the balance occurred from nominal imports rising 1.7% with all the increase due to higher prices as import volumes dropped 0.2%.
- Regionally, the solid rise in exports was led by increased deliveries to China, India and South Korea. Exports to the U.S. rose a negligible 0.1% contributing to a drop in our trade surplus with that country to $4.0B from $4.5B in February.
- Despite this recent strength in exports, an earlier sharp jump in imports is contributing to the real net trade balance tracking a 3.5 percentage point drag from Q1 annualized GDP growth. Strength elsewhere is expected to send annualized Q1 GDP growth up 3.8%.
Our Take:
Though today's report indicated that the trade balance remained in a deficit position for a second consecutive month, the average shortfall over this period of $0.6B is down sharply from the $2.7B average deficit that prevailed over the same period a year ago. As well, these deficits over the last two months were preceded by three months of surpluses, which were the first since September 2014. The improvement in the trade balance is in large part the result of the nominal value of energy exports recovering helped by rising oil prices. Our expectation is that further gains in oil prices going forward and rising U.S. demand will contribute to further gains in energy exports though with the pace slowing. Outside of the energy component, the improvement has been more limited though the March data did indicate a burst of strength. Our forecast assumes that the strengthening U.S economy and low value of the Canadian dollar will provide sustained support to this component going forward. The will allow overall exports to contribute to above-potential GDP growth through the forecast. However, the main risk to this outlook is potential trade restrictions emerging from the Trump Administration that will limit the extent to which Canadian exporters will be able to benefit from a strengthening U.S. economy. This risk has intensified in recent weeks with increased comments by the U.S. Administration focused on grievances with specific Canadian export categories.
Elliott Wave Analysis: German DAX Searching For A Top?
German DAX is trading in final stages of a black wave 5, specifically in sub-wave v), which means upside can be limited and a new corrective rally may follow. That said, some resistance may come in around the Fibonacci ratio of 261.8.
German DAX, 30Min
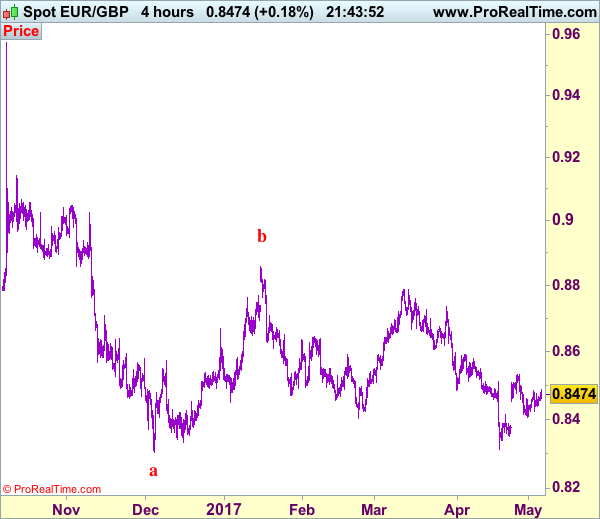
Trade Idea: EUR/GBP – Stand aside
EUR/GBP - 0.8472
Recent wave: Major double three (A)-(B)-(C)-(X)-(A)-(B)-(C) is unfolding and 2nd (A) has possibly ended at 0.6936.
Trend: Near term down
New strategy :
Stand aside
Position : -
Target : -
Stop : -
As the single currency found support at 0.8422 and has rebounded again, retaining our view that further consolidation would be seen and although recovery to 0.8500-05 cannot be ruled out, reckon upside would be limited and resistance at 0.8531 should hold. Only a break of this level would add credence to our view that a temporary low has been formed at 0.8312 and extend the rebound from there for retracement of recent decline to 0.8550, however, reckon resistance at 0.8580 would limit upside and 0.8600-10 would hold from here.
On the downside, whilst pullback to 0.8440-45 cannot be ruled out, reckon 0.8420-25 would limit downside and said support at 0.8405 would remain intact. Only a drop below this level would signal the rebound from 0.8312 has ended, bring further fall to 0.8370-75 but support at 0.8351 should remain intact, bring another rebound later. As near term outlook is mixed, would be prudent to stand aside in the meantime.
Our preferred count is that, after forming a major top at 0.9805 (wave V), (A)-(B)-(C) correction is unfolding with (A) leg ended at 0.8400 (A: 0.8637, B: 0.9491 and 5-waver C ended at 0.8400. Wave (B) has ended at 0.9413 and impulsive wave (C) has either ended at 0.8067 or may extend one more fall to 0.8000 before prospect of another rally. Current breach of indicated resistance at 0.9043 confirms our view that the (C) leg has ended and bring stronger rebound towards 0.9150/54, then towards 0.9240/50.