

Sample Category Title
USD/CAD Weekly Outlook
USD/CAD surged to as high as 1.3793 last week but lost momentum ahead of 1.3838 fibonacci level. Choppy rise from 1.2460 is seen as a corrective move. We'd stay cautious on topping at around 1.3838. Focus will also be on 1.3534 resistance turned support. Break there will indicate reversal.
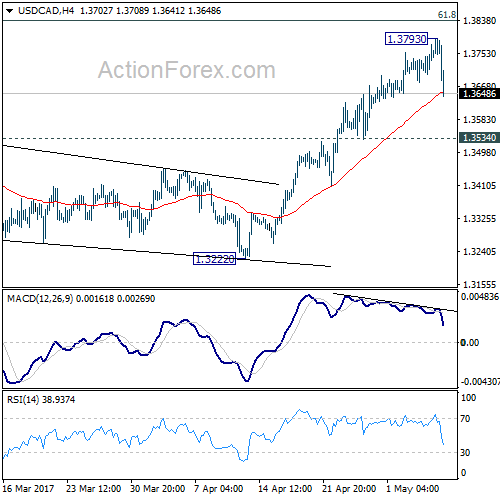
Initial bias in USD/CAD is neutral this week for consolidation first. In case of another rise, we'll be cautious on topping at around 1.3838 fibonacci level. Meanwhile, consider bearish divergence condition in 4 hour MACD, break of 1.3534 support will argue that rise from 1.2968 is already completed. In such case, intraday bias will be turned back to the downside for 1.3222 support.
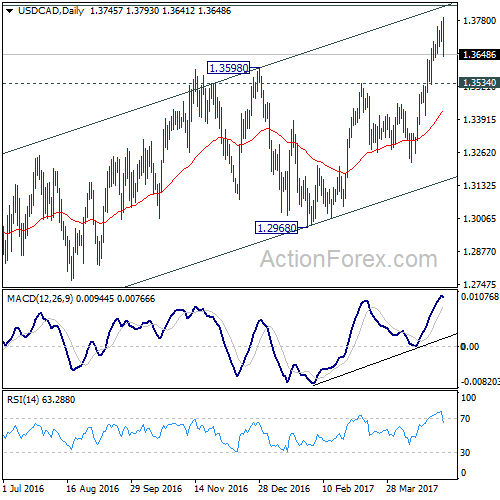
In the bigger picture, price actions from 1.4689 medium term top are seen as a correction pattern. The first leg has completed at 1.2460. Rise from 1.2460 is seen as the second leg and would end at around 61.8% retracement of 1.4689 to 1.2460 at 1.3838. Break of 1.3222 should indicate the start of the third leg while further break of 1.2968 should confirm. Nonetheless, sustained trading above 1.3838 would pave the way to retest 1.4689 high.
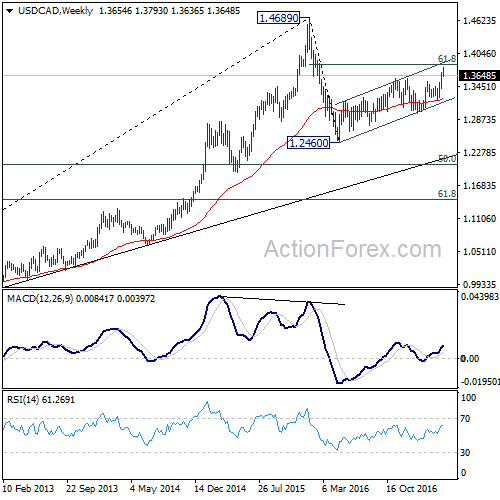
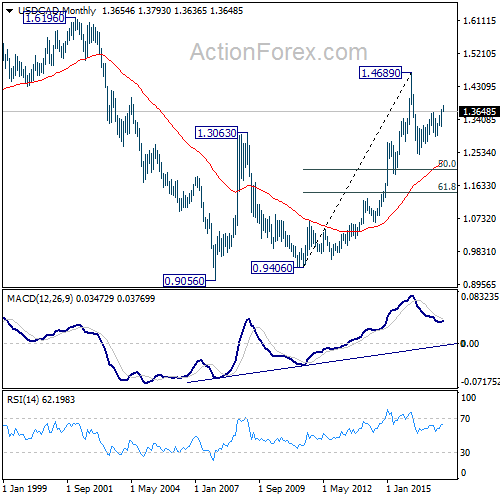
In the longer term picture, rise from 0.9056 (2007 low) is viewed as a long term up trend. It's taking a breath after hitting 1.4689. But such rise expected to resume later to test 1.6196 down the road.
GBP/JPY Weekly Outlook
GBP/JPY surged to as high as 146.42 last week. The development was in line with the view of resumption of rise from 122.36. Further rally is expected through 148.42 resistance to 150.42 fibonacci level.
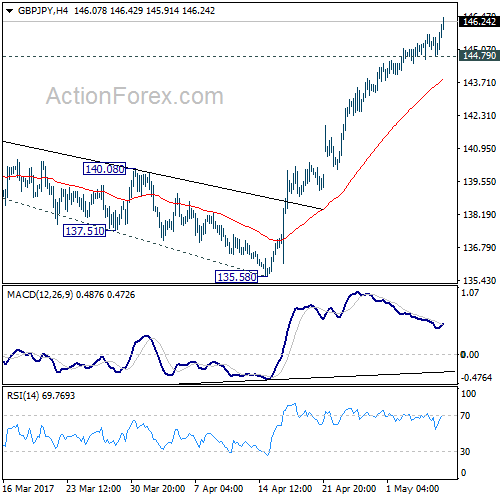
Initial bias in GBP/JPY remains on the upside for 148.42 resistance. Break will resume rise from 122.36 to 150.42 resistance. Further break there will target 100% projection of 122.36 to 148.42 from 135.58 at 161.64. On the downside, below 144.79 minor support will turn bias neutral and bring consolidation before staging another rise.
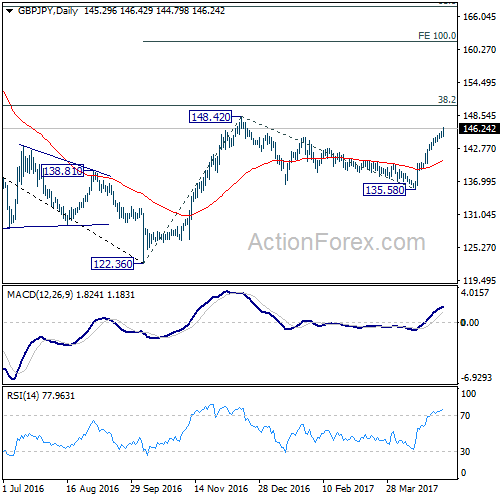
In the bigger picture, based on current momentum, rise from 122.36 bottom should be developing into a medium term move. Break of 38.2% retracement of 195.86 to 122.36 at 150.42 should pave the way to 61.8% retracement at 167.78. This will now be the favored case as long as 135.58 support holds.
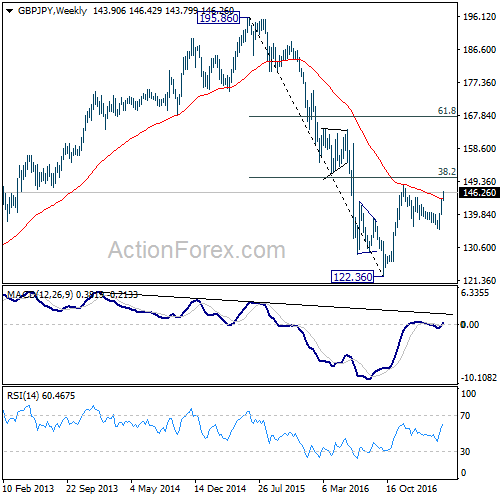
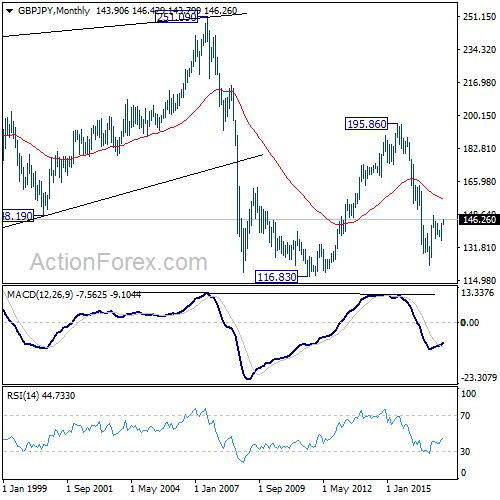
In the longer term picture, based on the impulsive structure of the decline from 195.86 to 122.36, such fall should not be completed yet. But we will now pay close attention to the structure of the rise from 122.36 to determine whether it's a corrective move, or an impulsive move. That would decide whether a break of 116.83 low would be seen.
EUR/JPY Weekly Outlook
EUR/JPY's rally extended to as high as 124.04 last week, just inch below 124.08 resistance. The development confirmed that rise from 109.03 is resuming. Further rally is expected this week for 126.09 resistance next.
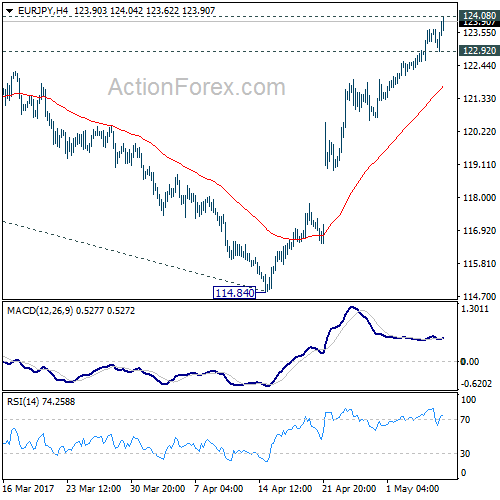
Initial bias in EUR/JPY remains on the upside this week. Break of 124.08 will resume whole rise from 109.03 and target 126.09 key resistance next. Break there will pave the way to 100% projection of 109.03 to 124.08 from 114.84 at 129.89. On the downside, below 122.92 minor support will turn bias neutral and bring retreat first.
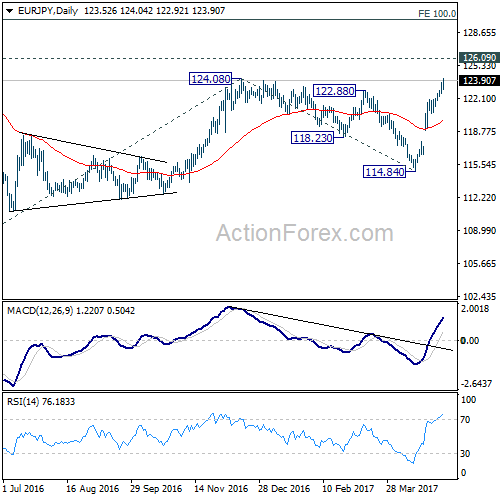
In the bigger picture, focus is back on 126.09 support turned resistance. Decisive break there will confirm completion of the down trend from 149.76. And in such case, rise from 109.20 is at the same degree and should target 141.04 resistance and above. Meanwhile, rejection from 126.09 and break of 114.84 will extend the fall from 149.76 through 109.20 low.
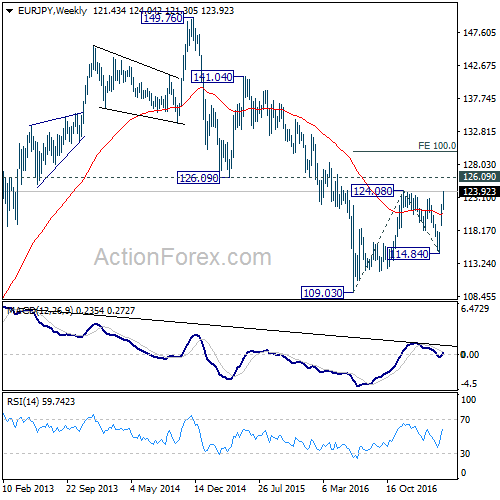
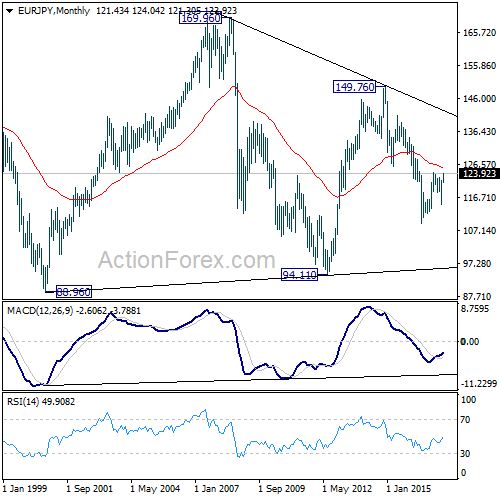
In the long term picture, medium term decline from 149.76 is seen as part of a long term sideway pattern from 88.96. We're not seeing any sign of an established long term trend yet. Hence, we'll be cautious on strong support at 94.11 in case of another fall. Also, there could be strong resistance at 149.76 in case of a medium term rise.
EUR/GBP Weekly Outlook
EUR/GBP stayed in sideway trading last week and near term outlook is a bit mixed. We'll stay neutral for the moment and monitor the development. But after all, there is no change in the view that price action from 0.9304 are forming a corrective pattern. Such pattern would extend in near term.
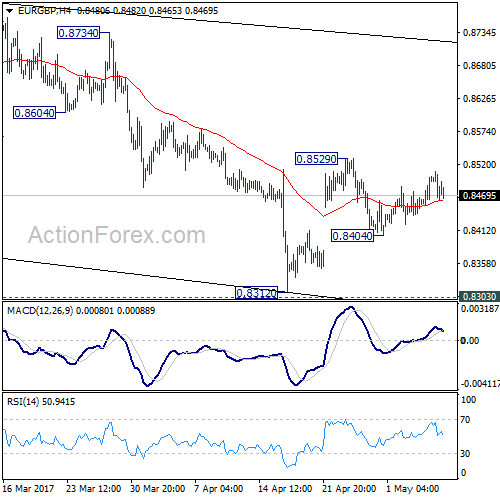
Initial bias in EUR/GBP remains neutral this week first. On the downside, below 0.8404 will turn focus back to 0.8303 low. Break there will extend the whole corrective pattern from 0.9304. In that case, we'd expect strong support from 0.8116 to contain downside and bring rebound. On the upside, above 0.8529 will resume the rebound from 0.8312 towards 0.8786 resistance.
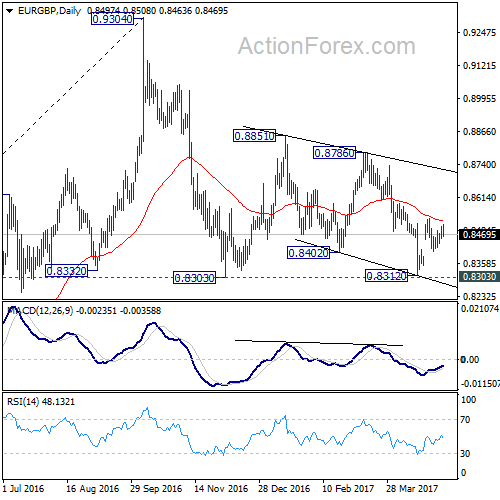
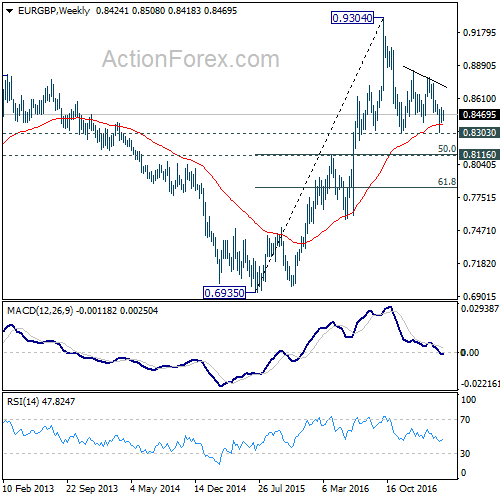
In the bigger picture, price actions from 0.9304 are viewed as a medium term corrective pattern. In case of deeper fall, we'd expect strong support from 0.8116 cluster support (50% retracement of 0.6935 to 0.9304 at 0.8120) to contain downside. Rise from 0.6935 (2015 low) will resume at a later stage to 0.9799 (2008 high). However, sustained break of 0.8116 could bring deeper decline to next key support level at 0.7564 before the correction completes.
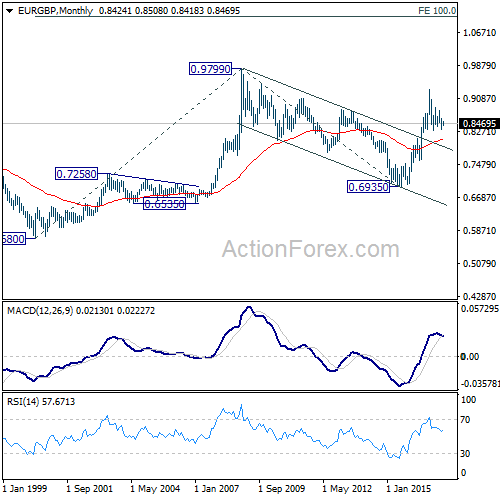
In the long term picture, firstly, price action from 0.9799 (2008 high) is seen as a long term corrective pattern and should have completed at 0.6935 (2015 low). Secondly, rise from 0.6935 is likely resuming up trend from 0.5680 (2000 low). Thirdly, this is supported by the impulsive structure of the rise from 0.6935 to 0.9304. Hence, after the correction from 0.9304 completes, we'd expect another medium term up trend to target 0.9799 high and above.
EUR/AUD Weekly Outlook
EUR/AUD's rise from 1.3624 accelerated to as high as 1.4909 last week. The strong break of 1.4721 resistance confirmed our view of trend reversal. That is the whole decline form 1.6587 has completed at 1.3624 after defending 1.3671 key support level. Further rally is now expected to next fibonacci level at 1.5455.
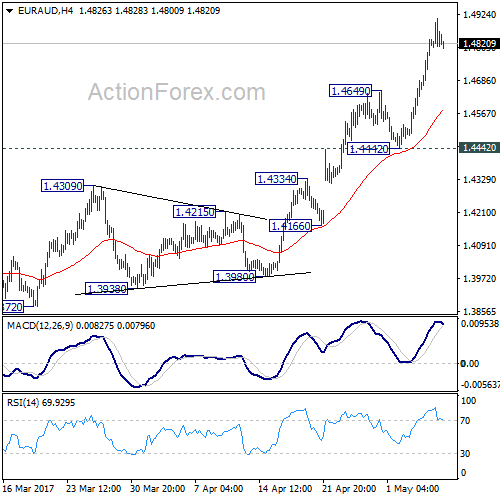
Initial bias in EUR/AUD remains on the upside this week. Current rally should now target next medium term fibonacci level at 1.5455. On the downside, touching 1.4649 minor support will turn bias neutral and bring consolidation. But retreat should be contained by 1.4442 support and bring rise resumption.
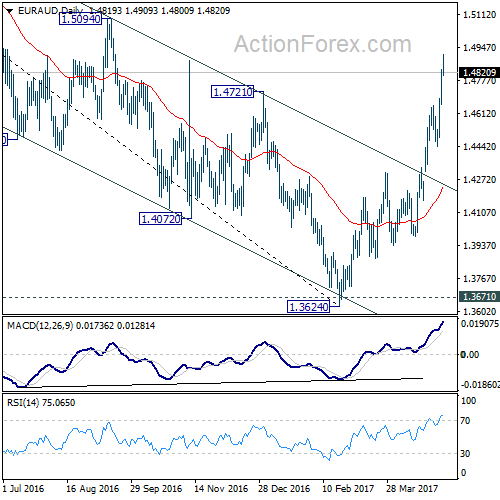
In the bigger picture, price actions from 1.6587 medium term top are viewed as a corrective pattern. Such correction should be completed after defending 1.3671 key support. Rise from 1.3642 is now expected to target 61.8% retracement of 1.6587 to 1.3624 at 1.5455 and above. In any case, outlook will now stay cautiously bullish as long as 1.4309 resistance turned support holds.
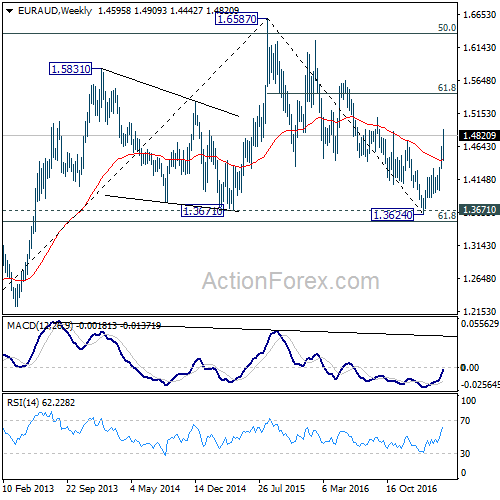
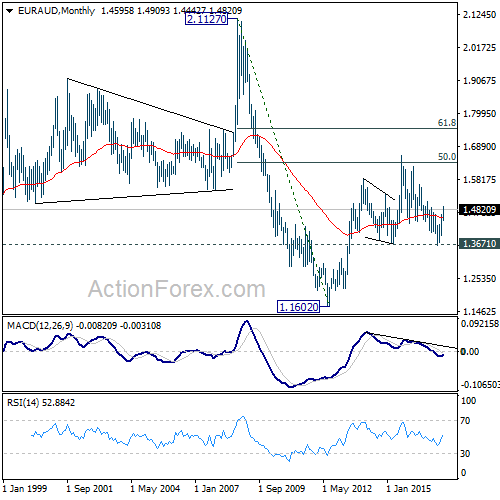
In the longer term picture, the rise from 1.1602 long term bottom isn't over yet. We'll keep monitoring the development but there is prospect of extending the rise to 61.8% retracement of 2.1127 to 1.1602 at 1.7488 and above. However, sustained trading below 1.3671 should confirm trend reversal and target 1.1602 long term bottom again.
EUR/CHF Weekly Outlook
EUR/CHF engaged in sideway trading last week and outlook is unchanged. We're holding on to the bullish view of trend reversal. Upside break out is expected after the consolidation completes.
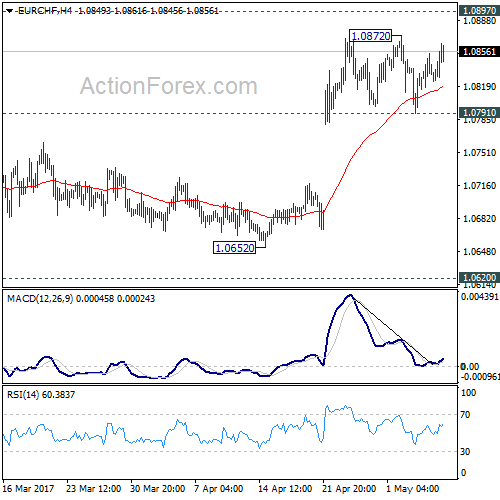
Initial bias in EUR/CHF is neutral this week first. Further rally is expected as long s 1.0791 support holds. Break of 1.0872 will extend current rise to 1.0897 resistance. Decisive break there should confirm our bullish view of reversal and will target 1.0999 resistance next However, break of 1.0791 support will indicate short term topping and turn bias back to the downside for 55 day EMA (now at 1.0739).
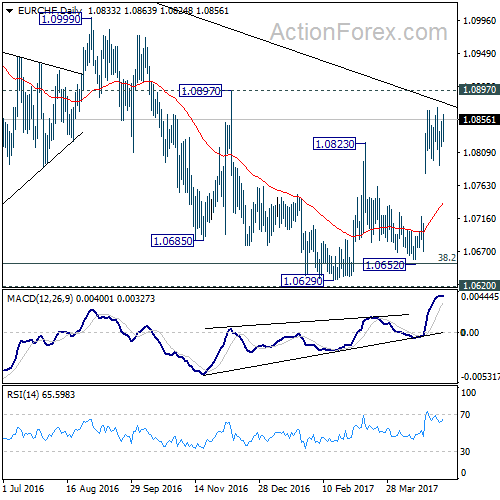
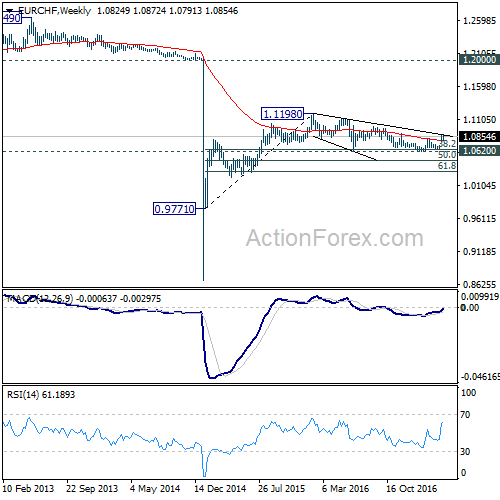
In the bigger picture, the price actions from 1.1198 are seen as a corrective move. Current strong rebound is raising the chance that it's completed after defending 38.2% retracement of 0.9771 to 1.1198 at 1.0653. Decisive break of 1.0999 resistance will target a test on 1.1198 high. For now, this will be the preferred case as long as 1.0652 support holds.
Eco Data 5/12/17
[php_everywhere] [/php_everywhere]
Eco Data 5/11/17
[php_everywhere] [/php_everywhere]
Eco Data 5/10/17
[php_everywhere] [/php_everywhere]
Eco Data 5/9/17
[php_everywhere] [/php_everywhere]