Sample Category Title
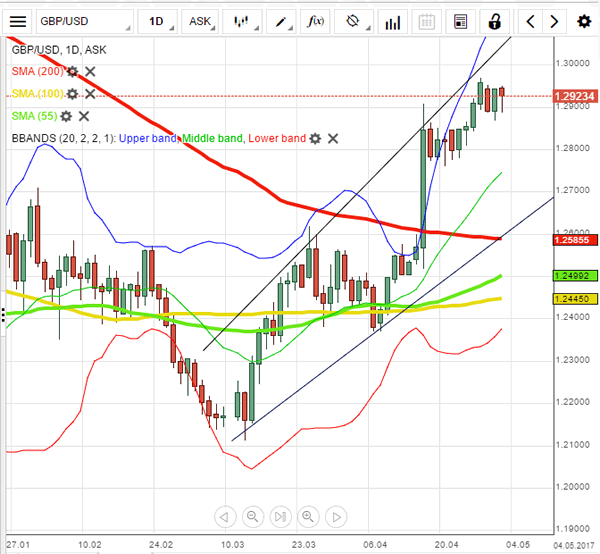
GBPUSD Analysis: Expected To Return Under 1.29
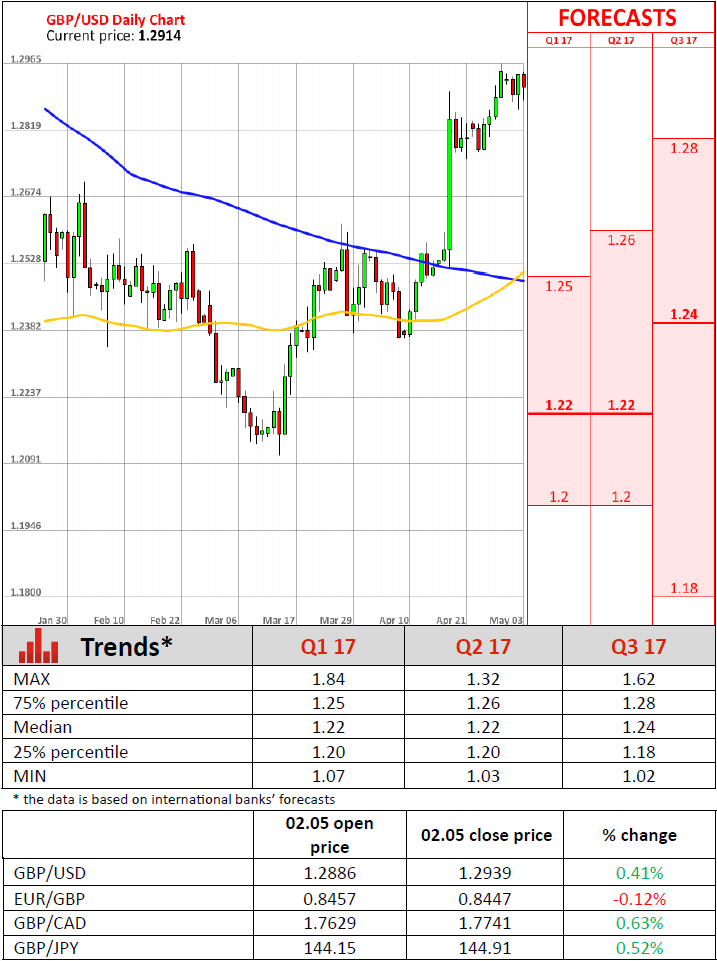
'We expect GBPUSD to drop to 1.23 in 3M on a combination of 1) general USD strength and 2) a rocky start to the UK/EU negotiations for an exit agreement.' – BMO Capital Markets (based on PoundSterlingLive)
Pair's Outlook
The British Pound surprised with its performance on Tuesday, being that it outperformed the US Dollar and reclaimed the 1.29 level. Technical indicators today keep giving positive signals, suggesting the Sterling is to edge higher against the Buck for another day. Such an outcome is possible, but in this case gains are likely to be capped around 1.3020, with the broadening rising wedge's upper border and the weekly R1 representing resistance there. On the other hand, upbeat US fundamentals could boost the Greenback, which would cause the Cable to fall even under the second support, namely the weekly S1.
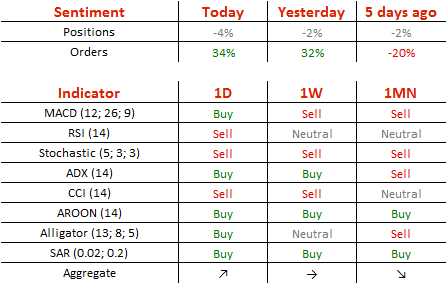
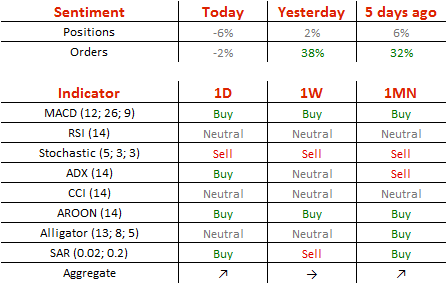
Traders' Sentiment
There are 52% of traders holding short positions today (previously 51%), whereas 67% of all pending orders are to acquire the Pound.
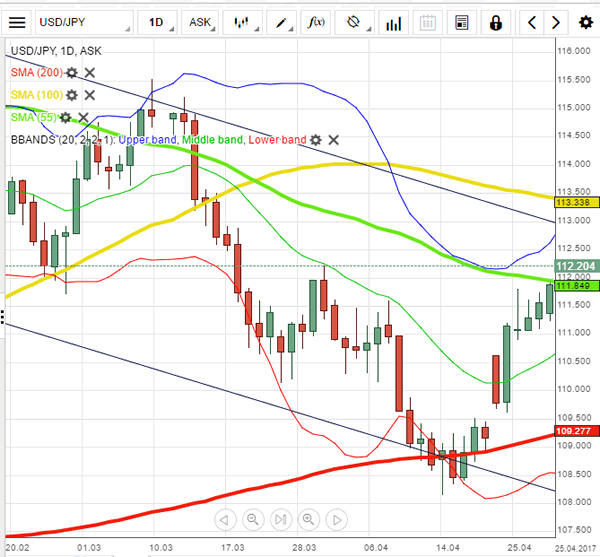
USD/JPY Analysis: Attempts To Reach 113.00
'Concerns about geopolitical risks such as North Korea had weighed on the dollar against the yen recently... But the focus is shifting to whether the (strength) of US economic fundamentals is for real. There is more data coming up including the jobs data, so those need to be watched closely.' – Sumitomo Mitsui Banking Corporation (based on The Business Times)
Pair's Outlook
Despite having appreciated against the Japanese Yen yesterday, the US Dollar still retreated from its intraday high, as it lacked momentum to pierce the second resistance level. Nevertheless, the USD/JPY pair has the opportunity to pierce this supply level today, with the 112.95 level expected to be the intraday high, as it marks the descending channel's upper border. The given trend-line is also reinforced by the upper Bollinger band and the monthly R1, while technical indicators are now giving bullish signals in the daily timeframe. The base case scenario, however, is a close around 112.60.
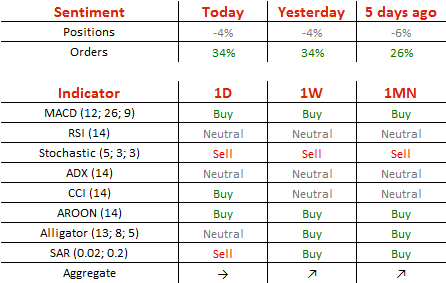
Traders' Sentiment
Market sentiment is relatively neutral, as 53% of all open positions are short and the remaining 47% are long. At the same time, the number of orders to buy the Buck plunged from 69 to 49%.
Gold Analysis: Continues Lower
'The Fed meeting is the next likely catalyst for gold.' – Jordan Eliseo, ABC Bullion (based on Reuters)
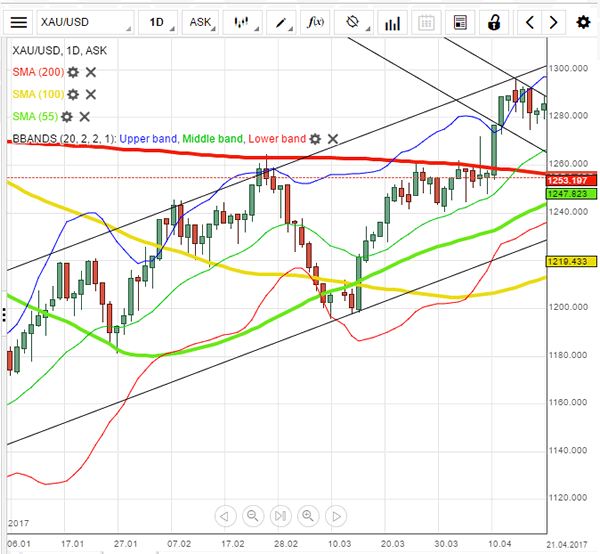
Pair's Outlook
The yellow metal's price is fluctuating, as forecasted. The metal hit the support cluster below it near the 1,252 level and made a slight rebound. On Wednesday morning the metal traded above the support cluster, which is made up of the 55 and 200-day SMAs, the weekly S2, the lower trend line of a medium scale descending channel and the 50.00% Fibonacci retracement level. All of these levels of significance make the 1,250 mark a strong foundation for the bullion. Due to that it is even unlikely that the will pass this support soon.
Traders' Sentiment
SWFX market sentiment remains unchanged, as 52% of open positions are short, and 67% of trader set up orders are to buy.
UK Manufacturing Sector Witnesses Its Best Performance In Three Years Last Month
'This is better news for the UK economy, after a very gloomy end to last week. However, we hesitate to get too excited. (Even) if the manufacturing and export upswing seen in H2 2016 does have further to run, these are not the key drivers for the UK economy more widely.' - Elizabeth Martins, HSBC
British manufacturing activity hit its best since 2014 last month, supported by a solid global economic recovery and the weak Pound. Markit/CIPS reported on Tuesday that its Purchasing Managers' Index for the British manufacturing sector came in at 57.3 in April, following the preceding month's 54.2 and surpassing analysts' expectations for a decline to 54.0. Tuesday's data is set to provide an additional support to the current British Prime Minister Theresa May ahead of the June 8 National Election. According to the data, British manufacturers enjoyed the recent positive performance of the global economy and the cheaper Sterling, which boosted export growth. However, back in March, the Bank of England Deputy Governor Ben Broadbent said that a rebound in the performance of the UK manufacturing sector might vanish soon and the future performance of the sector would solely depend on the outcome of Brexit negotiations. Moreover, some analysts claim that manufacturers will stop benefiting from the weak currency soon. Nevertheless, Tuesday's data is set to please the Central bank, which is due to meet next week. After the release, the British Pound hit its seven-month high against the US Dollar but failed to sustain its gains.
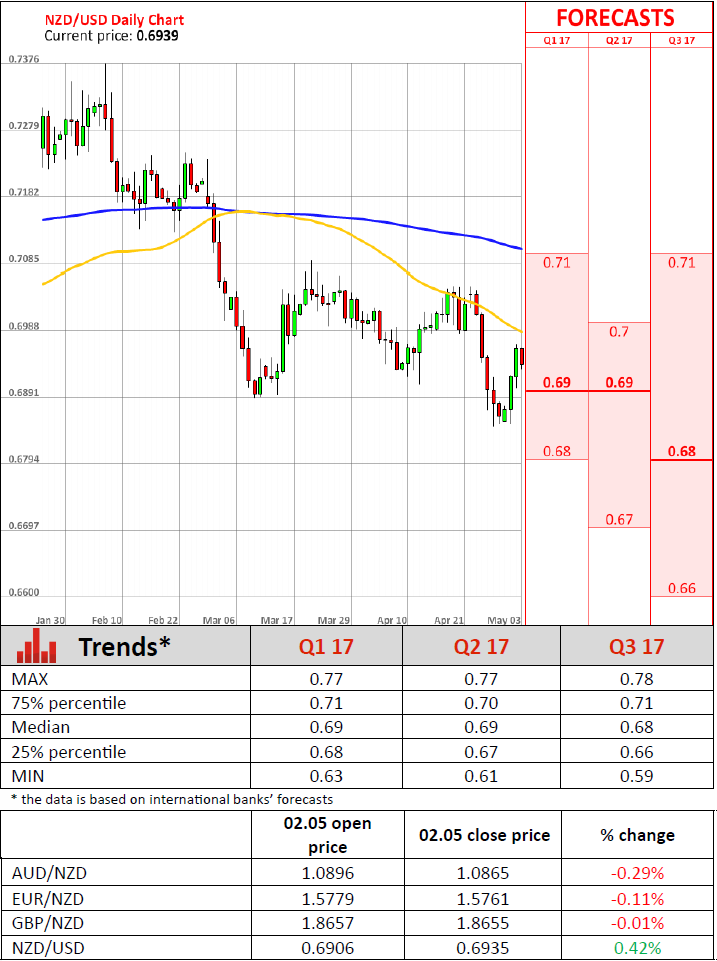
New Zealand Employment Data Beats Experts’ Expectations, Dairy Product Prices Nudge 3.6%
'Economic projections suggest New Zealand is poised for faster growth in coming years, a narrative that plays into the hands of a dynamic local workforce.' - Sam Bourgi, Economic Calendar
The New Zealand unemployment rate fell unexpectedly, official figures revealed on Tuesday. In the March quarter, the seasonally adjusted jobless rate dropped to 4.9%, while analysts expected only a minor change from 5.2% to 5.1%. The plunge was mainly associated with the fewer men being unemployed. Namely, the number of jobless males slipped to 4.2%, which is the lowest level since the December 2008 quarter. In the meantime, the employment rate soared 1.2% and also exceeded experts' evaluations, who anticipated only a slight increase from 0.7% to 0.8%. The released report showed that growth in employment outpaced growth in the working-age population for the six-consecutive quarter and, thus, added 0.3% to spike in the employment rate. Another data released on Tuesday revealed that the GDT Price Index in the ninth auction in 2017 climbed 3.6%, following an increase of 3.1% in the previous auction. This data marked the fourth successive gain in a row even though prices remained below the Q4 2016 levels. Nevertheless, many experts believe that in the short-term New Zealand's dairy products exports will increase amid surging demand from China. Overall, it is quite unusual for dairy prices to surge at this time of the year.
FOMC: Will They Pave The Way For A June Hike?
Today, all eyes will be turned to the FOMC rate decision. The forecast is for the Committee to keep borrowing costs unchanged, something supported by market pricing, which indicates a 95% probability for no action. Bearing also that this meeting does not include updated forecasts or a press conference, market action will most likely come from the language of the statement accompanying the decision.
Recent comments from various Fed officials are in line with the 'dot plot', which points to another two hikes this year. However, these were before the nation’s core inflation data for March revealed a slowdown. From a growth perspective, economic activity slowed markedly in Q1, but according to the March minutes, the Committee views some of this softness as transitory. On the bright side, the labor market appears quite robust overall.
Bearing these mixed data in mind, we expect the Fed to maintain a more or less balanced tone, with risks tilted towards a slightly more cautious narrative than previously. Before clearly communicating that further near-term normalization is on the cards, policymakers may prefer to wait for a rebound in the data and even some clarity surrounding fiscal policy. In case the Fed disappoints investors looking for strong hints regarding a June hike, USD could come under selling interest.
USD/JPY has been trending higher since the 18th of April, but the trend shows signs of weakening momentum recently. Now, the rate is trading between the support of 111.90 (S1) and the resistance of 112.35 (R1), and we expect it to continue trading near that range heading into the FOMC decision. In case the Fed adopts a more cautious stance than previously, the pair may slide below 111.90 (S1), initially aiming for the next support of 111.40 (S2). Switching to the daily chart, we see that the pair continues to trade within the downside channel that has been containing the price action since the start of the year.
The proximity to the upper bound of that channel combined with the slowdown of the latest recovery, amplify the case for the pair to turn down again soon.
NZD spikes higher on strong employment data
Overnight, the Kiwi dollar came under buying interest following the release of the nation’s employment data for Q1. The report was quite strong, with the unemployment rate unexpectedly dropping and the labor force participation rate rising. These suggest that the labor market continues to tighten at a rapid pace. Coming on top of the solid inflation figures for the same quarter, we think that these data enhance the case for the RBNZ to appear less dovish than previously when it meets next week.
NZD/USD edged up on the employment data, breaking above the resistance (now turned into support) of 0.6940 (S1). The latest recovery started from near 0.6880 (S3), which happens to be the lower bound of the longer-term sideways range between that zone and the 0.7400 territory. Therefore, there is the possibility for the pair to continue trading higher for a while, at least heading into next week’s RBNZ gathering. We expect the bulls to challenge the 0.6980 (R1) resistance soon, where a clear break is possible to target the 0.7020 (R2) hurdle and the downside resistance line drawn from the peak of the 21st of March.
As for the rest of today’s highlights:
During the European day, the UK construction PMI for April is expected to have declined somewhat. However, following the unexpected surge in the manufacturing index for the month, we see the risks surrounding that forecast as skewed to the upside. In case of a positive surprise, GBP could come under renewed buying interest.
From Eurozone, we get the flash preliminary estimate of GDP for Q1. We also get the bloc’s PPI for March, as well as Germany’s unemployment rate for April.
As for the US data, we get the ADP employment report for April and the ISM non-manufacturing PMI for April. The ADP figure is expected at 190k, a solid number, while the ISM index is expected to have risen. Even though USD could gain on these data, its direction over the next couple of days may be primarily decided by the FOMC signals.
USD/JPY
Support: 111.90 (S1), 111.40 (S2), 111.00 (S3)
Resistance: 112.35 (R1), 112.90 (R2), 113.50 (R3)
NZD/USD
Support: 0.6940 (S1), 0.6900 (S2), 0.6880 (S3)
Resistance: 0.6980 (R1), 0.7020 (R2), 0.7050 (R3)
Daily Technical Analysis: EURUSD, GBPUSD, USDJPY, USDCHF
EURUSD
The EURUSD had a moderate bullish momentum yesterday topped at 1.0933 and hit 1.0936 earlier today in Asian session but still trapped inside the range area as you can see on my H1 chart below. The bias is bullish in nearest term testing 1.0950. A clear break above that area could trigger further bullish pressure testing 1.1100 – 1.1050 area. Immediate support is seen around 1.0900. A clear break below that area could lead price to neutral zone in nearest term testing 1.0850 key support which need to be broken to the downside for a revisit to pre-gap level at 1.0730. Overall I remain neutral.
GBPUSD
The GBPUSD regained its bullish momentum yesterday topped at 1.2939 and hit 1.2946 earlier today in Asian session. The bias is bullish in nearest term testing 1.2965. A clear break above that area could trigger further bullish pressure testing 1.3000 – 1.3050 area as a part of the double bottom bullish scenario on daily chart. From an H1 chart perspective as you can see on my H1 chart below, price is consistently moving above the EMA 200 suggests a valid bullish trend. Immediate support is seen around 1.2910. A clear break below that area could lead price to neutral zone in nearest term testing 1.2865 but only a clear break back below 1.2780/50 would interrupt the double bottom bullish scenario.
USDJPY
The USDJPY attempted to push higher yesterday topped at 112.30 but closed a little bit lower at 112.00. The bias remains bullish in nearest term but we need a consistent move above 112.20 to continue the bullish scenario testing 112.90 region as a part of the bullish phase after broke above the trend line resistance as you can see on my H1 chart below. Immediate support is seen around 111.75. A clear break below that area could lead price to neutral zone in nearest term testing 111.45 – 110.85 support area which is a good place to buy.
USDCHF
The USDCHF had a bearish momentum yesterday bottomed at 0.9912 and hit 0.9908 earlier today in Asian session. The bias is bearish in nearest term testing 0.9880 – 0.9813 area. Immediate resistance is seen around 0.9935. A clear break above that area could lead price to neutral zone in nearest term testing 0.9960 but key resistance remains at 1.0020 area which is a good place to sell with a tight stop loss. Overall I remain neutral.
Triangle On EURUSD Points Higher
Triangles are five wave patterns in a contracting shape that occurs in the middle of an uptrend. Well, this is exactly what we see on EURUSD hourly chart, so price structure suggests that a new push higher is coming. There is room for 1.1000 area to be hit this week where in fact upside could be limited. Why? Because we know that 'triangles occur prior to the final move within a larger structure', so any new leg up should then be final piece within a larger uptrend; blue wave five in our case. From an invalidation point of view, pattern will have to be changed if wave a) support will be broken.
EURUSD, 1H
Technical Outlook: USDJPY – Bulls Are Looking For Renewed Attack Ad Daily Cloud Base
The pair remains steady and returns above 112.00 handle after Tuesday's rally showed hesitation at the base of thickening daily cloud (spanned between 112.30 and 112.85).
Bullish daily technicals are supportive for further advance, with bullish signals to be generated on close above cracked 112.14 barrier (Fibo 38.2% of 118.65/108.11 descend) and penetration into daily cloud.
Lift above the cloud would look for test of 100SMA at 113.28 and 50% retracement of 118.65/108.11 at 108.11).
Correction low at 111.93 and rising hourly cloud (spanned between 111.89 and 111.70), mark initial supports which are expected to ideally contain dips and reduce risk of deeper pullback.
Res: 112.30, 112.67, 112.85, 113.28
Sup: 111.90, 111.70, 111.47, 111.19
Technical Outlook: GBPUSD – Key Supports At 1.2860 Zone Hold Consolidation For Now
Cable is holding between strong supports at 1.2859/67 zone (rising 10SMA / Tue's low / daily Tenkan-sen) and recovery highs at 1.2938/45 in early Wednesday, after being unable to extend Tuesday's data-driven rally towards key barrier at 1.2963 (28 Apr high).
Overall bullish structure is underpinned by multiple Golden-crosses (10, 20, 30 / 200SMA's) but reversal of slow stochastic from overbought zone, which generated negative signal, balances.
Studies on lower timeframes also give mixed signals, as hourly cloud (1.2919/1.2894) has been dented on probes below cloud base, while ascending thick 4-hr cloud (1.2847/1.2714) continues to underpin.
Bulls are expected to remain in play for final probe above 1.2963 pivot and attack at psychological 1.3000 barrier while consolidation is held by strong 1.2860 support zone.
Otherwise, increased risk for deeper pullback could be expected on sustained break lower.
Res: 1.2945, 1.2963, 1.3000, 1.3055
Sup: 1.2883, 1.2859, 1.2821, 1.2770