Sample Category Title
Safe-Haven Metals Could Be Gearing Up To Recover
Key Points:
- Silver and gold likely to begin a recovery moving forward.
- Risk appetite may not be as great as it appears at first glance.
- FOMC unlikely to deliver a rate change and impact the metals.
It is always prescient to look at gold and silver prices in the lead up to an FOMC meeting and this time is no different. As a result, we will be investigating both the technical and fundamental factors that are likely to be impacting the metals over the coming days to try and establish a bias.
Beginning with gold's technicals, it is a generally simple story here and the EMA readings give us most of the information we need. Notably, the 12, 20, and 100 day averages are arranged in a fairly bullish fashion and the formation of a doji candle is hinting that the 38.2% Fibonacci level is set to remain in place. This will come as little surprise given that this point also falls in line with a rather visible and long-term point of inflection around the 1251.35 handle.
As for silver's technicals, these are a little more complex as the moving averages are actually contrary to the rally that we are forecasting for the two metals. Luckily, similar to gold, silver has seen a doji candle with a very long shadow form in the prior session just as price action challenged a robust historical support. Typically, this would indicate that bearish momentum is running short and that we are about to see a strong reversal, a forecast reinforced by the highly oversold RSI reading.
Moving onto the fundamentals, the role of these two metals as safe havens may raise questions as to why a rally is forecasted given the seemingly risk-on approach being taken by the market recently. Indeed, the VIX has been tumbling lower over the past fortnight, sinking from around the 15.00 mark all the way back to its current 10.47 reading. In line with this, stock prices have moved back to challenge March's highs which is also a signal of increased risk appetite.
However, if we investigate what has been going on in the bond markets we see a slightly different story unfolding which could hint that underlying fears are greater than it might seem at first glance. More precisely, stocks are no longer strongly outperforming bonds and the two assets classes are delivering similar returns. This shift back towards the relative safety of bonds suggests that we could quite easily see a shift in sentiment capable of driving both gold and silver higher moving ahead.
Ultimately, we may need to see another geopolitical shake up from Trump and friends before we get enough momentum in place to see this underlying market fear capitalised on. However, the near-term technical bias should at least prevent further losses for silver and gold amid the increased volatility in the lead up to the FOMC meeting. Additionally, given we are very unlikely to see rates changed, this technical bias could spark a decent rally in the wake of the announcement which is worth keeping in mind.
Trade Idea : USD/CHF – Stand aside
USD/CHF - 0.9918
Most recent candlesticks pattern : N/A
Trend : Near term down
Tenkan-Sen level : 0.9915
Kijun-Sen level : 0.9934
Ichimoku cloud top : 0.9953
Ichimoku cloud bottom : 0.9930
New strategy :
Stand aside
Position : -
Target : -
Stop : -
Although the greenback retreated after faltering below resistance at 0.9969 and retest of indicated strong support at 0.9893 cannot be ruled out, break there is needed to confirm recent decline from 1.0108 top has resumed and extend weakness to 0.9865-70 (2 times extension of 1.0108-1.0008 measuring from 1.0067), however, support at 0.9831 would hold from here, bring rebound later.
If said support at 0.9893 continues to hold, then further choppy trading within 0.9893-0.9981 range would take place and another bounce to 0.9966-69 cannot be ruled out but said upper range at 0.9981 should limit upside, bring retreat. Only a break of 1.0000-08 resistance would confirm a temporary low has been formed at 0.9893, bring retracement of recent decline to 1.0025-30 (61.8% Fibonacci retracement of 1.0108-0.9893) but price should falter well below resistance at 1.0067. As near term outlook is still mixed, would be prudent to stand aside for now.

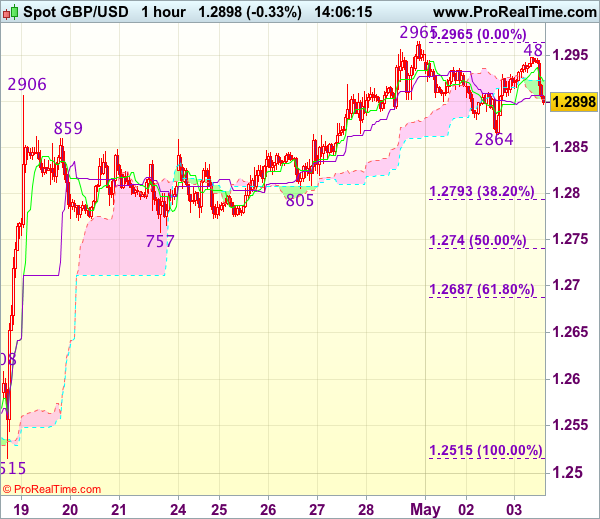
Trade Idea : GBP/USD – Buy at 1.2790
GBP/USD - 1.2892
Most recent candlesticks pattern : N/A
Trend : Near term up
Tenkan-Sen level : 1.2920
Kijun-Sen level : 1.2906
Ichimoku cloud top : 1.2923
Ichimoku cloud bottom : 1.2902
Original strategy :
Buy at 1.2790, Target: 1.2910, Stop: 1.2755
Position : -
Target : -
Stop : -
New strategy :
Buy at 1.2790, Target: 1.2910, Stop: 1.2755
Position : -
Target : -
Stop : -
Although cable rebounded to 1.2948, the subsequent retreat after faltering below resistance at 1.2965 has retained our view that further consolidation below this level would be seen and another corrective fall to 1.2864 support is likely, below there would bring retracement of recent rise to 1.2840-45, then towards support at 1.2805 but reckon downside would be limited to 1.2790-95 (38.2% Fibonacci retracement of 1.2515-1.2965) and bring another rise later. Above 1.2948 would bring retest of 1.2965, break there would confirm upmove has resumed for headway towards 1.2990-00 (1.236 times projection of 1.2109-1.2616 measuring from 1.2365 and psychological resistance).
In view of this, would not chase this rise here and would be prudent to buy cable on further subsequent pullback as downside should be limited to 1.2790-95. A drop below previous support at 1.2757 would abort and signal top is formed instead, bring correction to 1.2740 (50% Fibonacci retracement of 1.2515-1.2965) first.
EUR/USD Continuing To Trade Close To The 1.09 Level
Market movers today
In the US, the FOMC meets today. This meeting is one of the small meetings (no updated projections and no press conference) and we do not expect any changes in monetary policy or any major changes in the statement .
In the euro area, the figures for Q1 GDP growth are due out . Throughout Q1, we observed strong activity indicators, with the PMIs and IFO climbing notably to levels not seen since 2010. Therefore, we estimate 0.4% quarterly growth for Q1.
This evening, we will also have the final TV debate between the two French presidential candidates Marine Le Pen and Emmanuel Macron. Although Macron is still leading with a 20pp margin in the polls, the impact of the TV debate should not be underestimated in shifting voting intentions in favour of Le Pen in case of a convincing performance today.
Note that we are due to get ADP employment for April in the US today, which should give us a firstimpression of the shape of the labour marketin April ahead of Friday's jobs report .
In the US, ISM non-manufacturing index is also due for release today.
EIA crude inventory data is due to be released today. The market will be positioned for a drop following the API report yesterday, which was said to show a 4.2mb drop in crude stocks last week.
Selected market news
Risk sentimentremains on the positive side in financial markets with stock markets and commodity markets in general inching higher and the VIX index hovering around low levels ahead of the FOMC meeting tonight and the US jobs report on Friday – two events that will help shape market expectations about upcoming decisions on rates and the Federal Reserve balance sheet in the US.
Yesterday, the ECB's Ewald Nowotny said that 'at the (ECB) meeting in June, we will have to discuss the future strategy, the strategy for the beginning of 2018...itis clear that the (asset purchasing) program has been and is a success. But on the other hand, itis also clear thatit must not become a permanent facility... thatis t he challenge we face', he added. 'The longer such a program continues, the more one must think about its consequences'. Therefore, he added to the speculation about whether an ECB exit from the current stimulus is moving closer, although the market did notreact to the comments with EUR/USD continuing to trade close to the 1.09 level.
The American Petroleum Institute was said to report yesterday that US crude stocks fell 4.2mb last week – a large draw, albeit from a high level. The stock figures did not manage to turn the current bearish sentiment in the oil market . The price on Brent crude is currently trading around USD51/bbl. The combination of global crude stock level and oil price will be two decisive factors for OPEC in deciding on an extension of the current production cuts. The cartel is set to meet on 25 May to decide on this matter.
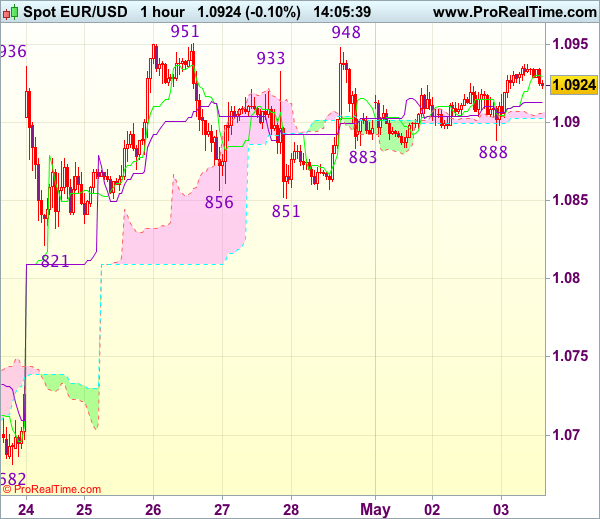
Trade Idea : EUR/USD – Stand aside
EUR/USD - 1.0923
Most recent candlesticks pattern : N/A
Trend : Near term up
Tenkan-Sen level : 1.0929
Kijun-Sen level : 1.0913
Ichimoku cloud top : 1.0906
Ichimoku cloud bottom : 1.0903
New strategy :
Stand aside
Position : -
Target : -
Stop : -
Although the single currency rebounded after holding above support at 1.0883, break o indicated resistance at 1.0951 (last week’s high) is needed to signal recent upmove from 1.0340 low has resumed for headway to 1.0975-80 and possibly towards 1.1000 which is likely to hold on first testing due to loss of momentum.
In view of this, would not chase this rise here, below 1.0883-88 support would prolong consolidation below said resistance at 1.0951, bring correction towards support at 1.0851 but price should stay above 1.0821 support, bring another rise later. As near term outlook is still mixed, would be prudent to stand aside in the meantime.
Trade Idea : USD/JPY – Buy at 111.55
USD/JPY - 112.16
Most recent candlesticks pattern : N/A
Trend : Near term up
Tenkan-Sen level : 112.06
Kijun-Sen level : 112.09
Ichimoku cloud top : 111.79
Ichimoku cloud bottom : 111.54
Original strategy :
Buy at 111.55, Target: 112.55, Stop: 111.20
Position : -
Target : -
Stop : -
New strategy :
Buy at 111.55, Target: 112.55, Stop: 111.20
Position : -
Target : -
Stop : -
As the greenback has continued trading with a firm undertone after recent rally above previous resistance at 111.74, adding credence to our view that recent upmove is still in progress and bullishness remains for further subsequent gain to 112.50-60 but near term overbought condition should limit upside to 112.80 and price should falter below 113.00-10, risk from there has increased for a retreat to take place later.
In view of this, would not chase this rise here and would be prudent to buy dollar on subsequent pullback as 111.50-55 should limit downside. Below indicated support at 111.21 would abort and suggest a temporary top is formed instead, bring correction towards 110.87 support.

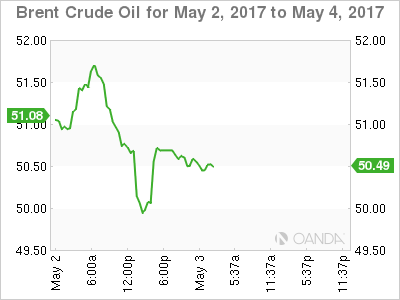
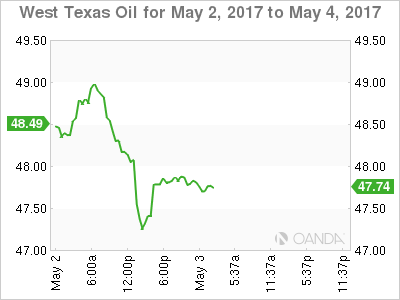
Oil’s Dead Cat Bounce Ahead Of Crude Inventories
Crude oil recouped some of its intra-session losses overnight, but the wolves are still circling.
Oil was whipsawed overnight, as both Brent and WTI fell over two percent in the New York trading session as news hit the wires that OPEC's compliance level had dropped to 90%. Crude was saved by the bell, so to speak, by the API Crude Inventory numbers very late in the session. These showed an unexpectedly large drop in inventories of 4.2 million against an expected draw of 2.3 million barrels sending Brent and WTI up one percent.
Even with the late bounce in prices though, both Brent and WTI remain on their knees from a technical perspective. All attention may be on the FOMC this evening but for energy traders, far more important will be the official EIA Crude Inventories coming out 2.5 hours before the main event. The market is expecting a 3 million barrel draw down, and we can expect a decent move on a miss either way.
Brent spot trades at 50.50 in early Asia having broken and closed below its 200-day moving average at 50.95 overnight. Above here resistance is at 51.75. Support lies at 49.75 and then the March low at 49.50 close behind. A break here could see more stop loss selling.
WTI spot trades at 47.75 in Asia with two closes under its 200-day moving average now at 48.75. Behind this is a double top resistance at 49.00. Support lies at 47.10 and then the March low of 46.50. Like Brent, a break of the latter level could see another stampede for the exit.
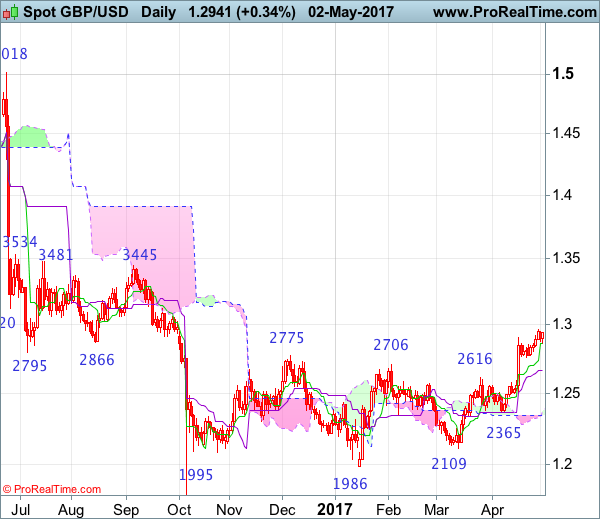
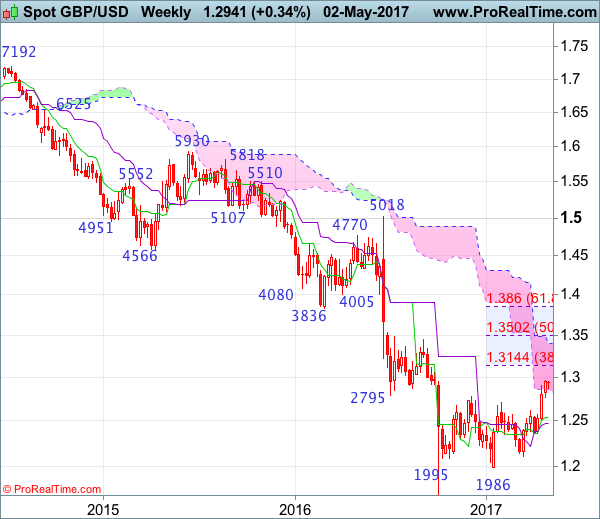
GBP/USD Candlesticks and Ichimoku Analysis
Weekly
• Last Candlesticks pattern: Long white candlestick
• Time of formation: 16 Jan 2017
• Trend bias: Down
Daily
• Last Candlesticks pattern: Long white candlestick
• Time of formation: 18 Apr 2017
• Trend bias: Near term up
GBP/USD – 1.2906
Although cable has continued moving higher after last week’s gap-up opening and bullishness remains for the erratic rise from 1.1986 low (Jan low) to bring retracement of early downtrend to 1.3000 psychological resistance, loss of near term upward momentum should prevent sharp move beyond 1.3090-00 and reckon 1.3140-50 (38.2% Fibonacci retracement of 1.5018-1.1986) would hold on first testing, risk from there is seen for a retreat to take place later.
On the downside, whilst initial pullback to 1..2860-65 and possibly support at 1.2757 is likely, reckon downside would be limited to 1.2700-10 and bring another rise later to aforesaid upside targets. A daily close below the Kijun-Sen (now at 1.2665) would suggest top is possibly formed instead, risk correction to previous resistance at 1.2616 but downside should be limited to 1.2575 and price should stay well above 1.2500, bring another rally later.
Recommendation: Buy at 1.2710 for 1.2910 with stop below 1.2610.
On the weekly chart, as cable has maintained a firm undertone after recent rally above resistance at 1.2775, adding credence to our bullish view that the erratic rise from this year’s low at 1.1986 has resumed and near term upside bias remains for this rise to bring retracement of early decline and gain to psychological resistance at 1.3000, however, reckon upside would be limited to 1.3090-00 and price should falter well below 1.3140-50 (38.2% Fibonacci retracement of 1.5018-1.1986), bring retreat later.
On the downside, although initial pullback to 1.2850 and 1.2800 cannot be ruled out, reckon downside would be limited to another previous resistance at 1.2706 and bring another rise later. Below 1.2640-50 would risk test of previous resistance at 1.2616, break there would defer and suggest top is possibly formed, bring weakness to 1.2550-60 but last week’s low at 1.2515 should hold, bring another rise later. Only a drop below 1.2500 would abort and signal top is formed instead, then test of the Kijun-Sen (now at 1.2476) would follow but support at 1.2365 should remain intact.
Australia’s Services Sector Expanded Further In April
For the 24 hours to 23:00 GMT, the AUD rose 0.16% against the USD and closed at 0.7538.
LME Copper prices rose 1.0% or $58.0/MT to $5746.5/MT. Aluminium prices declined 1.1% or $21.0/MT to $1909.0/MT.
In the Asian session, at GMT0300, the pair is trading at 0.7517, with the AUD trading 0.28% lower against the USD from yesterday's close.
Overnight data indicated that Australia's AiG performance of services index advanced to a level of 53.0 in April, after recording a level of 51.7 in the previous month.
The pair is expected to find support at 0.7498, and a fall through could take it to the next support level of 0.7478. The pair is expected to find its first resistance at 0.7546, and a rise through could take it to the next resistance level of 0.7574.
Looking ahead, a speech by the Reserve Bank of Australia's (RBA) Governor, Philip Lowe along with Australia's trade balance figures and HIA new home sales data, both for March, slated to release tomorrow, will be on investors' radar.
The currency pair is trading below its 20 Hr moving average and showing convergence with its 50 Hr moving average.

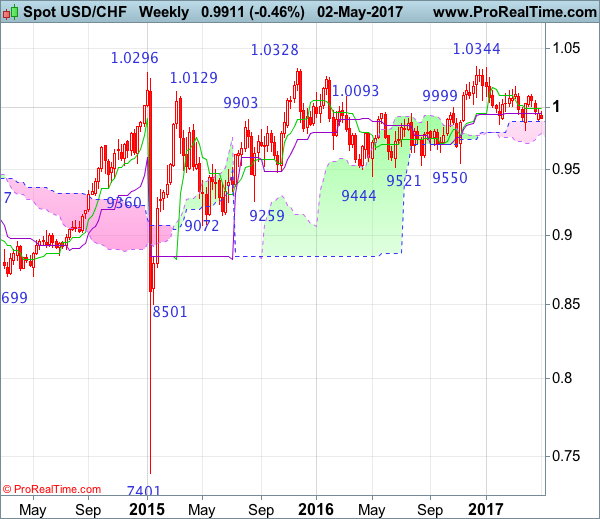
USD/CHF Candlesticks and Ichimoku Analysis
Weekly
• Last Candlesticks pattern: Doji
• Time of formation: 26 Sep 2016
• Trend bias: Sideways
Daily
• Last Candlesticks pattern: Shooting star
• Time of formation: 25 Oct 2016
• Trend bias: Near term up
USD/CHF – 0.9978
As the greenback found support at 0.9893 after opening lower last week and recovered, suggesting consolidation above this level would be seen, however, reckon resistance at 1.0000-08 would limit upside and bring another decline later, below said support at 09893 would signal the rebound from 0.9813 has ended bring another fall to this level. Looking ahead, only a drop below said support at 0.9813 would revive bearishness and signal the decline from 1.0344 top has resumed instead and extend further fall to 0.9735-40 (76.4% retracement of 0.9550-1.0344) and later towards 0.9700 but reckon 0.9650-60 would hold.
On the upside, a daily close above said resistance at 1.0000-08 would suggest a temporary low is formed, then gain to 1.0025-30 (61.8% Fibonacci retracement of 1.0108-0.9893) would be seen, however, break of 1.0067 is needed to retain bullishness and signal the retreat from 1.0108 has ended, bring retest of this level later, break there would extend the rebound from 0.9813 towards key resistance at 1.0171. Looking ahead, only a sustained breach above this level would add credence to our view that the erratic decline from 1.0344 top has ended at 0.9813, bring further rise to 1.0200-10, then 1.0250 but price should falter well below said resistance at 1.0344 (2016 high).
Recommendation: Hold long entered at 0.9990 for 1.0190 with stop below 0.9890.
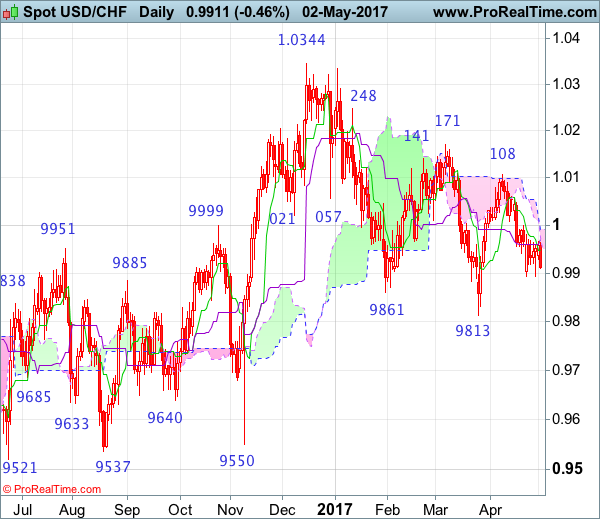
On the weekly chart, as the greenback continued finding support at 0.9893, retaining our view that further consolidation would be seen and still reckon the upper Kumo (now at 0.9886) would limit downside, bring rebound later to the Tenkan-Sen (now at 0.9992) but break of resistance at 1.0067 is needed to retain bullishness and signal the retreat from 1.0108 has ended, bring retest of this level. A break above 1.0108 would extend the rebound from 0.9813 to resistance at 1.0171, however, a weekly close above this level is needed to confirm the fall from 1.0344 top has ended at 0.9813, bring further subsequent rise towards key resistance at 1.0248. A sustained breach above this level would signal early upmove has possibly resumed, bring test of 1.0335-44 resistance area, above there would provide confirmation and headway to 1.0400-10 and later 1.0500 would follow.
On the downside, below the upper Kumo (now at 0.9886) would defer but only break of indicated support at 0.9813 would abort and signal the erratic fall from 1.0344 top is still in progress, bring further decline for retracement of early upmove to 0.9735-40, then 0.9700 but reckon downside would be limited to 0.9640-50 and price should stay well above support at 0.9550.