Sample Category Title
Fed Expected To Keep Rates Steady In May
Eurozone Q1 GDP initial readings (YoY and QoQ) will be released at 10:00 BST today, followed by the US Markit Services and Composite PMIs (Apr) at 14:45 BST, the US ISM non-manufacturing PMI (Apr) at 15:00 BST and the FOMC interest rate decision at 19:00 BST.
The crucial US ISM non-manufacturing PMI and manufacturing PMI have been above 50.0 for some time: Non-Manufacturing PMI since February 2010 and Manufacturing PMI since March 2016. Despite the recent moderate slowdown in manufacturing sector, the figures indicate that both the US service and manufacturing sectors saw continuous expansions.
The FOMC meeting will be held this evening at 19:00 BST. Per the Fed's 'gradual pace of rate hikes' markets are expecting the Fed to raise rates in June, instead of May, since the Fed just raised rates in March.
It is reported that Fed Chair Yellen is not due to hold a press conference today, therefore, there will not be any economic forecast provided. The only focus on the meeting will be whether there are any hints in the monetary policy statement about prospective shrinking of its balance sheet. During the past 10 years, the Fed has added its balance sheet over $4.5 trillion in bonds. The Fed needs to see a stable upswing in economic growth and inflation before unwinding its balance sheet.
However, the recent US economic data has been weak, such as the non-farm payroll in March, the Q1 GDP and auto sales etc. which makes a rate hike even more unlikely this month. Per the CME's FedWatch tool the probability for a rate hike in May is just 4.8% whereas for June it is 67.4%.
Recently several Fed officials are forecasting two more rate hikes by the end of this year. Markets are expecting one in June and one in September. The recent soft US data has not yet reduced the probability of a rate hike in June. However, if the upcoming data keeps on underperforming, it will put more stress on the Fed to raise rates.
With a possibility of a shrinking balance sheet in today's statement, USD is likely to rise. The dollar index will likely recover from the significant resistance level at 99.00. Conversely, if it is not mentioned in the statement, we can expect that the market will not have a big reaction to it, as it will be just in line with market expectations to keep rates on hold.
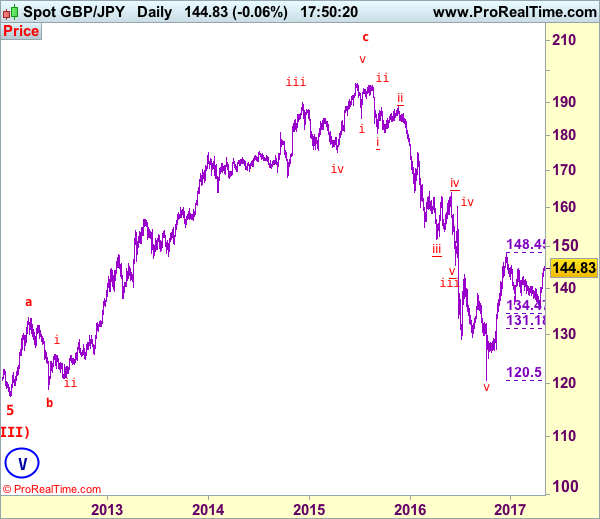
GBP/JPY Elliott Wave Analysis
GBP/JPY – 144.85
GBP/JPY – Wave 5 as well as wave (III) has possibly ended at 116.85
Sterling has surged again after brief pullback and indicated previous resistance at 144.75 was penetrated, adding credence to our bullish view that the correction from 148.45 has ended at 135.60 (B leg trough) last month, hence upside bias remains for the rebound from there to extend gain to 145.40-50, then 146.35-40 but near term overbought condition should prevent sharp move beyond 147.40-50 and price should falter well below said resistance at 148.45 (A leg top), bring retreat later.
Our preferred count is that larger degree wave V with circle is unfolding from 251.12 with wave (I) 219.34, (II): 241.38 and wave (III) is subdivided into 1: 192.60, 2: 215.89 (23 Jul 2008) and wave 3 ended at 118.87 earlier in 2009. The correction from there to 162.60 is wave 4 which itself is a double three and is labeled as first a-b-c ended at 151.53, followed by wave x at 139.03, 2nd a ended at 162.60, 2nd b at 146.75 and 2nd c leg of wave 4 ended at 163.00. Therefore, the decline from 163.00 to 116.85 is now treated as wave 5 which also marked the end of larger degree wave (III), hence wave (IV) major correction has commenced for retracement of the wave (III) from 241.38 and upside target at 183.95-00 (50% Fibonacci retracement of the wave (II) from 241.38) had been met, a drop below 160.00 would suggest wave (IV) has ended at 195.85, bring decline in wave (V) for initial weakness to 130 (already met) and 120.
On the downside, whilst pullback to 144.00-10 is likely, reckon downside would be limited to 143.00 and renewed buying interest should emerge above 142.50-60, bring another rise later. Below previous minor resistance at 142.10-15 would defer and risk correction to 141.50, then 141.00 but price should stay above another previous resistance at 140.35 and bring another rise later to aforesaid upside targets.
Recommendation: Buy sterling at 142.85 for 144.85 with stop below 141.85.
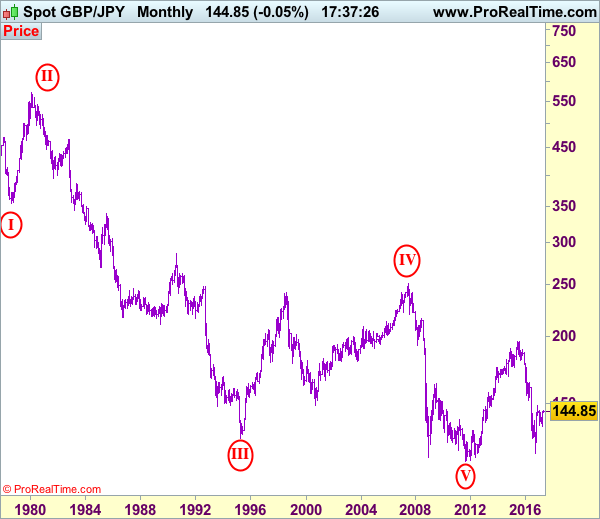
The long-term downtrend from 570.99 (29 Feb 1980) is labeled as an impulsive wave with III with circle ended at 129.77 (20 Apr 1995) and the corrective rebound to 251.12 (20 Jul 2007) is treated as wave IV with circle and the wave V with circle selloff from 251.12 has possibly ended at 116.80 (almost reached our indicated target at 116.00) and major correction has commenced from there and indicated upside target at 183.90-00 (50% Fibonacci retracement of 251.10-116.85) had been met, reckon upside would be limited to 199.80-90 (61.8% Fibonacci retracement) and bring wave (V) decline in later part of 2017.
USD Edges Higher Ahead Of FOMC Meeting
Fed set to remain on hold
The FOMC meeting is clearly the key FX event of the day. The market is not pricing a rate hike, the likelihood of which is estimated at below 15%. Markets already feel more confident for a rate hike at the next meeting in June and today’s meeting is unlikely to change anything. The Fed should likely show its optimism in its statements. The inflation target of 2% was beaten in February before falling again below this level.
We expect a clearer assessment of the US economic situation after the recent lacklustre data (GDP and personal consumption in particular). The non-farm payroll employment for March disappointed (98k new jobs) after strong data in February (220k). In March, industrial production also saw its biggest decline for the last two years. We remain suspicious on Fed rate tightening as we believe that the state of the US economy is overestimated. For example, the number of bankruptcies in the US in 2017 is already higher than all bankruptcies in 2016.
On top of that, the second-hand car market is collapsing as the losses on auto credit subprime have reached their highest level. Last but not least, 60% of Americans - according to a CNN poll - do not have a $500 emergency fund. This is why we maintain our bullish position on the EURUSD, despite political uncertainties in Europe.
NZD holds ground amid strong job report
The USD extended gains against most of its peers ahead of today’s FOMC meeting and ADP job report. The New Zealand dollar was among the few that was able to resist against the increasing demand for the greenback. NZD/USD rose to 0.6969 this morning amid a solid job report. The unemployment rate fell to 4.9% in the March quarter, widely beating market expectation of 5.1% and previous reading of 5.2%. The surprise increase in the participation (70.6% versus 70.5%), together with a solid growth in employment (+5.7%y/y versus 5.3% expected).
However, the tightening of the job market failed translate into wage growth. Indeed, average hourly earnings rose only 0.3%q/q, while market participants were expecting a reading of 0.7%. This weak reading should keep the RBNZ on the back foot at its next meeting on May 11th as it gives Governor Wheeler an excuse to stay on the dovish side for another round. The Aussie was heavily sold against the Kiwi this morning with AUD/NZD sliding 0.50% to 1.0795. The closest support can be found at 1.0755 (Fibonacci 38.2% on January-March rally). If broken, the door is wide open towards 1.07, then 1.06.
Technical Outlook: WTI Oil – Price Bounces On Stronger Than Expected Drawdown In Oil Stocks (API), Focus On EIA...
US oil price bounced from fresh five-week low at 47.35 posted on Tuesday and returned above $48.00 handle. The rally was triggered by release of API report that showed stronger than expected drawdown in Crude oil stocks that by 4.2 million barrels in the week ended Apr 28 compared to 2.3 million barrels draw forecasted.
Focus turns on today's EIA crude inventories report which shows forecast for 2.3 million barrels draw in the week ended Apr 28, compared to the previous week's draw of 3.6 million barrels.
Oil prices remain under pressure on global supply that remains near record high and offsets impact of OPEC production cut that aims to support oil price.
US oil remains in step descend from $53.74 (12 Apr high) and approaches key med-term supports at $47.07 (higher base / 2017 lows) and $46.44 (top of thick weekly cloud).
Technical studies are firmly bearish (10/200 SMA Death cross is forming at $49.12) that signals additional pressure.
However, hesitation ahead of key $47.07 support could be anticipated and upticks may extend on better- than-expected crude stocks release today.
Thick daily cloud (spanned between $49.70 and $51.03) weighs heavily and cloud base is expected to limit extended upticks.
Alternative scenario requires firm break above psychological $50.00 barrier to ease existing downside pressure.
Res: 48.21, 48.53, 49.26, 49.70
Sup: 47.80, 47.35, 47.07, 46.44
Technical Outlook: Aussie Reverses Lower After Failure At 200SMA
The Aussie was sharply lower on Wednesday and eased below 0.7500 handle after recovery rally from 0.7438 failed to clear key 200SMA barrier.
Fresh weakness through hourly cloud (0.7520/00) so far probed below 0.7482 (Fibo 61.8% of 0.7438/0.7554 upleg), signaling further weakness.
Close below daily Tenkan-sen (0.7510) will be seen as bearish signal, with close below 0.7482 needed to confirm reversal.
Technical studies on lower timeframes turned into bearish mode and maintain downside risk.
Cluster of resistances that lies within 0.7500/0.7524 zone is should keep the upside limited, with converged 20/100SMA's at 0.7524 (attempting to form bear-cross) expected to cap upticks.
Res: 0.7500, 0.7510, 0.7524, 0.7549
Sup: 0.7480, 0.7465, 0.7438, 0.7400
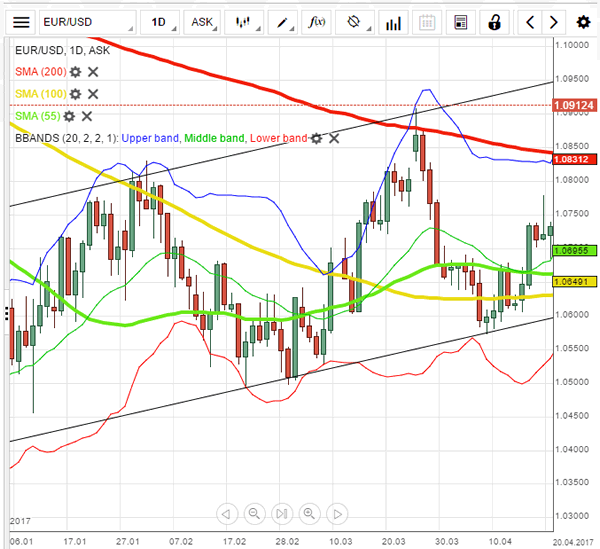
EURUSD Analysis: Remains Above 1.09 Mark
'While traders see little chance of a Fed interest rate hike this week, an increase is seen as much more likely in June.' – Alexandria Arnold and Dennis Pettit, Bloomberg
Pair's Outlook
On Wednesday morning the common European currency had slightly retreated against the US Dollar, as the currency exchange rate continued to trade above the 1.09 mark. The reason for the almost flat trading was the fact that the markets are expecting fundamental data in the form of the EU GDP and the US Federal Funds Rate later in the day. Meanwhile, from a technical perspective the currency pair remains below a strong resistance cluster, which surrounds the upper trend line of a long term ascending channel.
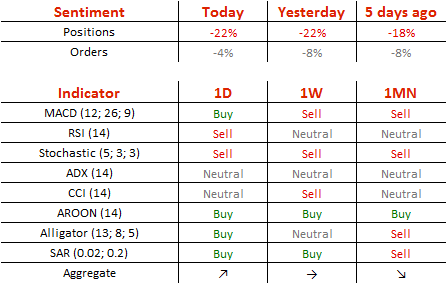
Traders' Sentiment
SWFX traders continue to short the Euro, as 61% of open positions are bearish. Meanwhile, 52% of trader set up orders are to sell.
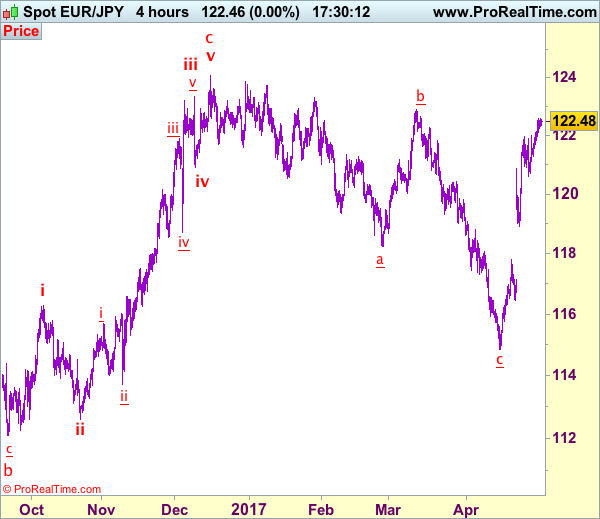
Trade Idea: EUR/JPY – Buy at 120.65
EUR/JPY - 122.48
Recent wave: wave v of (C) ended at 94.12 and major correction in wave A has ended at 149.79
Trend: Near term up
Original strategy:
Buy at 120.65, Target: 122.85, Stop: 120.05
Position: -
Target: -
Stop: -
New strategy :
Buy at 120.65, Target: 122.85, Stop: 120.05
Position: -
Target: -
Stop:-
Although the single currency has maintained a firm undertone after recent rally above previous resistance at 122.01 and near term upside bias remains for further gain to 122.55-60, loss of upward momentum should prevent sharp move beyond previous resistance at 122.89 (b leg top) and price should falter below 123.50-60, risk from there has increased for a retreat to take place later this week.
In view of this, would not chase this rise here and would be prudent to buy euro on subsequent pullback as 120.60-65 should limit downside. Below 120.25-30 would defer and suggest top is possibly formed, risk weakness to 120.00, then 119.45-50 but reckon support at 118.92 would contain downside and euro may stage another rally from there.
Our latest preferred count is that wave (ii) is ABC-X-ABC which ended at 123.33 and wave (iii) is unfolding with wave iii ended at 100.77, followed by wave iv at 111.57 and wave v as well as the wave (iii) has ended at 97.04, followed by wave (iv) at 111.43 and wave (v) has ended at 94.12 which is also the end of the larger degree v, this also implied the major wave (C) has also ended there, hence major correction has commenced from there with (A) leg unfolding in its lower degree wave c which has possibly ended at 145.69. Under this count, A-B-C wave (B) has commenced with A leg ended at 136.23, wave B at 143.79 and wave C has possibly ended at 149.79.
Our larger degree count is that the decline from 139.26 is wave (C) and is sub-divided into a diagonal triangle i-ii-iii-iv-v with wave i - 105.44, wave ii- 123.33, wave iii - 97.03, wave iv - 111.43, followed by the final wave v as well as the end of wave (C) at 94.12, this also mark the bottom of larger degree wave B. Under this count, major rise in wave C has commenced as an impulsive wave with minor wave III ended at 145.69, wave V is still in progress for further gain to 150.00. Having said that, this so-called wave V could well be the first leg of larger degree 5-waver wave C and this wave C should bring at least a retest of wave A top at 169.97 (July 2008).
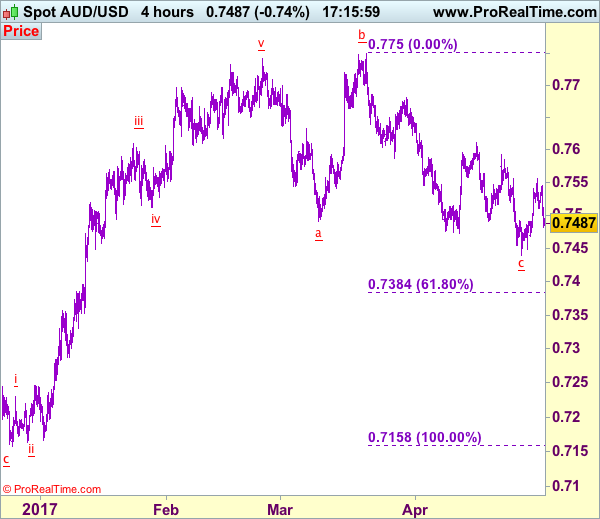
Trade Idea: AUD/USD – Stand aside
AUD/USD – 0.7486
Recent wave: Wave 5 ended at 1.1081 and major correction has commenced for fall to 0.7000 and then towards 0.6500-10
Trend: Near term down
New strategy :
Stand aside
Position: -
Target: -
Stop:-
Although aussie rebounded to 0.7556 yesterday, lack of follow through buying and current retreat suggest further consolidation would be seen, however, reckon downside would be limited to 0.7468 and last week’s low at 0.7440 should remain intact, bring another rebound later. Only a break of this support would shift risk back to downside and signal recent decline has resumed and extend weakness to 0.7390-00 first.
On the upside, whilst recovery to 0.7520-25 cannot be ruled out, break of said resistance at 0.7556 is needed to revive bullishness and add credence to our view that low has possibly been formed at 0.7440, then further gain to resistance at 0.7592, a sustained breach above this level would provide confirmation, bring further subsequent rise to 0.7611.
On the 4-hour chart, the move from 0.8066 is the wave 5 with i: 0.8860, ii: 0.8315, wave iii is an extended move ended at 1.0183, iv: 0.9706 and wave v has ended at 1.1081 (also the top of entire wave 5). The subsequent selloff is the major correction which is unfolding as ABC-X-ABC and 2nd A leg has ended at 0.8848, followed by a-b-c wave B which ended at 0.9758, hence, 2nd C wave is now in progress and indicated downside target at 0.7000 and 0.6950 had been met, so further fall to 0.6710-20 cannot be ruled out.
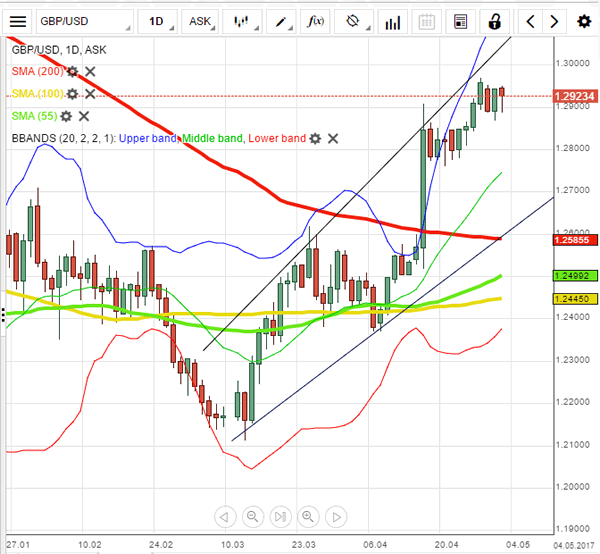
GBPUSD Analysis: Expected To Return Under 1.29
'We expect GBPUSD to drop to 1.23 in 3M on a combination of 1) general USD strength and 2) a rocky start to the UK/EU negotiations for an exit agreement.' – BMO Capital Markets (based on PoundSterlingLive)
Pair's Outlook
The British Pound surprised with its performance on Tuesday, being that it outperformed the US Dollar and reclaimed the 1.29 level. Technical indicators today keep giving positive signals, suggesting the Sterling is to edge higher against the Buck for another day. Such an outcome is possible, but in this case gains are likely to be capped around 1.3020, with the broadening rising wedge's upper border and the weekly R1 representing resistance there. On the other hand, upbeat US fundamentals could boost the Greenback, which would cause the Cable to fall even under the second support, namely the weekly S1.
Traders' Sentiment
There are 52% of traders holding short positions today (previously 51%), whereas 67% of all pending orders are to acquire the Pound.
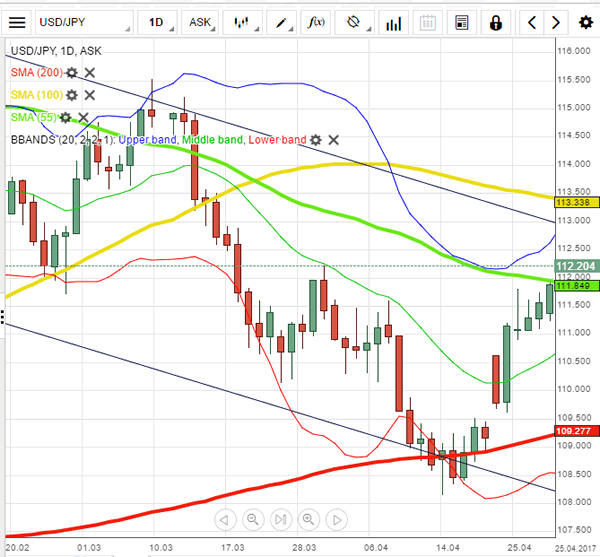
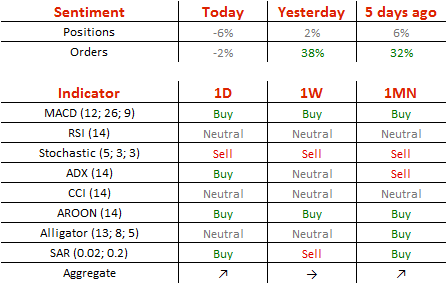
USD/JPY Analysis: Attempts To Reach 113.00
'Concerns about geopolitical risks such as North Korea had weighed on the dollar against the yen recently... But the focus is shifting to whether the (strength) of US economic fundamentals is for real. There is more data coming up including the jobs data, so those need to be watched closely.' – Sumitomo Mitsui Banking Corporation (based on The Business Times)
Pair's Outlook
Despite having appreciated against the Japanese Yen yesterday, the US Dollar still retreated from its intraday high, as it lacked momentum to pierce the second resistance level. Nevertheless, the USD/JPY pair has the opportunity to pierce this supply level today, with the 112.95 level expected to be the intraday high, as it marks the descending channel's upper border. The given trend-line is also reinforced by the upper Bollinger band and the monthly R1, while technical indicators are now giving bullish signals in the daily timeframe. The base case scenario, however, is a close around 112.60.
Traders' Sentiment
Market sentiment is relatively neutral, as 53% of all open positions are short and the remaining 47% are long. At the same time, the number of orders to buy the Buck plunged from 69 to 49%.